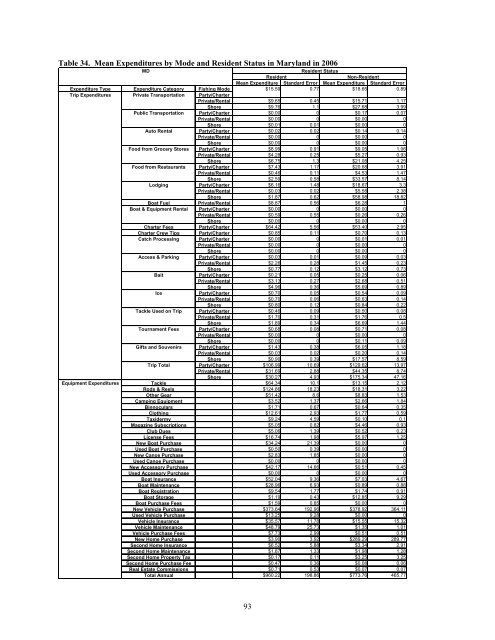
Table 34. Mean <strong>Expenditures</strong> by Mode and Resident Status <strong>in</strong> Maryland <strong>in</strong> 2006 MD Resident Status Resident Non-Resident Mean Expenditure Standard Error Mean Expenditure Standard Error Expenditure Type Expenditure Category Fish<strong>in</strong>g Mode $15.59 0.77 $18.65 0.89 Trip <strong>Expenditures</strong> Private Transportation Party/Charter Private/Rental $9.65 0.45 $15.71 1.17 Shore $9.76 1.1 $27.68 3.99 Public Transportation Party/Charter $0.00 0 $0.17 0.07 Private/Rental $0.00 0 $0.00 0 Shore $0.01 0.01 $0.00 0 Auto Rental Party/Charter $0.02 0.02 $0.14 0.14 Private/Rental $0.00 0 $0.00 0 Shore $0.00 0 $0.00 0 Food from Grocery Stores Party/Charter $8.99 0.91 $9.05 1.06 Private/Rental $4.28 0.25 $5.27 0.93 Shore $6.75 1.3 $21.08 4.25 Food from Restaurants Party/Charter $7.43 1.17 $20.68 3.91 Private/Rental $0.46 0.11 $4.53 1.47 Shore $2.59 0.58 $33.57 8.14 Lodg<strong>in</strong>g Party/Charter $6.16 1.48 $18.67 3.3 Private/Rental $0.03 0.02 $5.58 2.38 Shore $1.87 0.62 $58.98 18.82 Boat Fuel Private/Rental $8.87 0.56 $6.28 1 Boat & Equipment Rental Party/Charter $0.00 0 $0.00 0 Private/Rental $0.59 0.55 $0.26 0.26 Shore $0.00 0 $0.00 0 Charter Fees Party/Charter $64.42 5.56 $53.40 2.95 Charter Crew Tips Party/Charter $0.85 0.11 $0.70 0.13 Catch Process<strong>in</strong>g Party/Charter $0.00 0 $0.01 0.01 Private/Rental $0.00 0 $0.00 0 Shore $0.00 0 $0.00 0 Access & Park<strong>in</strong>g Party/Charter $0.03 0.01 $0.09 0.03 Private/Rental $2.26 0.28 $1.45 0.23 Shore $0.77 0.12 $3.12 0.73 Bait Party/Charter $0.21 0.05 $0.25 0.06 Private/Rental $3.13 0.27 $2.68 0.51 Shore $4.96 0.36 $5.69 0.89 Ice Party/Charter $0.70 0.05 $0.54 0.09 Private/Rental $0.70 0.06 $0.63 0.14 Shore $0.80 0.12 $0.84 0.22 Tackle Used on Trip Party/Charter $0.46 0.09 $0.50 0.08 Private/Rental $1.70 0.31 $1.76 0.5 Shore $1.89 0.34 $6.69 1.44 Tournament Fees Party/Charter $0.68 0.08 $0.71 0.08 Private/Rental $0.00 0 $0.00 0 Shore $0.00 0 $0.11 0.09 Gifts and Souvenirs Party/Charter $1.43 0.38 $6.05 1.18 Private/Rental $0.03 0.02 $0.20 0.14 Shore $0.90 0.39 $17.57 8.59 Trip Total Party/Charter $106.99 10.69 $129.62 13.97 Private/Rental $31.69 2.88 $44.35 8.74 Shore $30.27 4.93 $175.34 47.16 Equipment <strong>Expenditures</strong> Tackle $64.34 10.1 $13.15 2.12 Rods & Reels $124.86 18.23 $18.31 3.22 O<strong>the</strong>r Gear $51.42 8.6 $8.83 1.53 Camp<strong>in</strong>g Equipment $3.52 1.37 $2.66 1.84 B<strong>in</strong>noculars $1.71 0.67 $0.64 0.35 Cloth<strong>in</strong>g $12.61 2.93 $1.77 0.59 Taxidermy $9.24 4.59 $0.10 0.1 Magaz<strong>in</strong>e Subscriptions $5.05 0.82 $4.46 0.93 Club Dues $5.06 1.39 $0.52 0.23 License Fees $16.74 1.98 $5.97 1.25 New Boat Purchase $34.24 21.39 $0.00 0 Used Boat Purchase $0.50 0.39 $0.00 0 New Canoe Purchase $2.83 1.85 $0.00 0 Used Canoe Purchase $0.00 0 $0.00 0 New Accessory Purchase $42.17 14.66 $0.51 0.45 Used Accessory Purchase $0.00 0 $0.00 0 Boat Insurance $52.04 9.36 $7.03 4.67 Boat Ma<strong>in</strong>tenance $28.96 6.93 $0.89 0.88 Boat Registration $9.54 1.77 $1.74 0.91 Boat Storage $1.19 0.43 $12.85 9.29 Boat Purchase Fees $1.59 0.85 $0.00 0 New Vehicle Purchase $373.64 192.96 $378.92 364.11 Used Vehicle Purchase $13.25 9.28 $0.00 0 Vehicle Insurance $35.57 11.78 $15.55 15.32 Vehicle Ma<strong>in</strong>tenance $48.79 25.73 $1.35 1.01 Vehicle Purchase Fees $7.73 2.99 $0.51 0.51 New Home Purchase $3.90 3.92 $289.29 289.77 Second Home Insurance $6.52 5.88 $3.34 2.91 Second Home Ma<strong>in</strong>tenance $1.87 1.33 $1.98 1.28 Second Home Property Tax $0.17 0.11 $3.25 3.25 Second Home Purchase Fee $0.47 0.36 $0.08 0.06 Real Estate Commissions $0.71 0.53 $0.07 0.07 Total Annual $960.22 198.86 $773.76 465.77 93
Table 35. Total <strong>Mar<strong>in</strong>e</strong> Recreational Fish<strong>in</strong>g <strong>Expenditures</strong> <strong>in</strong> Maryland by Resident Status <strong>in</strong> 2006 (<strong>in</strong> thousands <strong>of</strong> dollars) MD Resident Status Resident Non-Resident Total Expenditure Lower Bound Upper Bound Total Expenditure Lower Bound Upper Bound Expenditure Type Expenditure Category Fish<strong>in</strong>g Mode $2,084 $1,282 $2,886 $2,027 $1,080 $2,975 Trip <strong>Expenditures</strong> Private Transportation Party/Charter Private/Rental $14,796 $12,739 $16,852 $7,028 $5,370 $8,685 Shore $10,129 $7,456 $12,803 $9,288 $5,690 $12,887 Public Transportation Party/Charter $0 $0 $1 $18 $2 $34 Private/Rental $0 $0 $0 $0 $0 $0 Shore $7 $0 $19 $0 $0 $0 Auto Rental Party/Charter $3 $0 $9 $15 $0 $45 Private/Rental $0 $0 $0 $0 $0 $0 Shore $0 $0 $0 $0 $0 $0 Food from Grocery Stores Party/Charter $1,202 $696 $1,708 $983 $482 $1,485 Private/Rental $6,553 $5,538 $7,569 $2,358 $1,438 $3,279 Shore $7,007 $4,177 $9,838 $7,074 $3,716 $10,433 Food from Restaurants Party/Charter $993 $516 $1,470 $2,248 $937 $3,560 Private/Rental $699 $373 $1,026 $2,028 $694 $3,362 Shore $2,690 $1,441 $3,939 $11,264 $5,164 $17,364 Lodg<strong>in</strong>g Party/Charter $824 $335 $1,313 $2,029 $874 $3,185 Private/Rental $43 $0 $106 $2,495 $363 $4,628 Shore $1,937 $656 $3,218 $19,789 $6,432 $33,146 Boat Fuel Private/Rental $13,592 $11,395 $15,788 $2,810 $1,790 $3,829 Boat & Equipment Rental Party/Charter $0 $0 $0 $0 $0 $0 Private/Rental $908 $0 $2,560 $117 $0 $347 Shore $0 $0 $0 $0 $0 $0 Charter Fees Party/Charter $8,609 $5,094 $12,125 $5,805 $3,074 $8,536 Charter Crew Tips Party/Charter $113 $62 $164 $76 $33 $120 Catch Process<strong>in</strong>g Party/Charter $0 $0 $1 $1 $0 $3 Private/Rental $0 $0 $0 $0 $0 $0 Shore $0 $0 $0 $0 $0 $0 Access & Park<strong>in</strong>g Party/Charter $4 $1 $8 $10 $3 $17 Private/Rental $3,460 $2,553 $4,368 $648 $412 $885 Shore $796 $521 $1,072 $1,047 $495 $1,599 Bait Party/Charter $28 $11 $46 $27 $10 $45 Private/Rental $4,791 $3,828 $5,754 $1,201 $700 $1,702 Shore $5,148 $4,105 $6,190 $1,909 $1,135 $2,682 Ice Party/Charter $93 $56 $130 $58 $26 $91 Private/Rental $1,074 $863 $1,286 $282 $145 $418 Shore $826 $555 $1,097 $282 $121 $442 Tackle Used on Trip Party/Charter $62 $29 $95 $55 $24 $85 Private/Rental $2,613 $1,630 $3,595 $787 $329 $1,244 Shore $1,962 $1,208 $2,716 $2,246 $1,130 $3,363 Tournament Fees Party/Charter $91 $51 $131 $77 $38 $116 Private/Rental $0 $0 $0 $0 $0 $0 Shore $0 $0 $0 $38 $0 $97 Gifts and Souvenirs Party/Charter $191 $71 $312 $658 $270 $1,046 Private/Rental $40 $0 $86 $90 $0 $216 Shore $930 $133 $1,727 $5,897 $81 $11,713 Trip Total Party/Charter $14,300 $8,205 $20,398 $14,090 $6,853 $21,344 Private/Rental $48,570 $38,919 $58,991 $19,843 $11,240 $28,595 Shore $31,432 $20,251 $42,620 $58,834 $23,962 $93,726 Mode Sub-Total All $94,302 $67,376 $122,008 $92,767 $42,054 $143,665 Equipment <strong>Expenditures</strong> Tackle $52,570 $35,655 $69,485 $5,879 $3,800 $7,958 Rods & Reels $102,028 $71,277 $132,779 $8,186 $5,084 $11,288 O<strong>the</strong>r Gear $42,019 $27,686 $56,352 $3,946 $2,468 $5,423 Camp<strong>in</strong>g Equipment $2,877 $667 $5,087 $1,188 $0 $2,805 B<strong>in</strong>noculars $1,397 $312 $2,482 $287 $0 $595 Cloth<strong>in</strong>g $10,305 $5,512 $15,098 $791 $259 $1,324 Taxidermy $7,547 $167 $14,927 $43 $0 $127 Magaz<strong>in</strong>e Subscriptions $4,125 $2,748 $5,502 $1,993 $1,121 $2,865 Club Dues $4,138 $1,875 $6,401 $231 $29 $433 License Fees $13,675 $10,250 $17,101 $2,669 $1,499 $3,839 New Boat Purchase $27,979 $0 $62,302 $0 $0 $0 Used Boat Purchase $408 $0 $1,035 $0 $0 $0 New Canoe Purchase $2,315 $0 $5,282 $0 $0 $0 Used Canoe Purchase $0 $0 $0 $0 $0 $0 New Accessory Purchase $34,455 $10,782 $58,128 $228 $0 $623 Used Accessory Purchase $2 $0 $5 $0 $0 $0 Boat Insurance $42,519 $27,007 $58,030 $3,140 $0 $7,247 Boat Ma<strong>in</strong>tenance $23,665 $12,352 $34,978 $396 $0 $1,171 Boat Registration $7,792 $4,866 $10,717 $779 $0 $1,585 Boat Storage $968 $273 $1,664 $5,742 $0 $13,906 Boat Purchase Fees $1,297 $0 $2,658 $0 $0 $0 New Vehicle Purchase $305,303 $0 $615,339 $169,378 $0 $488,477 Used Vehicle Purchase $10,826 $0 $25,707 $0 $0 $0 Vehicle Insurance $29,063 $10,014 $48,112 $6,949 $0 $20,374 Vehicle Ma<strong>in</strong>tenance $39,870 $0 $81,199 $602 $0 $1,491 Vehicle Purchase Fees $6,316 $1,493 $11,140 $229 $0 $679 New Home Purchase $3,187 $0 $9,464 $129,314 $0 $383,191 Second Home Insurance $5,324 $0 $14,751 $1,494 $0 $4,048 Second Home Ma<strong>in</strong>tenance $1,529 $0 $3,664 $884 $0 $2,009 Second Home Property Tax $142 $0 $315 $1,454 $0 $4,301 Second Home Purchase Fee $384 $0 $954 $38 $0 $91 Real Estate Commissions $577 $0 $1,427 $32 $0 $96 Total Annual $784,602 $457,797 $1,111,407 $345,873 $0 $756,352 State Total <strong>Expenditures</strong> $1,317,545 $567,227 $2,133,432 94
- Page 1:
The Economic Contribution of Marine
- Page 4 and 5:
Suggested citation: Gentner, Brad,
- Page 6 and 7:
LIST OF TABLES Table 1. Intercept a
- Page 8 and 9:
Table 39. Total Income Generated in
- Page 10 and 11:
Table 75. Total Income Generated in
- Page 12 and 13:
Table 111. Total Income Generated i
- Page 14 and 15:
Table 147. Total Employment Generat
- Page 16 and 17:
Table 183. Total Employment Generat
- Page 18 and 19:
Table 219. Total Employment Generat
- Page 20 and 21:
ABSTRACT Marine recreational fishin
- Page 22 and 23:
anked by an index of relative fishi
- Page 24 and 25:
Mail survey questions in Hawaii wer
- Page 26 and 27:
(i.e., fishing tackle or gear), all
- Page 28 and 29:
at the stratum level so it was nece
- Page 30 and 31:
For the remainder of this report, U
- Page 32 and 33:
RESULTS Anglers’ expenditures and
- Page 34 and 35:
level of import requirements for an
- Page 36 and 37:
followed by Texas, North Carolina,
- Page 38 and 39:
Across all of the Pacific and North
- Page 40 and 41:
The $755.9 million spent on retail
- Page 42 and 43:
ethnicity (under both the Rao-Scott
- Page 44 and 45:
storage, and registration with a to
- Page 46 and 47:
Keynesian multipliers can also be u
- Page 48 and 49:
REFERENCES Archer, H.B. 1984. Econo
- Page 50:
APPENDIX I MRIP ECONOMIC INTERCEPT
- Page 65: APPENDIX III LICENSE FRAME MAIL SUR
- Page 79 and 80: Table 2. Angler Effort in Thousands
- Page 81 and 82: Table 4. Recreational Expenditure S
- Page 83 and 84: Table 6. Results of Survey Mode Tes
- Page 85 and 86: Table 7. Mean Expenditures by Mode
- Page 87 and 88: Table 9. Total Economic Impacts Gen
- Page 89 and 90: Table 11. Total Value-Added Generat
- Page 91 and 92: Table 13. Total Employment Generate
- Page 93 and 94: Table 15. Federal and State Tax Imp
- Page 95 and 96: Table 17. Total Marine Recreational
- Page 97 and 98: Table 19. Total Sales/Output Genera
- Page 99 and 100: Table 21. Total Income Generated in
- Page 101 and 102: Table 23. Total Economic Impacts Ge
- Page 103 and 104: Table 25. Mean Expenditures by Mode
- Page 105 and 106: Table 27. Total Economic Impacts Ge
- Page 107 and 108: Table 29. Total Value-Added Generat
- Page 109 and 110: Table 31. Total Employment Generate
- Page 111: Table 33. Federal and State Tax Imp
- Page 115 and 116: Table 37. Total Sales/Output Genera
- Page 117 and 118: Table 39. Total Income Generated in
- Page 119 and 120: Table 41. Total Economic Impacts Ge
- Page 121 and 122: Table 43. Mean Expenditures by Mode
- Page 123 and 124: Table 45. Total Economic Impacts Ge
- Page 125 and 126: Table 47. Total Value-Added Generat
- Page 127 and 128: Table 49. Total Employment Generate
- Page 129 and 130: Table 51. Federal and State Tax Imp
- Page 131 and 132: Table 53. Total Marine Recreational
- Page 133 and 134: Table 55. Total Sales/Output Genera
- Page 135 and 136: Table 57. Total Income Generated in
- Page 137 and 138: Table 59. Total Economic Impacts Ge
- Page 139 and 140: Table 61. Mean Expenditures by Mode
- Page 141 and 142: Table 63. Total Economic Impacts Ge
- Page 143 and 144: Table 65. Total Value-Added Generat
- Page 145 and 146: Table 67. Total Employment Generate
- Page 147 and 148: Table 69. Federal and State Tax Imp
- Page 149 and 150: Table 71. Total Marine Recreational
- Page 151 and 152: Table 73. Total Sales/Output Genera
- Page 153 and 154: Table 75. Total Income Generated in
- Page 155 and 156: Table 77. Total Economic Impacts Ge
- Page 157 and 158: Table 79. Mean Expenditures by Mode
- Page 159 and 160: Table 81. Total Economic Impacts Ge
- Page 161 and 162: Table 83. Total Value-Added Generat
- Page 163 and 164:
Table 85. Total Employment Generate
- Page 165 and 166:
Table 87. Federal and State Tax Imp
- Page 167 and 168:
Table 89. Total Marine Recreational
- Page 169 and 170:
Table 91. Total Sales/Output Genera
- Page 171 and 172:
Table 93. Total Income Generated in
- Page 173 and 174:
Table 95. Total Economic Impacts Ge
- Page 175 and 176:
SOUTHEAST REGION TABLES Alabama Eas
- Page 177 and 178:
Table 98. Total Marine Recreational
- Page 179 and 180:
Table 100. Total Sales/Output Gener
- Page 181 and 182:
Table 102. Total Income Generated i
- Page 183 and 184:
Table 104. Total Economic Impacts G
- Page 185 and 186:
Table 106. Mean Expenditures by Mod
- Page 187 and 188:
Table 108. Total Economic Impacts G
- Page 189 and 190:
Table 110. Total Value-Added Genera
- Page 191 and 192:
Table 112. Total Employment Generat
- Page 193 and 194:
Table 114. Federal and State Tax Im
- Page 195 and 196:
Table 116. Total Marine Recreationa
- Page 197 and 198:
Table 118. Total Sales/Output Gener
- Page 199 and 200:
Table 120. Total Income Generated i
- Page 201 and 202:
Table 122. Total Economic Impacts G
- Page 203 and 204:
Table 124. Total Marine Recreationa
- Page 205 and 206:
Table 126. Total Sales/Output Gener
- Page 207 and 208:
Table 128. Total Income Generated i
- Page 209 and 210:
Table 130. Total Economic Impacts G
- Page 211 and 212:
Table 132. Mean Expenditures by Mod
- Page 213 and 214:
Table 1034. Total Economic Impacts
- Page 215 and 216:
Table 136. Total Value-Added Genera
- Page 217 and 218:
Table 138. Total Employment Generat
- Page 219 and 220:
Table 140. Federal and State Tax Im
- Page 221 and 222:
Table 142. Total Marine Recreationa
- Page 223 and 224:
Table 144. Total Sales/Output Gener
- Page 225 and 226:
Table 146. Total Income Generated i
- Page 227 and 228:
Table 148. Total Economic Impacts G
- Page 229 and 230:
Table 150. Mean Expenditures by Mod
- Page 231 and 232:
Table 152. Total Economic Impacts G
- Page 233 and 234:
Table 154. Total Value-Added Genera
- Page 235 and 236:
Table 156. Total Employment Generat
- Page 237 and 238:
Table 158. Federal and State Tax Im
- Page 239 and 240:
Table 160. Total Marine Recreationa
- Page 241 and 242:
Table 162. Total Sales/Output Gener
- Page 243 and 244:
Table 164. Total Income Generated i
- Page 245 and 246:
Table 166. Total Economic Impacts G
- Page 247 and 248:
Table 168. Mean Expenditures by Mod
- Page 249 and 250:
Table 170. Total Economic Impacts G
- Page 251 and 252:
Table 172. Total Value-Added Genera
- Page 253 and 254:
Table 174. Total Employment Generat
- Page 255 and 256:
Table 176. Federal and Sate Tax Imp
- Page 257 and 258:
Table 178. Total Marine Recreationa
- Page 259 and 260:
Table 180. Total Sales/Output Gener
- Page 261 and 262:
Table 182. Total Income Generated i
- Page 263 and 264:
Table 184. Total Economic Impacts G
- Page 265 and 266:
PACIFIC REGION TABLES California Or
- Page 267 and 268:
Table 187. Total Marine Recreationa
- Page 269 and 270:
Table 189. Total Sales/Output Gener
- Page 271 and 272:
Table 191. Total Income Generated i
- Page 273 and 274:
Table 193. Total Economic Impacts G
- Page 275 and 276:
Table 195. Mean Expenditures by Mod
- Page 277 and 278:
Table 197. Total Economic Impacts G
- Page 279 and 280:
Table 199. Total Value-Added Genera
- Page 281 and 282:
Table 201. Total Employment Generat
- Page 283 and 284:
Table 203. Federal and State Tax Im
- Page 285 and 286:
Table 205. Total Marine Recreationa
- Page 287 and 288:
Table 207. Total Sales/Output Gener
- Page 289 and 290:
Table 209. Total Income Generated i
- Page 291 and 292:
Table 211. Total Economic Impacts G
- Page 293 and 294:
NORTH PACIFIC REGION TABLES Alaska
- Page 295 and 296:
Table 214. Total Marine Recreationa
- Page 297 and 298:
Table 216. Total Sales/Output Gener
- Page 299 and 300:
Table 218. Total Income Generated i
- Page 301 and 302:
Table 220. Total Economic Impacts G
- Page 303 and 304:
HAWAII TABLES 284
- Page 305 and 306:
Table 223. Total Marine Recreationa
- Page 307 and 308:
Table 225. Total Sales/Output Gener
- Page 309 and 310:
Table 227. Total Income Generated i
- Page 311 and 312:
Table 229. Total Economic Impacts G
- Page 313 and 314:
UNITED STATES TABLES 294
- Page 315 and 316:
Table 232. Total Economic Impacts G
- Page 317 and 318:
Table 234. Total Value-Added Genera
- Page 319 and 320:
Table 236. Total Employment Generat
- Page 321:
Table 238. Federal and State Tax Im