Table 8. Total <strong>Mar<strong>in</strong>e</strong> Recreational Fish<strong>in</strong>g <strong>Expenditures</strong> <strong>in</strong> Connecticut by Resident Status <strong>in</strong> 2006 (<strong>in</strong> thousands <strong>of</strong> dollars) CT Resident Status Resident Non-Resident Total Expenditure Lower Bound Upper Bound Total Expenditure Lower Bound Upper Bound Expenditure Type Expenditure Category Fish<strong>in</strong>g Mode $327 $195 $458 $104 $0 $243 Trip <strong>Expenditures</strong> Private Transportation Party/Charter Private/Rental $7,993 $6,159 $9,826 $457 $235 $679 Shore $3,420 $2,377 $4,463 $551 $164 $939 Public Transportation Party/Charter $0 $0 $1 $0 $0 $0 Private/Rental $0 $0 $0 $0 $0 $0 Shore $0 $0 $0 $0 $0 $0 Auto Rental Party/Charter $0 $0 $0 $0 $0 $0 Private/Rental $0 $0 $0 $0 $0 $0 Shore $1 $0 $4 $0 $0 $0 Food from Grocery Stores Party/Charter $137 $77 $197 $25 $0 $59 Private/Rental $1,430 $990 $1,870 $52 $8 $95 Shore $743 $399 $1,086 $0 $0 $0 Food from Restaurants Party/Charter $63 $31 $96 $11 $0 $27 Private/Rental $872 $565 $1,178 $55 $11 $99 Shore $296 $115 $477 $146 $0 $424 Lodg<strong>in</strong>g Party/Charter $0 $0 $0 $0 $0 $0 Private/Rental $0 $0 $0 $0 $0 $0 Shore $0 $0 $0 $292 $0 $849 Boat Fuel Private/Rental $6,564 $4,958 $8,169 $319 $159 $480 Boat & Equipment Rental Party/Charter $0 $0 $0 $0 $0 $0 Private/Rental $236 $0 $561 $0 $0 $0 Shore $0 $0 $0 $0 $0 $0 Charter Fees Party/Charter $1,825 $1,106 $2,545 $532 $0 $1,244 Charter Crew Tips Party/Charter $21 $9 $33 $11 $0 $27 Catch Process<strong>in</strong>g Party/Charter $0 $0 $1 $0 $0 $1 Private/Rental $0 $0 $0 $0 $0 $0 Shore $0 $0 $0 $0 $0 $0 Access & Park<strong>in</strong>g Party/Charter $0 $0 $0 $0 $0 $0 Private/Rental $0 $0 $0 $0 $0 $0 Shore $13 $0 $40 $0 $0 $0 Bait Party/Charter $0 $0 $0 $0 $0 $0 Private/Rental $3,419 $2,605 $4,234 $124 $52 $196 Shore $2,156 $1,424 $2,889 $90 $8 $171 Ice Party/Charter $0 $0 $1 $0 $0 $0 Private/Rental $40 $9 $70 $1 $0 $2 Shore $26 $0 $62 $0 $0 $0 Tackle Used on Trip Party/Charter $115 $55 $175 $32 $0 $77 Private/Rental $2,126 $1,290 $2,962 $76 $0 $154 Shore $1,084 $445 $1,723 $0 $0 $0 Tournament Fees Party/Charter $14 $7 $21 $3 $0 $6 Private/Rental $0 $0 $0 $0 $0 $0 Shore $0 $0 $0 $0 $0 $0 Gifts and Souvenirs Party/Charter $0 $0 $1 $0 $0 $0 Private/Rental $0 $0 $0 $0 $0 $0 Shore $0 $0 $0 $0 $0 $0 Trip Total Party/Charter $2,503 $1,478 $3,529 $718 $0 $1,683 Private/Rental $22,679 $16,577 $28,871 $1,083 $466 $1,704 Shore $7,739 $4,761 $10,743 $1,079 $172 $2,383 Mode Sub-Total All $32,922 $22,816 $43,143 $2,881 $638 $5,771 Equipment <strong>Expenditures</strong> Tackle $48,389 $32,057 $64,721 $3,149 $1,404 $4,895 Rods & Reels $59,238 $24,227 $94,249 $2,816 $1,146 $4,486 O<strong>the</strong>r Gear $22,590 $13,237 $31,944 $1,387 $0 $3,515 Camp<strong>in</strong>g Equipment $365 $0 $832 $0 $0 $0 B<strong>in</strong>noculars $652 $0 $1,432 $0 $0 $0 Cloth<strong>in</strong>g $11,202 $3,590 $18,813 $853 $169 $1,537 Taxidermy $1,183 $0 $3,162 $0 $0 $0 Magaz<strong>in</strong>e Subscriptions $5,386 $2,433 $8,339 $1,241 $660 $1,822 Club Dues $628 $22 $1,235 $0 $0 $0 License Fees $2,180 $0 $4,454 $429 $0 $1,022 New Boat Purchase $50,521 $0 $131,093 $0 $0 $0 Used Boat Purchase $0 $0 $0 $0 $0 $0 New Canoe Purchase $0 $0 $0 $0 $0 $0 Used Canoe Purchase $0 $0 $0 $0 $0 $0 New Accessory Purchase $45,625 $14,579 $76,672 $80 $0 $269 Used Accessory Purchase $0 $0 $0 $0 $0 $0 Boat Insurance $22,991 $5,450 $40,532 $0 $0 $0 Boat Ma<strong>in</strong>tenance $24,721 $4,238 $45,204 $243 $0 $794 Boat Registration $8,920 $2,593 $15,247 $1,042 $0 $2,448 Boat Storage $20,392 $0 $43,999 $686 $0 $2,234 Boat Purchase Fees $2,959 $0 $6,840 $0 $0 $0 New Vehicle Purchase $146,670 $0 $343,418 $0 $0 $0 Used Vehicle Purchase $92,010 $0 $240,260 $0 $0 $0 Vehicle Insurance $15,185 $2,330 $28,040 $0 $0 $0 Vehicle Ma<strong>in</strong>tenance $14,455 $0 $36,304 $0 $0 $0 Vehicle Purchase Fees $20,950 $0 $50,464 $0 $0 $0 New Home Purchase $0 $0 $0 $0 $0 $0 Second Home Insurance $0 $0 $0 $0 $0 $0 Second Home Ma<strong>in</strong>tenance $0 $0 $0 $0 $0 $0 Second Home Property Tax $0 $0 $0 $0 $0 $0 Second Home Purchase Fee $0 $0 $0 $0 $0 $0 Real Estate Commissions $0 $0 $0 $0 $0 $0 Total Annual $617,213 $328,857 $905,570 $11,928 $6,550 $17,305 State Total <strong>Expenditures</strong> $664,943 $358,860 $971,788 67
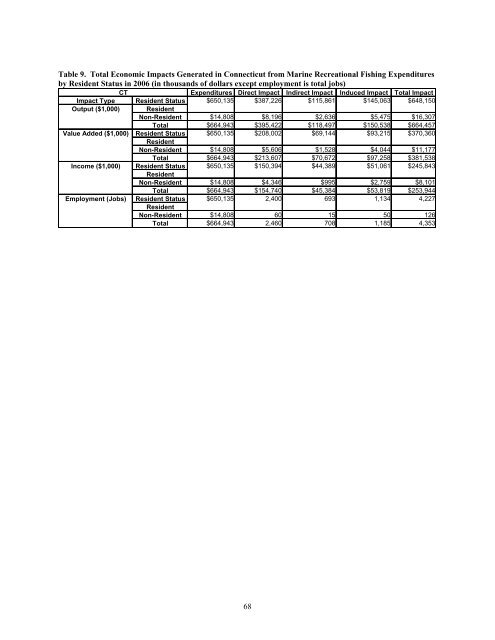
Table 9. Total <strong>Economic</strong> Impacts Generated <strong>in</strong> Connecticut from <strong>Mar<strong>in</strong>e</strong> Recreational Fish<strong>in</strong>g <strong>Expenditures</strong> by Resident Status <strong>in</strong> 2006 (<strong>in</strong> thousands <strong>of</strong> dollars except employment is total jobs) CT <strong>Expenditures</strong> Direct Impact Indirect Impact Induced Impact Total Impact Impact Type Resident Status $650,135 $387,226 $115,861 $145,063 $648,150 Output ($1,000) Resident Non-Resident $14,808 $8,196 $2,636 $5,475 $16,307 Total $664,943 $395,422 $118,497 $150,538 $664,457 Value Added ($1,000) Resident Status Resident Non-Resident $650,135 $14,808 $208,002 $5,606 $69,144 $1,528 $93,215 $4,044 $370,360 $11,177 Total $664,943 $213,607 $70,672 $97,258 $381,538 Income ($1,000) Resident Status $650,135 $150,394 $44,389 $51,061 $245,843 Resident Non-Resident $14,808 $4,346 $995 $2,759 $8,101 Total $664,943 $154,740 $45,384 $53,819 $253,944 Employment (Jobs) Resident Status Resident Non-Resident $650,135 $14,808 2,400 60 693 15 1,134 50 4,227 126 Total $664,943 2,460 708 1,185 4,353 68
- Page 1:
The Economic Contribution of Marine
- Page 4 and 5:
Suggested citation: Gentner, Brad,
- Page 6 and 7:
LIST OF TABLES Table 1. Intercept a
- Page 8 and 9:
Table 39. Total Income Generated in
- Page 10 and 11:
Table 75. Total Income Generated in
- Page 12 and 13:
Table 111. Total Income Generated i
- Page 14 and 15:
Table 147. Total Employment Generat
- Page 16 and 17:
Table 183. Total Employment Generat
- Page 18 and 19:
Table 219. Total Employment Generat
- Page 20 and 21:
ABSTRACT Marine recreational fishin
- Page 22 and 23:
anked by an index of relative fishi
- Page 24 and 25:
Mail survey questions in Hawaii wer
- Page 26 and 27:
(i.e., fishing tackle or gear), all
- Page 28 and 29:
at the stratum level so it was nece
- Page 30 and 31:
For the remainder of this report, U
- Page 32 and 33:
RESULTS Anglers’ expenditures and
- Page 34 and 35:
level of import requirements for an
- Page 36 and 37: followed by Texas, North Carolina,
- Page 38 and 39: Across all of the Pacific and North
- Page 40 and 41: The $755.9 million spent on retail
- Page 42 and 43: ethnicity (under both the Rao-Scott
- Page 44 and 45: storage, and registration with a to
- Page 46 and 47: Keynesian multipliers can also be u
- Page 48 and 49: REFERENCES Archer, H.B. 1984. Econo
- Page 50: APPENDIX I MRIP ECONOMIC INTERCEPT
- Page 65: APPENDIX III LICENSE FRAME MAIL SUR
- Page 79 and 80: Table 2. Angler Effort in Thousands
- Page 81 and 82: Table 4. Recreational Expenditure S
- Page 83 and 84: Table 6. Results of Survey Mode Tes
- Page 85: Table 7. Mean Expenditures by Mode
- Page 89 and 90: Table 11. Total Value-Added Generat
- Page 91 and 92: Table 13. Total Employment Generate
- Page 93 and 94: Table 15. Federal and State Tax Imp
- Page 95 and 96: Table 17. Total Marine Recreational
- Page 97 and 98: Table 19. Total Sales/Output Genera
- Page 99 and 100: Table 21. Total Income Generated in
- Page 101 and 102: Table 23. Total Economic Impacts Ge
- Page 103 and 104: Table 25. Mean Expenditures by Mode
- Page 105 and 106: Table 27. Total Economic Impacts Ge
- Page 107 and 108: Table 29. Total Value-Added Generat
- Page 109 and 110: Table 31. Total Employment Generate
- Page 111 and 112: Table 33. Federal and State Tax Imp
- Page 113 and 114: Table 35. Total Marine Recreational
- Page 115 and 116: Table 37. Total Sales/Output Genera
- Page 117 and 118: Table 39. Total Income Generated in
- Page 119 and 120: Table 41. Total Economic Impacts Ge
- Page 121 and 122: Table 43. Mean Expenditures by Mode
- Page 123 and 124: Table 45. Total Economic Impacts Ge
- Page 125 and 126: Table 47. Total Value-Added Generat
- Page 127 and 128: Table 49. Total Employment Generate
- Page 129 and 130: Table 51. Federal and State Tax Imp
- Page 131 and 132: Table 53. Total Marine Recreational
- Page 133 and 134: Table 55. Total Sales/Output Genera
- Page 135 and 136: Table 57. Total Income Generated in
- Page 137 and 138:
Table 59. Total Economic Impacts Ge
- Page 139 and 140:
Table 61. Mean Expenditures by Mode
- Page 141 and 142:
Table 63. Total Economic Impacts Ge
- Page 143 and 144:
Table 65. Total Value-Added Generat
- Page 145 and 146:
Table 67. Total Employment Generate
- Page 147 and 148:
Table 69. Federal and State Tax Imp
- Page 149 and 150:
Table 71. Total Marine Recreational
- Page 151 and 152:
Table 73. Total Sales/Output Genera
- Page 153 and 154:
Table 75. Total Income Generated in
- Page 155 and 156:
Table 77. Total Economic Impacts Ge
- Page 157 and 158:
Table 79. Mean Expenditures by Mode
- Page 159 and 160:
Table 81. Total Economic Impacts Ge
- Page 161 and 162:
Table 83. Total Value-Added Generat
- Page 163 and 164:
Table 85. Total Employment Generate
- Page 165 and 166:
Table 87. Federal and State Tax Imp
- Page 167 and 168:
Table 89. Total Marine Recreational
- Page 169 and 170:
Table 91. Total Sales/Output Genera
- Page 171 and 172:
Table 93. Total Income Generated in
- Page 173 and 174:
Table 95. Total Economic Impacts Ge
- Page 175 and 176:
SOUTHEAST REGION TABLES Alabama Eas
- Page 177 and 178:
Table 98. Total Marine Recreational
- Page 179 and 180:
Table 100. Total Sales/Output Gener
- Page 181 and 182:
Table 102. Total Income Generated i
- Page 183 and 184:
Table 104. Total Economic Impacts G
- Page 185 and 186:
Table 106. Mean Expenditures by Mod
- Page 187 and 188:
Table 108. Total Economic Impacts G
- Page 189 and 190:
Table 110. Total Value-Added Genera
- Page 191 and 192:
Table 112. Total Employment Generat
- Page 193 and 194:
Table 114. Federal and State Tax Im
- Page 195 and 196:
Table 116. Total Marine Recreationa
- Page 197 and 198:
Table 118. Total Sales/Output Gener
- Page 199 and 200:
Table 120. Total Income Generated i
- Page 201 and 202:
Table 122. Total Economic Impacts G
- Page 203 and 204:
Table 124. Total Marine Recreationa
- Page 205 and 206:
Table 126. Total Sales/Output Gener
- Page 207 and 208:
Table 128. Total Income Generated i
- Page 209 and 210:
Table 130. Total Economic Impacts G
- Page 211 and 212:
Table 132. Mean Expenditures by Mod
- Page 213 and 214:
Table 1034. Total Economic Impacts
- Page 215 and 216:
Table 136. Total Value-Added Genera
- Page 217 and 218:
Table 138. Total Employment Generat
- Page 219 and 220:
Table 140. Federal and State Tax Im
- Page 221 and 222:
Table 142. Total Marine Recreationa
- Page 223 and 224:
Table 144. Total Sales/Output Gener
- Page 225 and 226:
Table 146. Total Income Generated i
- Page 227 and 228:
Table 148. Total Economic Impacts G
- Page 229 and 230:
Table 150. Mean Expenditures by Mod
- Page 231 and 232:
Table 152. Total Economic Impacts G
- Page 233 and 234:
Table 154. Total Value-Added Genera
- Page 235 and 236:
Table 156. Total Employment Generat
- Page 237 and 238:
Table 158. Federal and State Tax Im
- Page 239 and 240:
Table 160. Total Marine Recreationa
- Page 241 and 242:
Table 162. Total Sales/Output Gener
- Page 243 and 244:
Table 164. Total Income Generated i
- Page 245 and 246:
Table 166. Total Economic Impacts G
- Page 247 and 248:
Table 168. Mean Expenditures by Mod
- Page 249 and 250:
Table 170. Total Economic Impacts G
- Page 251 and 252:
Table 172. Total Value-Added Genera
- Page 253 and 254:
Table 174. Total Employment Generat
- Page 255 and 256:
Table 176. Federal and Sate Tax Imp
- Page 257 and 258:
Table 178. Total Marine Recreationa
- Page 259 and 260:
Table 180. Total Sales/Output Gener
- Page 261 and 262:
Table 182. Total Income Generated i
- Page 263 and 264:
Table 184. Total Economic Impacts G
- Page 265 and 266:
PACIFIC REGION TABLES California Or
- Page 267 and 268:
Table 187. Total Marine Recreationa
- Page 269 and 270:
Table 189. Total Sales/Output Gener
- Page 271 and 272:
Table 191. Total Income Generated i
- Page 273 and 274:
Table 193. Total Economic Impacts G
- Page 275 and 276:
Table 195. Mean Expenditures by Mod
- Page 277 and 278:
Table 197. Total Economic Impacts G
- Page 279 and 280:
Table 199. Total Value-Added Genera
- Page 281 and 282:
Table 201. Total Employment Generat
- Page 283 and 284:
Table 203. Federal and State Tax Im
- Page 285 and 286:
Table 205. Total Marine Recreationa
- Page 287 and 288:
Table 207. Total Sales/Output Gener
- Page 289 and 290:
Table 209. Total Income Generated i
- Page 291 and 292:
Table 211. Total Economic Impacts G
- Page 293 and 294:
NORTH PACIFIC REGION TABLES Alaska
- Page 295 and 296:
Table 214. Total Marine Recreationa
- Page 297 and 298:
Table 216. Total Sales/Output Gener
- Page 299 and 300:
Table 218. Total Income Generated i
- Page 301 and 302:
Table 220. Total Economic Impacts G
- Page 303 and 304:
HAWAII TABLES 284
- Page 305 and 306:
Table 223. Total Marine Recreationa
- Page 307 and 308:
Table 225. Total Sales/Output Gener
- Page 309 and 310:
Table 227. Total Income Generated i
- Page 311 and 312:
Table 229. Total Economic Impacts G
- Page 313 and 314:
UNITED STATES TABLES 294
- Page 315 and 316:
Table 232. Total Economic Impacts G
- Page 317 and 318:
Table 234. Total Value-Added Genera
- Page 319 and 320:
Table 236. Total Employment Generat
- Page 321:
Table 238. Federal and State Tax Im