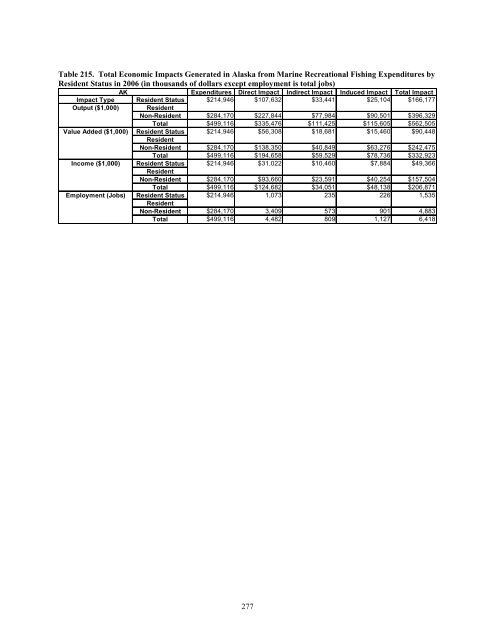
Table 215. Total <strong>Economic</strong> Impacts Generated <strong>in</strong> Alaska from <strong>Mar<strong>in</strong>e</strong> Recreational Fish<strong>in</strong>g <strong>Expenditures</strong> by Resident Status <strong>in</strong> 2006 (<strong>in</strong> thousands <strong>of</strong> dollars except employment is total jobs) AK <strong>Expenditures</strong> Direct Impact Indirect Impact Induced Impact Total Impact Impact Type Resident Status $214,946 $107,632 $33,441 $25,104 $166,177 Output ($1,000) Resident Non-Resident $284,170 $227,844 $77,984 $90,501 $396,329 Total $499,116 $335,476 $111,425 $115,605 $562,505 Value Added ($1,000) Resident Status Resident Non-Resident $214,946 $284,170 $56,308 $138,350 $18,681 $40,849 $15,460 $63,276 $90,448 $242,475 Total $499,116 $194,658 $59,529 $78,736 $332,923 Income ($1,000) Resident Status $214,946 $31,022 $10,460 $7,884 $49,366 Resident Non-Resident $284,170 $93,660 $23,591 $40,254 $157,504 Total $499,116 $124,682 $34,051 $48,138 $206,871 Employment (Jobs) Resident Status Resident Non-Resident $214,946 $284,170 1,073 3,409 235 573 226 901 1,535 4,883 Total $499,116 4,482 809 1,127 6,418 277
Table 216. Total Sales/Output Generated <strong>in</strong> Alaska from <strong>Mar<strong>in</strong>e</strong> Recreational Fish<strong>in</strong>g <strong>in</strong> 2006 (<strong>in</strong> thousands <strong>of</strong> dollars) AK <strong>Expenditures</strong> Direct Impact Indirect Impact Induced Impact Total Impact Impact Type Impact Category $18,519 $17,499 $8,965 $3,816 $30,280 Trip Impacts Private Transportation Public Transportation $50,896 $50,896 $18,982 $15,756 $85,634 Auto Rental $12,141 $12,141 $5,577 $2,607 $20,325 Food from Grocery Stores $16,271 $5,911 $1,623 $1,638 $9,171 Food from Restaurants $12,471 $12,471 $3,191 $3,295 $18,956 Lodg<strong>in</strong>g $34,898 $34,898 $10,748 $8,987 $54,634 Boat Fuel $12,445 $11,759 $6,025 $2,561 $20,345 Boat & Equipment Rental $4,119 $4,119 $1,313 $1,041 $6,473 Charter Fees $65,523 $65,523 $20,874 $16,594 $102,991 Charter Crew Tips $1,295 $1,295 $413 $328 $2,035 Catch Process<strong>in</strong>g $8,948 $8,948 $2,851 $2,267 $14,066 Access & Park<strong>in</strong>g $1,161 $1,161 $412 $285 $1,858 Bait $2,092 $1,165 $498 $373 $2,036 Ice $911 $363 $90 $99 $552 Tackle Used on Trip $5,545 $2,987 $764 $903 $4,653 Tournament Fees $904 $904 $288 $228 $1,420 Gifts and Souvenirs $9,433 $2,756 $493 $1,005 $4,253 Trip Total $257,572 $234,795 $83,106 $61,782 $379,683 Durable Impacts Tackle $10,337 $5,568 $1,921 $819 $8,308 Rods & Reels $16,722 $9,006 $3,107 $1,325 $13,439 O<strong>the</strong>r Gear $5,421 $2,920 $1,007 $430 $4,356 Camp<strong>in</strong>g Equipment $903 $433 $114 $110 $657 B<strong>in</strong>noculars $1,741 $0 $0 $0 $0 Cloth<strong>in</strong>g $4,116 $2,635 $1,106 $358 $4,099 Taxidermy $2,417 $2,417 $1,187 $775 $4,379 Magaz<strong>in</strong>e Subscriptions $1,473 $477 $140 $101 $718 Club Dues $477 $477 $152 $121 $750 License Fees $22,123 $3,133 $0 $30,968 $34,101 New Boat Purchase $41,944 $11,512 $3,202 $3,399 $18,113 Used Boat Purchase $0 $0 $0 $0 $0 New Canoe Purchase $4,600 $1,263 $351 $372 $1,986 Used Canoe Purchase $0 $0 $0 $0 $0 New Accessory Purchase $9,828 $4,061 $915 $1,329 $6,305 Used Accessory Purchase $0 $0 $0 $0 $0 Boat Insurance $8,109 $8,109 $3,146 $2,022 $13,276 Boat Ma<strong>in</strong>tenance $7,983 $2,191 $394 $313 $2,898 Boat Registration $2,949 $2,301 $0 $2,241 $4,542 Boat Storage $4,320 $4,320 $2,231 $917 $7,469 Boat Purchase Fees $143 $143 $34 $43 $221 New Vehicle Purchase $56,661 $441 $84 $62 $587 Used Vehicle Purchase $0 $0 $0 $0 $0 Vehicle Insurance $597 $597 $232 $149 $977 Vehicle Ma<strong>in</strong>tenance $374 $374 $70 $99 $543 Vehicle Purchase Fees $2,031 $2,031 $485 $613 $3,130 New Home Purchase $9,388 $9,388 $2,697 $2,718 $14,803 Second Home Insurance $3,719 $3,719 $1,442 $929 $6,090 Second Home Ma<strong>in</strong>tenance $8,238 $8,238 $2,054 $2,423 $12,715 Second Home Property Tax $4,381 $4,381 $302 $69 $4,752 Second Home Purchase Fee $3,695 $3,695 $255 $58 $4,007 Real Estate Commissions $6,853 $6,853 $1,692 $1,057 $9,602 Total Annual $241,544 $100,681 $28,319 $53,822 $182,823 Total $499,116 $335,476 $111,425 $115,605 $562,505 278
- Page 1:
The Economic Contribution of Marine
- Page 4 and 5:
Suggested citation: Gentner, Brad,
- Page 6 and 7:
LIST OF TABLES Table 1. Intercept a
- Page 8 and 9:
Table 39. Total Income Generated in
- Page 10 and 11:
Table 75. Total Income Generated in
- Page 12 and 13:
Table 111. Total Income Generated i
- Page 14 and 15:
Table 147. Total Employment Generat
- Page 16 and 17:
Table 183. Total Employment Generat
- Page 18 and 19:
Table 219. Total Employment Generat
- Page 20 and 21:
ABSTRACT Marine recreational fishin
- Page 22 and 23:
anked by an index of relative fishi
- Page 24 and 25:
Mail survey questions in Hawaii wer
- Page 26 and 27:
(i.e., fishing tackle or gear), all
- Page 28 and 29:
at the stratum level so it was nece
- Page 30 and 31:
For the remainder of this report, U
- Page 32 and 33:
RESULTS Anglers’ expenditures and
- Page 34 and 35:
level of import requirements for an
- Page 36 and 37:
followed by Texas, North Carolina,
- Page 38 and 39:
Across all of the Pacific and North
- Page 40 and 41:
The $755.9 million spent on retail
- Page 42 and 43:
ethnicity (under both the Rao-Scott
- Page 44 and 45:
storage, and registration with a to
- Page 46 and 47:
Keynesian multipliers can also be u
- Page 48 and 49:
REFERENCES Archer, H.B. 1984. Econo
- Page 50:
APPENDIX I MRIP ECONOMIC INTERCEPT
- Page 65:
APPENDIX III LICENSE FRAME MAIL SUR
- Page 79 and 80:
Table 2. Angler Effort in Thousands
- Page 81 and 82:
Table 4. Recreational Expenditure S
- Page 83 and 84:
Table 6. Results of Survey Mode Tes
- Page 85 and 86:
Table 7. Mean Expenditures by Mode
- Page 87 and 88:
Table 9. Total Economic Impacts Gen
- Page 89 and 90:
Table 11. Total Value-Added Generat
- Page 91 and 92:
Table 13. Total Employment Generate
- Page 93 and 94:
Table 15. Federal and State Tax Imp
- Page 95 and 96:
Table 17. Total Marine Recreational
- Page 97 and 98:
Table 19. Total Sales/Output Genera
- Page 99 and 100:
Table 21. Total Income Generated in
- Page 101 and 102:
Table 23. Total Economic Impacts Ge
- Page 103 and 104:
Table 25. Mean Expenditures by Mode
- Page 105 and 106:
Table 27. Total Economic Impacts Ge
- Page 107 and 108:
Table 29. Total Value-Added Generat
- Page 109 and 110:
Table 31. Total Employment Generate
- Page 111 and 112:
Table 33. Federal and State Tax Imp
- Page 113 and 114:
Table 35. Total Marine Recreational
- Page 115 and 116:
Table 37. Total Sales/Output Genera
- Page 117 and 118:
Table 39. Total Income Generated in
- Page 119 and 120:
Table 41. Total Economic Impacts Ge
- Page 121 and 122:
Table 43. Mean Expenditures by Mode
- Page 123 and 124:
Table 45. Total Economic Impacts Ge
- Page 125 and 126:
Table 47. Total Value-Added Generat
- Page 127 and 128:
Table 49. Total Employment Generate
- Page 129 and 130:
Table 51. Federal and State Tax Imp
- Page 131 and 132:
Table 53. Total Marine Recreational
- Page 133 and 134:
Table 55. Total Sales/Output Genera
- Page 135 and 136:
Table 57. Total Income Generated in
- Page 137 and 138:
Table 59. Total Economic Impacts Ge
- Page 139 and 140:
Table 61. Mean Expenditures by Mode
- Page 141 and 142:
Table 63. Total Economic Impacts Ge
- Page 143 and 144:
Table 65. Total Value-Added Generat
- Page 145 and 146:
Table 67. Total Employment Generate
- Page 147 and 148:
Table 69. Federal and State Tax Imp
- Page 149 and 150:
Table 71. Total Marine Recreational
- Page 151 and 152:
Table 73. Total Sales/Output Genera
- Page 153 and 154:
Table 75. Total Income Generated in
- Page 155 and 156:
Table 77. Total Economic Impacts Ge
- Page 157 and 158:
Table 79. Mean Expenditures by Mode
- Page 159 and 160:
Table 81. Total Economic Impacts Ge
- Page 161 and 162:
Table 83. Total Value-Added Generat
- Page 163 and 164:
Table 85. Total Employment Generate
- Page 165 and 166:
Table 87. Federal and State Tax Imp
- Page 167 and 168:
Table 89. Total Marine Recreational
- Page 169 and 170:
Table 91. Total Sales/Output Genera
- Page 171 and 172:
Table 93. Total Income Generated in
- Page 173 and 174:
Table 95. Total Economic Impacts Ge
- Page 175 and 176:
SOUTHEAST REGION TABLES Alabama Eas
- Page 177 and 178:
Table 98. Total Marine Recreational
- Page 179 and 180:
Table 100. Total Sales/Output Gener
- Page 181 and 182:
Table 102. Total Income Generated i
- Page 183 and 184:
Table 104. Total Economic Impacts G
- Page 185 and 186:
Table 106. Mean Expenditures by Mod
- Page 187 and 188:
Table 108. Total Economic Impacts G
- Page 189 and 190:
Table 110. Total Value-Added Genera
- Page 191 and 192:
Table 112. Total Employment Generat
- Page 193 and 194:
Table 114. Federal and State Tax Im
- Page 195 and 196:
Table 116. Total Marine Recreationa
- Page 197 and 198:
Table 118. Total Sales/Output Gener
- Page 199 and 200:
Table 120. Total Income Generated i
- Page 201 and 202:
Table 122. Total Economic Impacts G
- Page 203 and 204:
Table 124. Total Marine Recreationa
- Page 205 and 206:
Table 126. Total Sales/Output Gener
- Page 207 and 208:
Table 128. Total Income Generated i
- Page 209 and 210:
Table 130. Total Economic Impacts G
- Page 211 and 212:
Table 132. Mean Expenditures by Mod
- Page 213 and 214:
Table 1034. Total Economic Impacts
- Page 215 and 216:
Table 136. Total Value-Added Genera
- Page 217 and 218:
Table 138. Total Employment Generat
- Page 219 and 220:
Table 140. Federal and State Tax Im
- Page 221 and 222:
Table 142. Total Marine Recreationa
- Page 223 and 224:
Table 144. Total Sales/Output Gener
- Page 225 and 226:
Table 146. Total Income Generated i
- Page 227 and 228:
Table 148. Total Economic Impacts G
- Page 229 and 230:
Table 150. Mean Expenditures by Mod
- Page 231 and 232:
Table 152. Total Economic Impacts G
- Page 233 and 234:
Table 154. Total Value-Added Genera
- Page 235 and 236:
Table 156. Total Employment Generat
- Page 237 and 238:
Table 158. Federal and State Tax Im
- Page 239 and 240:
Table 160. Total Marine Recreationa
- Page 241 and 242:
Table 162. Total Sales/Output Gener
- Page 243 and 244:
Table 164. Total Income Generated i
- Page 245 and 246: Table 166. Total Economic Impacts G
- Page 247 and 248: Table 168. Mean Expenditures by Mod
- Page 249 and 250: Table 170. Total Economic Impacts G
- Page 251 and 252: Table 172. Total Value-Added Genera
- Page 253 and 254: Table 174. Total Employment Generat
- Page 255 and 256: Table 176. Federal and Sate Tax Imp
- Page 257 and 258: Table 178. Total Marine Recreationa
- Page 259 and 260: Table 180. Total Sales/Output Gener
- Page 261 and 262: Table 182. Total Income Generated i
- Page 263 and 264: Table 184. Total Economic Impacts G
- Page 265 and 266: PACIFIC REGION TABLES California Or
- Page 267 and 268: Table 187. Total Marine Recreationa
- Page 269 and 270: Table 189. Total Sales/Output Gener
- Page 271 and 272: Table 191. Total Income Generated i
- Page 273 and 274: Table 193. Total Economic Impacts G
- Page 275 and 276: Table 195. Mean Expenditures by Mod
- Page 277 and 278: Table 197. Total Economic Impacts G
- Page 279 and 280: Table 199. Total Value-Added Genera
- Page 281 and 282: Table 201. Total Employment Generat
- Page 283 and 284: Table 203. Federal and State Tax Im
- Page 285 and 286: Table 205. Total Marine Recreationa
- Page 287 and 288: Table 207. Total Sales/Output Gener
- Page 289 and 290: Table 209. Total Income Generated i
- Page 291 and 292: Table 211. Total Economic Impacts G
- Page 293 and 294: NORTH PACIFIC REGION TABLES Alaska
- Page 295: Table 214. Total Marine Recreationa
- Page 299 and 300: Table 218. Total Income Generated i
- Page 301 and 302: Table 220. Total Economic Impacts G
- Page 303 and 304: HAWAII TABLES 284
- Page 305 and 306: Table 223. Total Marine Recreationa
- Page 307 and 308: Table 225. Total Sales/Output Gener
- Page 309 and 310: Table 227. Total Income Generated i
- Page 311 and 312: Table 229. Total Economic Impacts G
- Page 313 and 314: UNITED STATES TABLES 294
- Page 315 and 316: Table 232. Total Economic Impacts G
- Page 317 and 318: Table 234. Total Value-Added Genera
- Page 319 and 320: Table 236. Total Employment Generat
- Page 321: Table 238. Federal and State Tax Im