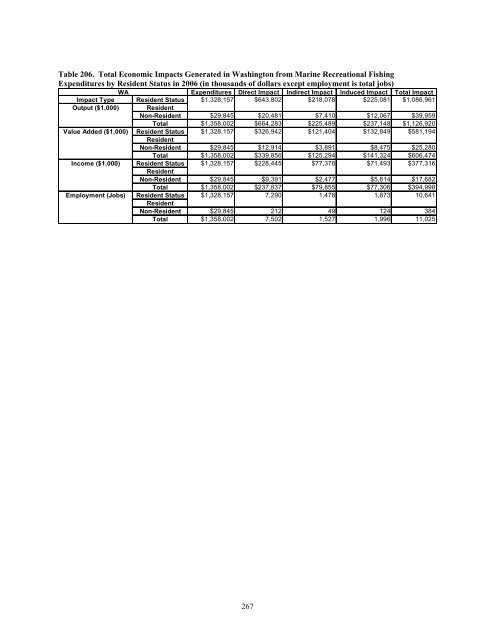
Table 206. Total <strong>Economic</strong> Impacts Generated <strong>in</strong> Wash<strong>in</strong>gton from <strong>Mar<strong>in</strong>e</strong> Recreational Fish<strong>in</strong>g <strong>Expenditures</strong> by Resident Status <strong>in</strong> 2006 (<strong>in</strong> thousands <strong>of</strong> dollars except employment is total jobs) WA <strong>Expenditures</strong> Direct Impact Indirect Impact Induced Impact Total Impact Impact Type Resident Status $1,328,157 $643,802 $218,078 $225,081 $1,086,961 Output ($1,000) Resident Non-Resident $29,845 $20,481 $7,410 $12,067 $39,959 Total $1,358,002 $664,283 $225,489 $237,148 $1,126,920 Value Added ($1,000) Resident Status Resident Non-Resident $1,328,157 $29,845 $326,942 $12,914 $121,404 $3,891 $132,849 $8,475 $581,194 $25,280 Total $1,358,002 $339,856 $125,294 $141,324 $606,474 Income ($1,000) Resident Status $1,328,157 $228,445 $77,378 $71,493 $377,316 Resident Non-Resident $29,845 $9,391 $2,477 $5,814 $17,682 Total $1,358,002 $237,837 $79,855 $77,306 $394,998 Employment (Jobs) Resident Status Resident Non-Resident $1,328,157 $29,845 7,290 212 1,478 49 1,873 124 10,641 384 Total $1,358,002 7,502 1,527 1,996 11,025 267
Table 207. Total Sales/Output Generated <strong>in</strong> Wash<strong>in</strong>gton from <strong>Mar<strong>in</strong>e</strong> Recreational Fish<strong>in</strong>g <strong>in</strong> 2006 (<strong>in</strong> thousands <strong>of</strong> dollars) WA <strong>Expenditures</strong> Direct Impact Indirect Impact Induced Impact Total Impact Impact Type Impact Category $8,815 $8,330 $2,154 $1,883 $12,366 Trip Impacts Private Transportation Public Transportation $1,138 $1,138 $373 $463 $1,974 Auto Rental $524 $524 $269 $140 $934 Food from Grocery Stores $5,317 $2,548 $1,029 $847 $4,425 Food from Restaurants $4,019 $4,019 $1,656 $1,374 $7,049 Lodg<strong>in</strong>g $4,559 $4,559 $1,634 $1,497 $7,690 Boat Fuel $2,064 $1,950 $504 $441 $2,895 Boat & Equipment Rental $729 $729 $237 $237 $1,203 Charter Fees $6,223 $6,223 $2,024 $2,021 $10,268 Charter Crew Tips $353 $353 $115 $115 $582 Catch Process<strong>in</strong>g $92 $92 $30 $30 $151 Access & Park<strong>in</strong>g $191 $191 $69 $60 $320 Bait $1,015 $794 $257 $463 $1,514 Ice $382 $170 $55 $58 $283 Tackle Used on Trip $7,450 $4,220 $1,271 $1,610 $7,101 Tournament Fees $183 $183 $60 $59 $302 Gifts and Souvenirs $1,130 $433 $88 $197 $718 Trip Total $44,183 $36,456 $11,826 $11,493 $59,774 Durable Impacts Tackle $32,114 $18,191 $7,359 $5,429 $30,979 Rods & Reels $43,576 $24,684 $9,986 $7,366 $42,035 O<strong>the</strong>r Gear $22,688 $12,852 $5,199 $3,835 $21,886 Camp<strong>in</strong>g Equipment $5,399 $2,608 $846 $755 $4,208 B<strong>in</strong>noculars $3,784 $2,839 $1,008 $845 $4,693 Cloth<strong>in</strong>g $20,156 $10,872 $4,285 $2,931 $18,088 Taxidermy $856 $856 $439 $253 $1,548 Magaz<strong>in</strong>e Subscriptions $7,190 $2,769 $929 $810 $4,508 Club Dues $3,866 $3,866 $1,258 $1,255 $6,379 License Fees $27,635 $24,802 $0 $21,337 $46,139 New Boat Purchase $705,602 $212,775 $65,585 $77,270 $355,630 Used Boat Purchase $4,127 $4,127 $1,129 $1,701 $6,957 New Canoe Purchase $6,332 $1,909 $589 $693 $3,191 Used Canoe Purchase $52 $52 $14 $21 $87 New Accessory Purchase $121,255 $73,832 $25,811 $26,720 $126,363 Used Accessory Purchase $152 $152 $42 $63 $256 Boat Insurance $42,596 $42,596 $18,873 $14,141 $75,610 Boat Ma<strong>in</strong>tenance $67,213 $20,268 $5,244 $4,552 $30,065 Boat Registration $17,434 $16,964 $0 $12,142 $29,106 Boat Storage $77,554 $77,554 $41,220 $21,769 $140,544 Boat Purchase Fees $9,771 $9,771 $2,699 $3,939 $16,409 New Vehicle Purchase $41,760 $10,781 $2,551 $1,382 $14,714 Used Vehicle Purchase $7,198 $7,198 $1,969 $2,967 $12,133 Vehicle Insurance $14,135 $14,135 $6,263 $4,693 $25,091 Vehicle Ma<strong>in</strong>tenance $758 $758 $178 $262 $1,198 Vehicle Purchase Fees $1,389 $1,389 $384 $560 $2,334 New Home Purchase $0 $0 $0 $0 $0 Second Home Insurance $3,747 $3,747 $1,660 $1,245 $6,651 Second Home Ma<strong>in</strong>tenance $12,881 $12,881 $5,343 $4,768 $22,992 Second Home Property Tax $2,016 $2,016 $190 $51 $2,257 Second Home Purchase Fee $721 $721 $68 $18 $807 Real Estate Commissions $9,864 $9,864 $2,544 $1,880 $14,288 Total Annual $1,313,819 $627,827 $213,662 $225,656 $1,067,145 Total $1,358,002 $664,283 $225,489 $237,148 $1,126,920 268
- Page 1:
The Economic Contribution of Marine
- Page 4 and 5:
Suggested citation: Gentner, Brad,
- Page 6 and 7:
LIST OF TABLES Table 1. Intercept a
- Page 8 and 9:
Table 39. Total Income Generated in
- Page 10 and 11:
Table 75. Total Income Generated in
- Page 12 and 13:
Table 111. Total Income Generated i
- Page 14 and 15:
Table 147. Total Employment Generat
- Page 16 and 17:
Table 183. Total Employment Generat
- Page 18 and 19:
Table 219. Total Employment Generat
- Page 20 and 21:
ABSTRACT Marine recreational fishin
- Page 22 and 23:
anked by an index of relative fishi
- Page 24 and 25:
Mail survey questions in Hawaii wer
- Page 26 and 27:
(i.e., fishing tackle or gear), all
- Page 28 and 29:
at the stratum level so it was nece
- Page 30 and 31:
For the remainder of this report, U
- Page 32 and 33:
RESULTS Anglers’ expenditures and
- Page 34 and 35:
level of import requirements for an
- Page 36 and 37:
followed by Texas, North Carolina,
- Page 38 and 39:
Across all of the Pacific and North
- Page 40 and 41:
The $755.9 million spent on retail
- Page 42 and 43:
ethnicity (under both the Rao-Scott
- Page 44 and 45:
storage, and registration with a to
- Page 46 and 47:
Keynesian multipliers can also be u
- Page 48 and 49:
REFERENCES Archer, H.B. 1984. Econo
- Page 50:
APPENDIX I MRIP ECONOMIC INTERCEPT
- Page 65:
APPENDIX III LICENSE FRAME MAIL SUR
- Page 79 and 80:
Table 2. Angler Effort in Thousands
- Page 81 and 82:
Table 4. Recreational Expenditure S
- Page 83 and 84:
Table 6. Results of Survey Mode Tes
- Page 85 and 86:
Table 7. Mean Expenditures by Mode
- Page 87 and 88:
Table 9. Total Economic Impacts Gen
- Page 89 and 90:
Table 11. Total Value-Added Generat
- Page 91 and 92:
Table 13. Total Employment Generate
- Page 93 and 94:
Table 15. Federal and State Tax Imp
- Page 95 and 96:
Table 17. Total Marine Recreational
- Page 97 and 98:
Table 19. Total Sales/Output Genera
- Page 99 and 100:
Table 21. Total Income Generated in
- Page 101 and 102:
Table 23. Total Economic Impacts Ge
- Page 103 and 104:
Table 25. Mean Expenditures by Mode
- Page 105 and 106:
Table 27. Total Economic Impacts Ge
- Page 107 and 108:
Table 29. Total Value-Added Generat
- Page 109 and 110:
Table 31. Total Employment Generate
- Page 111 and 112:
Table 33. Federal and State Tax Imp
- Page 113 and 114:
Table 35. Total Marine Recreational
- Page 115 and 116:
Table 37. Total Sales/Output Genera
- Page 117 and 118:
Table 39. Total Income Generated in
- Page 119 and 120:
Table 41. Total Economic Impacts Ge
- Page 121 and 122:
Table 43. Mean Expenditures by Mode
- Page 123 and 124:
Table 45. Total Economic Impacts Ge
- Page 125 and 126:
Table 47. Total Value-Added Generat
- Page 127 and 128:
Table 49. Total Employment Generate
- Page 129 and 130:
Table 51. Federal and State Tax Imp
- Page 131 and 132:
Table 53. Total Marine Recreational
- Page 133 and 134:
Table 55. Total Sales/Output Genera
- Page 135 and 136:
Table 57. Total Income Generated in
- Page 137 and 138:
Table 59. Total Economic Impacts Ge
- Page 139 and 140:
Table 61. Mean Expenditures by Mode
- Page 141 and 142:
Table 63. Total Economic Impacts Ge
- Page 143 and 144:
Table 65. Total Value-Added Generat
- Page 145 and 146:
Table 67. Total Employment Generate
- Page 147 and 148:
Table 69. Federal and State Tax Imp
- Page 149 and 150:
Table 71. Total Marine Recreational
- Page 151 and 152:
Table 73. Total Sales/Output Genera
- Page 153 and 154:
Table 75. Total Income Generated in
- Page 155 and 156:
Table 77. Total Economic Impacts Ge
- Page 157 and 158:
Table 79. Mean Expenditures by Mode
- Page 159 and 160:
Table 81. Total Economic Impacts Ge
- Page 161 and 162:
Table 83. Total Value-Added Generat
- Page 163 and 164:
Table 85. Total Employment Generate
- Page 165 and 166:
Table 87. Federal and State Tax Imp
- Page 167 and 168:
Table 89. Total Marine Recreational
- Page 169 and 170:
Table 91. Total Sales/Output Genera
- Page 171 and 172:
Table 93. Total Income Generated in
- Page 173 and 174:
Table 95. Total Economic Impacts Ge
- Page 175 and 176:
SOUTHEAST REGION TABLES Alabama Eas
- Page 177 and 178:
Table 98. Total Marine Recreational
- Page 179 and 180:
Table 100. Total Sales/Output Gener
- Page 181 and 182:
Table 102. Total Income Generated i
- Page 183 and 184:
Table 104. Total Economic Impacts G
- Page 185 and 186:
Table 106. Mean Expenditures by Mod
- Page 187 and 188:
Table 108. Total Economic Impacts G
- Page 189 and 190:
Table 110. Total Value-Added Genera
- Page 191 and 192:
Table 112. Total Employment Generat
- Page 193 and 194:
Table 114. Federal and State Tax Im
- Page 195 and 196:
Table 116. Total Marine Recreationa
- Page 197 and 198:
Table 118. Total Sales/Output Gener
- Page 199 and 200:
Table 120. Total Income Generated i
- Page 201 and 202:
Table 122. Total Economic Impacts G
- Page 203 and 204:
Table 124. Total Marine Recreationa
- Page 205 and 206:
Table 126. Total Sales/Output Gener
- Page 207 and 208:
Table 128. Total Income Generated i
- Page 209 and 210:
Table 130. Total Economic Impacts G
- Page 211 and 212:
Table 132. Mean Expenditures by Mod
- Page 213 and 214:
Table 1034. Total Economic Impacts
- Page 215 and 216:
Table 136. Total Value-Added Genera
- Page 217 and 218:
Table 138. Total Employment Generat
- Page 219 and 220:
Table 140. Federal and State Tax Im
- Page 221 and 222:
Table 142. Total Marine Recreationa
- Page 223 and 224:
Table 144. Total Sales/Output Gener
- Page 225 and 226:
Table 146. Total Income Generated i
- Page 227 and 228:
Table 148. Total Economic Impacts G
- Page 229 and 230:
Table 150. Mean Expenditures by Mod
- Page 231 and 232:
Table 152. Total Economic Impacts G
- Page 233 and 234:
Table 154. Total Value-Added Genera
- Page 235 and 236: Table 156. Total Employment Generat
- Page 237 and 238: Table 158. Federal and State Tax Im
- Page 239 and 240: Table 160. Total Marine Recreationa
- Page 241 and 242: Table 162. Total Sales/Output Gener
- Page 243 and 244: Table 164. Total Income Generated i
- Page 245 and 246: Table 166. Total Economic Impacts G
- Page 247 and 248: Table 168. Mean Expenditures by Mod
- Page 249 and 250: Table 170. Total Economic Impacts G
- Page 251 and 252: Table 172. Total Value-Added Genera
- Page 253 and 254: Table 174. Total Employment Generat
- Page 255 and 256: Table 176. Federal and Sate Tax Imp
- Page 257 and 258: Table 178. Total Marine Recreationa
- Page 259 and 260: Table 180. Total Sales/Output Gener
- Page 261 and 262: Table 182. Total Income Generated i
- Page 263 and 264: Table 184. Total Economic Impacts G
- Page 265 and 266: PACIFIC REGION TABLES California Or
- Page 267 and 268: Table 187. Total Marine Recreationa
- Page 269 and 270: Table 189. Total Sales/Output Gener
- Page 271 and 272: Table 191. Total Income Generated i
- Page 273 and 274: Table 193. Total Economic Impacts G
- Page 275 and 276: Table 195. Mean Expenditures by Mod
- Page 277 and 278: Table 197. Total Economic Impacts G
- Page 279 and 280: Table 199. Total Value-Added Genera
- Page 281 and 282: Table 201. Total Employment Generat
- Page 283 and 284: Table 203. Federal and State Tax Im
- Page 285: Table 205. Total Marine Recreationa
- Page 289 and 290: Table 209. Total Income Generated i
- Page 291 and 292: Table 211. Total Economic Impacts G
- Page 293 and 294: NORTH PACIFIC REGION TABLES Alaska
- Page 295 and 296: Table 214. Total Marine Recreationa
- Page 297 and 298: Table 216. Total Sales/Output Gener
- Page 299 and 300: Table 218. Total Income Generated i
- Page 301 and 302: Table 220. Total Economic Impacts G
- Page 303 and 304: HAWAII TABLES 284
- Page 305 and 306: Table 223. Total Marine Recreationa
- Page 307 and 308: Table 225. Total Sales/Output Gener
- Page 309 and 310: Table 227. Total Income Generated i
- Page 311 and 312: Table 229. Total Economic Impacts G
- Page 313 and 314: UNITED STATES TABLES 294
- Page 315 and 316: Table 232. Total Economic Impacts G
- Page 317 and 318: Table 234. Total Value-Added Genera
- Page 319 and 320: Table 236. Total Employment Generat
- Page 321: Table 238. Federal and State Tax Im