- Page 1 and 2:
Faculty of Science and Bio-Engineer
- Page 3:
DON’T PANIC
- Page 7:
S A M E N VAT T I N G Over de laats
- Page 11 and 12:
C O N T E N T S 1. Introduction 1 1
- Page 13 and 14:
Contents 4.4. RoarVM . . . . . . .
- Page 15:
Contents 9.5. Future Work . . . . .
- Page 19:
L I S T O F TA B L E S 2.1. Flynn
- Page 22 and 23:
List of Listings 7.2. Applying tran
- Page 24 and 25:
1. Introduction of solutions for di
- Page 26 and 27:
1. Introduction traded in for bette
- Page 28 and 29:
1. Introduction ad hoc implementati
- Page 30 and 31:
1. Introduction Chapter 7: Implemen
- Page 32 and 33:
1. Introduction and systems [De Kos
- Page 34 and 35:
1. Introduction ReBench This disser
- Page 36 and 37:
2. Context and Motivation 2.1. Mult
- Page 38 and 39:
2. Context and Motivation in litera
- Page 40 and 41:
2. Context and Motivation e. g., ar
- Page 42 and 43:
2. Context and Motivation tasks wit
- Page 44 and 45:
2. Context and Motivation section.
- Page 46 and 47:
2. Context and Motivation Table 2.1
- Page 48 and 49:
2. Context and Motivation The remai
- Page 50 and 51:
2. Context and Motivation Clojure A
- Page 52 and 53:
2. Context and Motivation To achiev
- Page 54 and 55:
2. Context and Motivation Each vat
- Page 56 and 57:
2. Context and Motivation driven to
- Page 58 and 59:
2. Context and Motivation 2.5. Buil
- Page 60 and 61:
2. Context and Motivation First, it
- Page 62 and 63:
3. Which Concepts for Concurrent an
- Page 64 and 65:
3. Which Concepts for Concurrent an
- Page 66 and 67:
3. Which Concepts for Concurrent an
- Page 68 and 69:
3. Which Concepts for Concurrent an
- Page 70 and 71:
3. Which Concepts for Concurrent an
- Page 72 and 73:
3. Which Concepts for Concurrent an
- Page 74 and 75:
3. Which Concepts for Concurrent an
- Page 76 and 77:
3. Which Concepts for Concurrent an
- Page 78 and 79:
3. Which Concepts for Concurrent an
- Page 80 and 81:
3. Which Concepts for Concurrent an
- Page 82 and 83:
3. Which Concepts for Concurrent an
- Page 84 and 85:
3. Which Concepts for Concurrent an
- Page 86 and 87:
3. Which Concepts for Concurrent an
- Page 88 and 89:
3. Which Concepts for Concurrent an
- Page 90 and 91:
3. Which Concepts for Concurrent an
- Page 92 and 93:
3. Which Concepts for Concurrent an
- Page 94 and 95:
3. Which Concepts for Concurrent an
- Page 96 and 97:
3. Which Concepts for Concurrent an
- Page 98 and 99:
3. Which Concepts for Concurrent an
- Page 100 and 101:
3. Which Concepts for Concurrent an
- Page 102 and 103:
3. Which Concepts for Concurrent an
- Page 104 and 105:
3. Which Concepts for Concurrent an
- Page 106 and 107:
3. Which Concepts for Concurrent an
- Page 108 and 109:
3. Which Concepts for Concurrent an
- Page 111 and 112:
4 E X P E R I M E N TAT I O N P L A
- Page 113 and 114:
4.2. SOM: Simple Object Machine SOM
- Page 115 and 116:
4.2. SOM: Simple Object Machine 1 S
- Page 117 and 118:
4.2. SOM: Simple Object Machine nee
- Page 119 and 120:
4.2. SOM: Simple Object Machine 1 S
- Page 121 and 122:
4.2. SOM: Simple Object Machine HAL
- Page 123 and 124:
4.4. RoarVM Used Software and Libra
- Page 125 and 126:
4.4. RoarVM that is performance cri
- Page 127 and 128:
4.4. RoarVM Table 4.2.: The Smallta
- Page 129 and 130:
4.4. RoarVM is a problematic operat
- Page 131 and 132:
5 A N O W N E R S H I P - B A S E D
- Page 133 and 134:
5.1. Open Implementations and Metao
- Page 135 and 136:
5.2. Design of the OMOP metaclass-b
- Page 137 and 138:
5.2. Design of the OMOP Meta Level
- Page 139 and 140:
5.2. Design of the OMOP set of mech
- Page 141 and 142:
5.3. The OMOP By Example current :
- Page 143 and 144:
5.3. The OMOP By Example dling writ
- Page 145 and 146:
5.3. The OMOP By Example The proces
- Page 147 and 148:
5.4. Semantics of the MOP 1 SOMObje
- Page 149 and 150:
5.4. Semantics of the MOP 1 SOMInte
- Page 151 and 152:
5.5. Customizations and VM-specific
- Page 153 and 154:
5.6. Related Work how to use it to
- Page 155 and 156:
5.6. Related Work In ABCL/R2, meta-
- Page 157:
5.7. Summary which owns a set of ob
- Page 160 and 161:
6. Evaluation: The OMOP as a Unifyi
- Page 162 and 163:
6. Evaluation: The OMOP as a Unifyi
- Page 164 and 165:
6. Evaluation: The OMOP as a Unifyi
- Page 166 and 167:
6. Evaluation: The OMOP as a Unifyi
- Page 168 and 169:
6. Evaluation: The OMOP as a Unifyi
- Page 170 and 171:
6. Evaluation: The OMOP as a Unifyi
- Page 172 and 173:
6. Evaluation: The OMOP as a Unifyi
- Page 174 and 175:
6. Evaluation: The OMOP as a Unifyi
- Page 176 and 177:
6. Evaluation: The OMOP as a Unifyi
- Page 178 and 179:
6. Evaluation: The OMOP as a Unifyi
- Page 180 and 181:
6. Evaluation: The OMOP as a Unifyi
- Page 182 and 183:
6. Evaluation: The OMOP as a Unifyi
- Page 184 and 185: 6. Evaluation: The OMOP as a Unifyi
- Page 186 and 187: 6. Evaluation: The OMOP as a Unifyi
- Page 188 and 189: 6. Evaluation: The OMOP as a Unifyi
- Page 190 and 191: 6. Evaluation: The OMOP as a Unifyi
- Page 192 and 193: 6. Evaluation: The OMOP as a Unifyi
- Page 194 and 195: 6. Evaluation: The OMOP as a Unifyi
- Page 196 and 197: 6. Evaluation: The OMOP as a Unifyi
- Page 198 and 199: 6. Evaluation: The OMOP as a Unifyi
- Page 200 and 201: 6. Evaluation: The OMOP as a Unifyi
- Page 203 and 204: 7 I M P L E M E N TAT I O N A P P R
- Page 205 and 206: 7.1. AST Transformation VMs makes s
- Page 207 and 208: 7.1. AST Transformation all have th
- Page 209 and 210: 7.1. AST Transformation because thi
- Page 211 and 212: 7.2. Virtual Machine Support ments
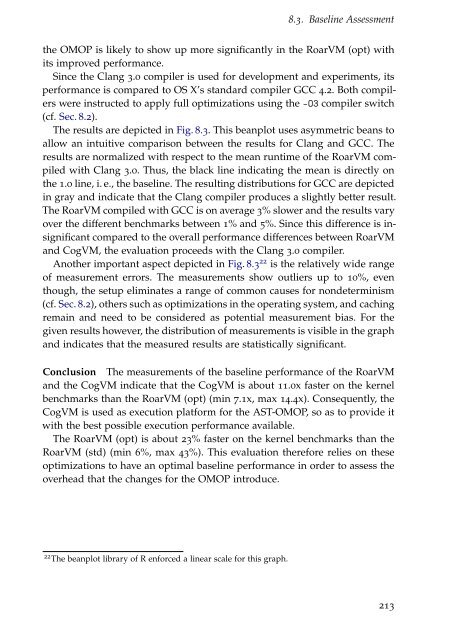
- Page 213 and 214: 7.2. Virtual Machine Support to the
- Page 215 and 216: 7.2. Virtual Machine Support 1 void
- Page 217 and 218: 7.2. Virtual Machine Support 1 void
- Page 219 and 220: 7.2. Virtual Machine Support Table
- Page 221: 7.3. Summary the RoarVM, primitives
- Page 224 and 225: 8. Evaluation: Performance 8.1. Eva
- Page 226 and 227: 8. Evaluation: Performance tional c
- Page 228 and 229: 8. Evaluation: Performance The goal
- Page 230 and 231: 8. Evaluation: Performance benchmar
- Page 232 and 233: 8. Evaluation: Performance General
- Page 236 and 237: 8. Evaluation: Performance 1.10 1.0
- Page 238 and 239: 8. Evaluation: Performance all OMOP
- Page 240 and 241: 8. Evaluation: Performance 31.62 Am
- Page 242 and 243: 8. Evaluation: Performance Runtime,
- Page 244 and 245: 8. Evaluation: Performance 1.4 1.3
- Page 246 and 247: 8. Evaluation: Performance 1.10 1.0
- Page 248 and 249: 8. Evaluation: Performance Runtime,
- Page 250 and 251: 8. Evaluation: Performance Runtime,
- Page 252 and 253: 8. Evaluation: Performance hide inh
- Page 254 and 255: 8. Evaluation: Performance Conclusi
- Page 256 and 257: 8. Evaluation: Performance improve
- Page 258 and 259: 9. Conclusion and Future Work 9.1.
- Page 260 and 261: 9. Conclusion and Future Work • C
- Page 262 and 263: 9. Conclusion and Future Work A sol
- Page 264 and 265: 9. Conclusion and Future Work The p
- Page 266 and 267: 9. Conclusion and Future Work the a
- Page 268 and 269: 9. Conclusion and Future Work all r
- Page 271 and 272: A A P P E N D I X : S U RV E Y M AT
- Page 273 and 274: A.1. VM Support for Concurrent and
- Page 275 and 276: A.1. VM Support for Concurrent and
- Page 277 and 278: A.2. Concurrent and Parallel Progra
- Page 279 and 280: A.2. Concurrent and Parallel Progra
- Page 281 and 282: A.2. Concurrent and Parallel Progra
- Page 283 and 284: B A P P E N D I X : P E R F O R M A
- Page 285 and 286:
B.1. Benchmark Characterizations LR
- Page 287 and 288:
B.1. Benchmark Characterizations We
- Page 289 and 290:
B.2. Benchmark Configurations B.2.
- Page 291:
B.2. Benchmark Configurations 101 p
- Page 294 and 295:
References Joe Armstrong. A history
- Page 296 and 297:
References Zoran Budimlic, Aparna C
- Page 298 and 299:
References Koen De Bosschere. Proce
- Page 300 and 301:
References Yaoqing Gao and Chung Kw
- Page 302 and 303:
References Michael Haupt, Stefan Ma
- Page 304 and 305:
References ISO. ISO/IEC 14882:2011
- Page 306 and 307:
References Tim Lindholm, Frank Yell
- Page 308 and 309:
References on Modularity In Systems
- Page 310 and 311:
References Johan Östlund, Tobias W
- Page 312 and 313:
References Tardieu. The asynchronou
- Page 314 and 315:
References Matthew J. Sottile, Timo
- Page 316 and 317:
References ming in mobile ad hoc ne
- Page 318:
References 3-14, New York, NY, USA,