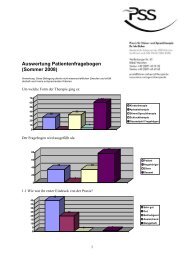
Comparing Outcomes of Voice Therapy - Stimm-und-sprachtherapie ...
Comparing Outcomes of Voice Therapy - Stimm-und-sprachtherapie ...
Comparing Outcomes of Voice Therapy - Stimm-und-sprachtherapie ...

You also want an ePaper? Increase the reach of your titles
YUMPU automatically turns print PDFs into web optimized ePapers that Google loves.
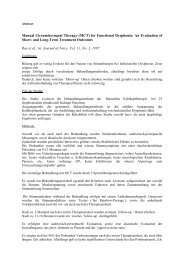
<strong>Comparing</strong> <strong>Outcomes</strong> <strong>of</strong> <strong>Voice</strong> <strong>Therapy</strong>: A<br />
Benchmarking Study Using the <strong>Therapy</strong> Outcome<br />
Measure<br />
*Alexandra John, *Pamela Enderby, and †Anthony Hughes<br />
Sheffield and Bristol, United Kingdom<br />
Summary: The quality cycle requires clinicians to assess the outcomes <strong>of</strong><br />
interventions. Benchmarking is an approach that has been advocated to compare<br />
current performance across different services to identify commonalities<br />
and significant differences. This article gives the results <strong>of</strong> a study <strong>of</strong> outcomes in<br />
speech and language therapy (SLT) using the therapy outcome measure (TOM)<br />
for patients with voice disorder (dysphonia) comparing outcomes <strong>of</strong> seven<br />
separate speech and language therapy services. The study aimed to identify<br />
the similarities and differences in outcomes <strong>of</strong> care provided by different<br />
services. Two h<strong>und</strong>red and forty patients with dysphonia (age range 3–87.5<br />
years, average 51.9 years) were treated. The results indicated that although<br />
there was no significant difference in the pr<strong>of</strong>ile <strong>of</strong> the severity <strong>of</strong> symptomology<br />
<strong>of</strong> patients referred to speech and language therapy in different geographical<br />
areas, there was a significant difference in the treatment outcomes across the<br />
services and in the stated reason for discharge from treatment. Nevertheless,<br />
most patients with dysphonia had a good outcome and this was associated<br />
with completion <strong>of</strong> the course <strong>of</strong> treatment. There were significant differences<br />
in the number <strong>of</strong> treatment contacts provided by the different services and in the<br />
duration (between admission and discharge) <strong>of</strong> treatment across the services.<br />
Benchmarking can provide useful information through use <strong>of</strong> routinely collected<br />
clinical data.<br />
Key Words: Benchmarking—Speech and language therapy—<strong>Therapy</strong> outcome<br />
measures—<strong>Voice</strong> outcomes.<br />
Accepted for publication January 26, 2004.<br />
From the *The University <strong>of</strong> Sheffield, United Kingdom;<br />
†Speech and Language <strong>Therapy</strong> Research Unit <strong>of</strong> North Bristol<br />
NHS Service, United Kingdom.<br />
Address correspondence and reprint requests to Alexandra<br />
John, Research Associate, University <strong>of</strong> Sheffield, Institute <strong>of</strong><br />
General Practice and Primary Care, Community Sciences Centre,<br />
Northern General Hospital, Herries Road, Sheffield S5 7AU,<br />
UK. E-mail: a.k.john@sheffield.ac.uk<br />
Journal <strong>of</strong> <strong>Voice</strong>, Vol. 19, No. 1, pp. 114–123<br />
0892-1997/$30.00<br />
2005 The <strong>Voice</strong> Fo<strong>und</strong>ation<br />
doi:10.1016/j.jvoice.2004.01.008<br />
INTRODUCTION<br />
Political imperatives resulting from the U.K.<br />
Government White Paper “The NHS: Modern and<br />
Dependable” 1 have placed an emphasis on quality<br />
improvement, and to this end, different strategies<br />
have been put in place to promote the better use<br />
<strong>of</strong> existing resources (White Paper: “A First Class<br />
Service” 2 ). Clinical governance has been placed as a<br />
framework for such quality improvement, and<br />
although much <strong>of</strong> health care monitors outcomes<br />
and quality implicitly, there is a move to ensure<br />
114
THERAPY OUTCOME MEASURE 115<br />
that all health care pr<strong>of</strong>essionals actively monitor<br />
quality and effectiveness <strong>of</strong> their services in an explicit<br />
and coordinated fashion. This would ensure<br />
that services provide appropriate interventions and<br />
that variable quality is identified to improve confidence<br />
to users and purchasers <strong>of</strong> services.<br />
Swange 3 identified five areas to address to improve<br />
the quality <strong>of</strong> health services: the culture <strong>of</strong><br />
the organization, inequity and variability in the provision<br />
<strong>of</strong> services, involvement <strong>of</strong> users, sharing<br />
good practice, and detecting and dealing with poor<br />
performance. Benchmarking can assist with four <strong>of</strong><br />
these areas by making comparisons to identify best<br />
practice, providing a baseline for a repeated measure,<br />
facilitating the capacity to learn from variation,<br />
and contributing to the knowledge base. It has utility<br />
in the absence <strong>of</strong> other information on, for example,<br />
what works best for whom, and when relationships<br />
between processes and outcomes <strong>of</strong> care are not<br />
well <strong>und</strong>erstood. 4,5<br />
Benchmarking begins with the identification <strong>of</strong><br />
the specific area <strong>of</strong> the service to be investigated<br />
and compared. It requires four f<strong>und</strong>amental steps:<br />
planning the study, collecting the data, analyzing<br />
the data, and adapting services. 6 For valid comparisons<br />
to be made, it is essential that suitable process<br />
and outcome indicators are selected and data are<br />
collected in a systematic way. 7<br />
Health services internationally have a longer tradition<br />
<strong>of</strong> using benchmarking in financial and nonclinical<br />
services. 8 However, when it has been used<br />
for clinical practice, it has been fo<strong>und</strong> to be a useful<br />
tool. 9,10 In speech and language therapy, the few<br />
benchmarking studies reported in the literature have<br />
focused on internal benchmarking <strong>of</strong> services 11,12<br />
rather than external benchmarking, which compares<br />
one service against other services.<br />
This article describes the results <strong>of</strong> one client<br />
group studied within a larger benchmarking exercise,<br />
whichusedthetherapyoutcomemeasure(TOM) 13,14<br />
as an outcome indicator to compare the outcomes <strong>of</strong><br />
speech and language therapy for individuals with a<br />
voice disorder across different United Kingdom<br />
National Health Service (NHS) Speech and Language<br />
<strong>Therapy</strong> Service sites.<br />
This study aimed to investigate the question<br />
whether there was variability between seven sites<br />
<strong>of</strong>fering speech and language therapy services for<br />
people with a voice problem in terms <strong>of</strong> their severity<br />
on entry to treatment, if they changed in similar<br />
ways during treatment and whether they had similar<br />
pr<strong>of</strong>iles in terms <strong>of</strong> abilities and/or difficulties<br />
on discharge. The study addressed only the first three<br />
steps <strong>of</strong> benchmarking—planning, data collection,<br />
and analysis. The results <strong>of</strong> the analysis were fed<br />
back to the speech and language therapy services<br />
in each <strong>of</strong> the Services. How the services used<br />
this information and what changes resulted are not<br />
reported in this article.<br />
METHOD<br />
This benchmarking study was designed as a longitudinal<br />
cohort study covering a 20-month period.<br />
<strong>Voice</strong> specialists from seven speech and language<br />
therapy services were recruited. Service A provided<br />
a children’s service and Service B an adult service.<br />
The other Services covered both children and adults<br />
from the populations that they served.<br />
The TOM was selected as the outcome indicator.<br />
This is a single measure with four dimensions, specifically<br />
the Impairment (the degree <strong>of</strong> severity <strong>of</strong><br />
the voice disorder), Disability/Activity (the degree<br />
<strong>of</strong> limitation in use <strong>of</strong> voice to communicate), Handicap/Participation<br />
(amount <strong>of</strong> disadvantage to social<br />
participation), and Well-being <strong>of</strong> the patient (affect<br />
on emotion/level <strong>of</strong> distress). The first three dimensions<br />
are based on the WHO ICIDH. 15 The speech<br />
and language therapists (SLTs) were trained to use<br />
their clinical judgment based on the assessment and<br />
case history to rate the patient independently on each<br />
<strong>of</strong> these four dimensions. Each TOM dimension has<br />
an ordinal 11-point rating scale. Each scale has six<br />
integers defined by operational descriptors (see<br />
example in Appendix) with <strong>und</strong>efined half points<br />
that are included to increase the sensitivity <strong>of</strong> the<br />
measure. The development and psychometric properties<br />
<strong>of</strong> the TOM have been described in the<br />
<strong>Therapy</strong> Outcome Measures: Speech & Language<br />
Pathology Technical Manual. 14 The measure allows<br />
a quick, reliable representation <strong>of</strong> a clinician’s view<br />
<strong>of</strong> the speech and language condition and its impact.<br />
The participating speech and language therapists<br />
were adequately trained in the use <strong>of</strong> TOM 16 and<br />
achieved good levels <strong>of</strong> inter-rater reliability.<br />
Journal <strong>of</strong> <strong>Voice</strong>, Vol. 19, No. 1, 2005
116<br />
ALEXANDRA JOHN ET AL<br />
TABLE 1. Number, Percentage, Mean Age and Age Range for “All Cases” and Cases by Service<br />
<strong>Voice</strong> disorder Service A Service B Service C Service D Service E Service F Service G All cases<br />
Number <strong>of</strong> cases 5 68 29 46 6 46 40 240<br />
Percentage 2.1% 28.3% 12.1% 19.2% 2.5% 19.2% 16.7% 100%<br />
Mean age*** 14.6 56.8 51.9 50.2 49.6 46.5 51.7 50.3<br />
Age range 11.9–16.5 28.4–87.6 18.4–79.6 7.2–78.3 3–82.8 10–76.6 5.62–86.7 3.1–87.6<br />
***p 0.001.<br />
The speech and language therapists used the TOM<br />
to rate consecutive new cases on admission to treatment,<br />
at the end <strong>of</strong> each episode <strong>of</strong> care and on<br />
discharge from therapy.<br />
The analysis <strong>of</strong> the data aimed to answer the<br />
study questions.<br />
Do clients have an equal opportunity <strong>of</strong> accessing<br />
voice therapy regardless <strong>of</strong> where they are<br />
treated?<br />
Does the application <strong>of</strong> voice therapy produce<br />
similar changes in clients’ abilities and/or disabilities,<br />
regardless <strong>of</strong> where the treatment is<br />
provided?<br />
Do clients have similar pr<strong>of</strong>iles <strong>of</strong> abilities and/<br />
or disabilities on discharge regardless <strong>of</strong> where<br />
they are treated?<br />
Is there a difference in the quantity and duration<br />
<strong>of</strong> treatment and is this associated with amount<br />
<strong>of</strong> change?<br />
Ordinal data were analyzed using a Kruskal–<br />
Wallis statistic, and interval data were analyzed<br />
using ANOVA.<br />
RESULTS<br />
At the end <strong>of</strong> the 18-month data collection period,<br />
TOM data for 240 cases had been coded by the SLTs<br />
as having a voice disorder. Of these, although 183<br />
(76%) had completed their treatment, 57 (24%) were<br />
still in treatment at the end <strong>of</strong> the study period.<br />
Table 1 shows the numbers <strong>of</strong> cases entered by each<br />
participating Service.<br />
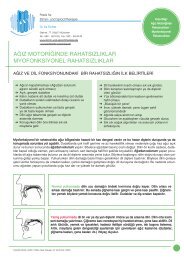
There were a number <strong>of</strong> etiologies associated with<br />
dysphonia requiring a referral to speech and language<br />
therapy (see Figure 1). The diagnosis was<br />
provided by the SLTs from their clinical records and<br />
denotes SLT opinion based on assessment and<br />
medical information. Vocal misuse represented the<br />
largest group.<br />
Results related to Question 1<br />
Do clients have an equal opportunity<br />
<strong>of</strong> accessing voice therapy regardless <strong>of</strong> where<br />
they are treated?<br />
To address the first study question, the analysis<br />
investigated the age <strong>of</strong> patients on admission to treatment<br />
and the initial ratings for all patients (to act as<br />
a benchmark and, by Service, to provide comparison<br />
with the overall benchmark). The age pr<strong>of</strong>ile is<br />
shown in Table 1.<br />
The median age on entry to treatment for all patients<br />
was 51.9 years with an overall range <strong>of</strong> 3.1–<br />
87.6 years. The data analysis fo<strong>und</strong> a significant<br />
difference across the Services in the age <strong>of</strong> patients<br />
on entry to treatment (ANOVA F 4.0; df 6; p <br />
0.001). This may be explained, in part, by Service<br />
A providing services only to a pediatric population,<br />
whereas Service C did not rate any pediatric patients<br />
during the study. The other Services (B, D, E, F, C)<br />
showed a more similar pr<strong>of</strong>ile <strong>of</strong> ages (within a 6-<br />
year spread <strong>of</strong> ages). The initial TOM admission<br />
ratings showed variation with age. There was a<br />
tendency for the younger patients to have a higher<br />
initial rating on Participation and Well-being than<br />
older patients. Analysis showed a significant difference<br />
in the age <strong>of</strong> patients on admission to treatment<br />
and the initial start rating on Disability/Activity<br />
(Kruskal–Wallis H 104.5; df 73; p 0.009) and on<br />
Participation (Kruskal–Wallis H 93.5; df 73; p 0.05).<br />
However, there were no significant differences in the<br />
age <strong>of</strong> patients on admission and contacts or for age and<br />
duration <strong>of</strong> treatment for those completing treatment.<br />
Inspection <strong>of</strong> the data for patients with a structural<br />
voice pathology showed a tendency for patient to<br />
have a lower initial rating than the other conditions<br />
causing dysphonia, but this was not statistically significant.<br />
The analysis <strong>of</strong> the initial admission ratings<br />
data for all patients with dysphonia did not indicate<br />
any significant difference across the Services on<br />
Journal <strong>of</strong> <strong>Voice</strong>, Vol. 19, No. 1, 2005
THERAPY OUTCOME MEASURE 117<br />
FIGURE 1. Etiologies associated with voice disorders.<br />
the dimensions <strong>of</strong> Impairment, Disability/Activity,<br />
and Participation/Handicap, although there were<br />
significant differences on the Well-being (Kruskal–<br />
Wallis H 12.8; df 6; p 0.04). Table 2 shows the<br />
mean, median, and range <strong>of</strong> the initial admission<br />
ratings for the Services.<br />
The results <strong>of</strong> analysis indicate that patients<br />
tended to enter treatment for voice therapy at similar<br />
points on the TOM with the exception <strong>of</strong> Well-being.<br />
This suggests that there was equity <strong>of</strong> access to<br />
treatment for patients with a voice disorder across<br />
these Services. The results do not indicate that the<br />
severity <strong>of</strong> the dysphonic condition, as rated on<br />
the TOM, produced any inequality in a client’s opportunity<br />
to access voice therapy.<br />
Results related to Question 2<br />
Does the application <strong>of</strong> voice therapy produce<br />
similar changes in clients’ abilities and/or<br />
disabilities, regardless <strong>of</strong> where the<br />
treatment is provided?<br />
Most patients made positive progress during<br />
treatment; a few made a negative change; and some<br />
sustained their positions on the rating scale; <strong>of</strong><br />
these, the dimension <strong>of</strong> Participation had the highest<br />
number <strong>of</strong> patients sustaining the initial rating. The<br />
patients who were rated at “5” at the start and end<br />
<strong>of</strong> treatment (in other words, had no difficulties on<br />
this dimension) were subtracted from the total sustained<br />
and the number shown in brackets in Table<br />
3. The number <strong>of</strong> patients showing positive improvement,<br />
sustaining their TOM rating, or changing negatively<br />
were analyzed using the Kruskal–Wallis<br />
statistic. There was a significant difference across<br />
Services on Impairment (Kruskal–Wallis H 13.2; df<br />
6; p 0.04) and a significant difference on Participation<br />
(Kruskal–Wallis H 24.7; df 6; p 0.0001). On<br />
this measure, the TOM ratings showed no significant<br />
differences between the Services on the dimensions<br />
<strong>of</strong> Disability/Activity, and Well-being. The dimension<br />
<strong>of</strong> Participation showed many patients (42%)<br />
were not rated as experiencing social disadvantages<br />
as a result <strong>of</strong> their dysphonia. The study findings indicated<br />
that most patients made a positive change<br />
and that the application <strong>of</strong> voice therapy produced<br />
variations in changes on specific dimensions dependant<br />
on where the patient was treated.<br />
Journal <strong>of</strong> <strong>Voice</strong>, Vol. 19, No. 1, 2005
118<br />
ALEXANDRA JOHN ET AL<br />
TABLE 2. Initial Admission Rating Mean, Median, and Range for “All Cases” and by Service<br />
Statistic Service A Service B Service C Service D Service E Service F Service G All cases<br />
Impairment 5 68 29 46 6 46 40 240 cases<br />
Mean 2.6 2.9 2.8 2.9 2.8 2.9 2.7 2.8<br />
Median 3 3 3 3 3 3 3 3<br />
Range 1–3.5 1–4 1–4 1–4 1.5–4 0–5 0–4.5 0–5<br />
Disability/activity<br />
Mean 2.5 2.8 3 2.9 2.6 3.1 3 2.9<br />
Median 3 3 3 3 2.7 3 3 3<br />
Range 1–3.5 1–5 2–4 0–5 1.5–3.5 1–5 0–4 0–5<br />
Participation/handicap<br />
Mean 4 3.7 3.7 4.1 4 3.9 4 3.9<br />
Median 4 4 4 4 4 4 4 4<br />
Range 3–5 1–5 .5–5 3–5 3–5 1.5–5 2.5–5 .5–5<br />
Well-being<br />
Mean 2.7 3.4 3.5 3.1 3.3 3.2 2.9 3.2<br />
Median* 3 3.5 4 3 3.5 3.3 3 3.5<br />
Range 1–4 1–5 1–5 1–4.5 1–5 0–5 1–5 0–5<br />
*p 0.05.<br />
Results related to Question 3<br />
Do clients have similar pr<strong>of</strong>iles <strong>of</strong> abilities<br />
and/or disabilities on discharge regardless<br />
<strong>of</strong> where they are treated?<br />
At the end <strong>of</strong> the study, 183 patients had completed<br />
treatment and were discharged from voice<br />
therapy. The mean, median, and range <strong>of</strong> final TOM<br />
ratings are shown in Table 4.<br />
Statistical analysis fo<strong>und</strong> a significant difference<br />
across the Services on all TOM dimensions, a significant<br />
difference on all dimensions <strong>of</strong> the TOM;<br />
the results for Impairment were Kruskal–Wallis H<br />
19.9; df 6; p 0.003, Disability/Activity Kruskal–<br />
Wallis H 24; df 6; p 0.001, Participation Kruskal–<br />
Wallis H 23.9; df 6; p 0.001; and Well-being<br />
Kruskal–Wallis H 22; df 6; p 0.001. The results<br />
show a significant variation across the Services in<br />
the outcomes <strong>of</strong> treatment, for example, in one Service<br />
(Service G), patients were discharged when<br />
the TOM rating was at 5 (normal), whereas other<br />
Services discharged patients when some difficulties<br />
still remained.<br />
Analysis on the reason patients were discharged<br />
from treatment showed that those who had completed<br />
their treatment were the majority (83%)<br />
(Table 5). Nevertheless, there were significant differences<br />
across the Services in the reason for discharge.<br />
For example, Service B had patients in six <strong>of</strong> the categories<br />
for “Reason for discharge.” This contrasted<br />
with Service D where all patients were discharged as<br />
“Treatment complete.” On the overall benchmark,<br />
the categories <strong>of</strong> “Self discharge” and “Non attendance”<br />
were the main alternative reasons provided<br />
for discharge, comprising 5% <strong>of</strong> the cases. Analysis<br />
<strong>of</strong> the reason for discharge and each TOM dimension<br />
showed significant differences between the final ratings<br />
and the reason for discharge (Table 5). It was<br />
also noted by the authors from reviewing the data<br />
that patients who had completed their treatment<br />
achieved higher final ratings on all TOM dimensions,<br />
indicating a more positive outcome.<br />
Results related to Question 4<br />
Is there a difference in the quantity and<br />
duration <strong>of</strong> treatment and is this associated<br />
with amount <strong>of</strong> change?<br />
Table 6 shows the contacts and duration <strong>of</strong> treatment.<br />
There was a significant difference in the<br />
number <strong>of</strong> contacts received by the voice patients<br />
ANOVA F 2.4; df 6; p 0.03 and an even more<br />
significant different across the Services (ANOVA F<br />
5.6; df 6; p 0.001) for the duration <strong>of</strong> treatment. It<br />
can be seen that the benchmark for all patients shows<br />
5.9 contacts SD 3.9 and a duration <strong>of</strong> 5 months SD<br />
Journal <strong>of</strong> <strong>Voice</strong>, Vol. 19, No. 1, 2005
THERAPY OUTCOME MEASURE 119<br />
TABLE 3. <strong>Voice</strong>: Cases Completing Treatment; Direction <strong>of</strong> Change for All Cases and by Service#<br />
Direction <strong>of</strong> Service Service Service Service Service Service Service<br />
TOM dimension change A B C D E F G All cases % All cases<br />
Number <strong>of</strong> cases 5 48 29 23 4 43 31 183 —<br />
Impairment* Negative change 0 0 0 0 0 1 0 1 0.5%<br />
Sustained 1 7 (2) 2 0 0 8 (2) 2 20 (4) 13%<br />
Positive change 4 39 27 23 4 32 29 158 86%<br />
Disability/activity Negative change 0 0 0 0 0 1 0 1 0.5%<br />
Sustained 0 4 (2) 2 1 (1) 0 7 (3) 2 16 (6) 12%<br />
Positive change 5 47 27 21 4 32 29 160 87%<br />
Participation*** Negative change 0 0 0 0 0 1 0 1 0.5%<br />
Sustained 2 (1) 10 (3) 2 (2) 1 (5) 3 (1) 8 (15) 1 (11) 27 (38) 36%<br />
Positive change 2 35 25 17 0 19 19 117 64%<br />
Well-being Negative change 0 0 0 1 0 1 0 2 1%<br />
Sustained 0 6 (3) 3 (3) 1 0 (1) 8 (3) 0 (1) 18 (11) 16%<br />
Positive change 5 39 23 21 3 31 30 152 83%<br />
#(The number <strong>of</strong> cases rated ‘5’ at start and finish are shown separately in the brackets).<br />
*p 0.05.<br />
***p 0.001.<br />
4.4, showing variation in the intervention provided<br />
to patients. Of all <strong>of</strong> the Services, Service G had a<br />
tendency to provide more intervention over a similar<br />
duration than the other Services.<br />
DISCUSSION<br />
This benchmarking study collected routine clinical<br />
outcome data on nonselected consecutively referred<br />
patients from seven speech and language<br />
therapy services using the TOM. Analysis <strong>of</strong> the data<br />
fo<strong>und</strong> that patients with voice disorders entered into<br />
the study and appeared to have equity <strong>of</strong> access<br />
to treatment regardless <strong>of</strong> location. Most patients referred<br />
were middle aged, but there was a wide overall<br />
age range represented. The literature relating to the<br />
epidemiology <strong>of</strong> voice disorders indicates a wide<br />
variation in the age pr<strong>of</strong>ile in the general population.<br />
Various studies quote different figures. 17,18 In this<br />
study, the analysis <strong>of</strong> initial rating showed variation<br />
with age across the TOM dimensions. There was a<br />
tendency for the younger patients to have a higher<br />
initial rating on Participation and Well-being than<br />
older patients. One might speculate that voice problems<br />
in children cause less impact on their social life<br />
in general than fo<strong>und</strong> in adults. One interpretation<br />
<strong>of</strong> these results is that voice disorders may present<br />
different difficulties to people at different stages in<br />
their life.<br />
The analysis <strong>of</strong> change over time in treatment<br />
fo<strong>und</strong> a significant difference across the Services<br />
only in the dimension <strong>of</strong> Handicap/Participation.<br />
There were differences in the number <strong>of</strong> patients who,<br />
on presentation to therapy, were graded as having<br />
no disadvantage in Participation versus those who<br />
were disadvantaged and sustained that disadvantage.<br />
The pr<strong>of</strong>ile across the Services varied, for example,<br />
Services B and G show a markedly different<br />
pattern. The overall benchmark shows that most<br />
made a positive change on each <strong>of</strong> the dimensions.<br />
It has proved difficult to compare the TOM findings<br />
directly with other research studies because <strong>of</strong><br />
the variation in the way other studies were conducted<br />
and reported and reviewed. The findings <strong>of</strong> this study<br />
showed positive change, and this reflects the findings<br />
from studies on effectiveness, which report that most<br />
patients do benefit from treatment. 17–20<br />
This study fo<strong>und</strong> significant variation across the<br />
Services in the outcomes to treatment. The variation<br />
appeared to relate to SLTs discharging patients at<br />
differing points. This suggests that SLTs use different<br />
judgments when discharging patients. Considerable<br />
variation in the frequency and duration <strong>of</strong><br />
treatment was reported in the literature. 18 The use<br />
Journal <strong>of</strong> <strong>Voice</strong>, Vol. 19, No. 1, 2005
120<br />
ALEXANDRA JOHN ET AL<br />
TABLE 4. <strong>Voice</strong> Cases’ Final TOM Ratings; Mean, Median, and Range<br />
Statistic Service A Service B Service C Service D Service E Service F Service G All cases<br />
Number <strong>of</strong> cases 5 48 29 23 4 43 31 183<br />
Impairment<br />
Mean 3.9 4.4 4.2 4.5 4 4 4.6 4.3<br />
Median** 4.5 4.5 4.5 4.5 4 4 5 4.5<br />
Range 2–5 2–5 2.5–5 4–5 3–5 1.5–5 2–5 1.5–5<br />
Disability/activity<br />
Mean 3.8 4.4 4.2 4.6 4 4.1 4.7 4.3<br />
Median*** 4.5 4.5 4.5 5 4 4.5 5 4.5<br />
Range 2.5–5 3–5 2.5–5 4–5 3–5 2–5 3–5 2–5<br />
Participation<br />
Mean 4.6 4.6 4.6 4.9 4.2 4.4 4.8 4.6<br />
Median*** 5 4.5 5 5 4 5 5 5<br />
Range 4–5 4–5 2–5 4.5–5 4–5 2–5 3.5–5 2–5<br />
Well-being<br />
Mean 4.2 4.6 4.2 4.5 4.2 4.3 4.9 4.5<br />
Median*** 4.5 5 5 5 4.5 4.5 5 5<br />
Range 2.5 3.5–5 1.5–5 0–5 3–5 2–5 4–5 0–5<br />
**p 0.01.<br />
***p 0.001.<br />
<strong>of</strong> different measures in studies makes direct comparisons<br />
difficult; some studies reported sessions,<br />
others reported the actual time, and a few studies<br />
report the duration <strong>of</strong> treatment. The range varied<br />
considerably in the studies reported and reviewed by<br />
Pannbacker, 18 for example, 4 contacts to 51 contacts,<br />
whereas the duration <strong>of</strong> treatment ranged from 2<br />
weeks to 2 years. Few studies quoted both the<br />
number <strong>of</strong> contacts and the duration <strong>of</strong> treatment.<br />
For those studies that reported both, the intensity<br />
and duration ranged from 5 contacts in 5 days to 1<br />
contact a week over 3 to 7 months (approximately 12<br />
to 28 contacts). This is in contrast to this study<br />
where the range for all patients varied from 1 to 23<br />
contacts with the duration from 0.1 month to 20.2<br />
months. This variation shows the need to collect<br />
data routinely and systematically on contacts and<br />
duration if valid comparisons between pr<strong>of</strong>iles <strong>of</strong><br />
intervention intensity are to be gathered to inform<br />
and change practice to effect better care.<br />
We fo<strong>und</strong> a marked variation in the reasons for<br />
discharge from treatment, and in the final rating,<br />
with a highly significant difference across the Services.<br />
This study indicates that patients completing<br />
their full treatment had the best outcomes. However,<br />
some Services had more patients discharged for alternative<br />
reasons. It would have been useful to know<br />
why these patients chose not to complete their treatment<br />
(most self-discharged or did not attend) when<br />
they still had difficulties as reflected in the poorer<br />
outcomes recorded at the time they ceased attending<br />
for treatment. A future study might usefully follow<br />
up such patients to identify why they chose to end<br />
attendance. The different pr<strong>of</strong>iles on all dimensions<br />
on the TOM on discharge from treatment were dependent<br />
on location <strong>of</strong> treatment. The reason for<br />
this result is unknown and related to a number <strong>of</strong><br />
factors such as the type <strong>of</strong> treatment used in the<br />
intervention, the patients’ or SLTs’ characteristics,<br />
the etiology, or case management. However, the<br />
study results indicate that despite the variations in<br />
the outcomes <strong>of</strong> care on TOM across the Services,<br />
speech and language therapy treatment for patients<br />
with voice disorders is generally effective.<br />
This finding concurs with a number <strong>of</strong> studies conducted<br />
on voice disorders. 18–21<br />
CONCLUSION<br />
This study has shown the results <strong>of</strong> benchmarking<br />
outcomes in a specific client group. The analysis <strong>of</strong><br />
the TOM data to answer the study questions has<br />
highlighted similarities and differences between SLT<br />
Services. The benchmarking process enabled the<br />
Journal <strong>of</strong> <strong>Voice</strong>, Vol. 19, No. 1, 2005
THERAPY OUTCOME MEASURE 121<br />
TABLE 5. Summary <strong>of</strong> Median TOM Ratings by Reason for Discharge Code<br />
Discharge code and number<br />
Disability/<br />
<strong>of</strong> cases Number Percentage Impairment*** Activity*** Participation*** Well-being***<br />
Remains on caseload 3 2% 4 4 4 4.5<br />
Treatment complete 151 83% 4.5 4.5 5 5<br />
Self-discharge 10 5% 3.5 4 4.5 4<br />
Transfer 4 2% 4.3 4 4 4.3<br />
Unlikely to reach potential 4 2% 2.3 3.0 4.3 4.5<br />
Did not attend 10 5% 3.5 3.8 4.3 4.3<br />
Other 1 0.5% 3 3 2 3<br />
All cases 183 100% 4.5 4.5 5 5<br />
***p 0.001.<br />
TABLE 6. Mean Contacts and Duration <strong>of</strong> Treatment<br />
for All Cases and by Service<br />
Duration <strong>of</strong><br />
Service and cases Statistic Contacts* therapy***<br />
A Mean 6.6 4.7<br />
n 5 SD 3.6 0.6<br />
B Mean 5.5 7.9<br />
n 48 SD 3.5 5.7<br />
C Mean 5.9 3.8<br />
n 29 SD 4.0 3.6<br />
D Mean 4.6 3.2<br />
n 23 SD 2.6 2.1<br />
E Mean 6.0 4.0<br />
n 4 SD 1.4 2.1<br />
F Mean 5.4 4.5<br />
n 43 SD 2.7 3.2<br />
G Mean 8.0 4.1<br />
n 31 SD 5.7 4.0<br />
All cases Mean 5.9 5.0<br />
n 183 SD 3.9 4.4<br />
*p 0.01.<br />
***p 0.001.<br />
participating SLTs to compare their data with that<br />
<strong>of</strong> the overall benchmark for all patients and then<br />
to compare this with other services to identify<br />
best performance.<br />
A future benchmarking study would aim to complete<br />
the benchmarking process by investigating<br />
how the information was used to effect change and<br />
link the process <strong>of</strong> care to that <strong>of</strong> outcomes. Ideally,<br />
this benchmarking process would be repeated once<br />
changes have been effected to identify whether better<br />
outcomes resulted. Benchmarking has the potential<br />
to inform SLTs on aspects <strong>of</strong> their practice and performance<br />
by using those tools in routine clinical<br />
practice. This can help SLTs to build a picture <strong>of</strong><br />
performance and engender change for quality<br />
improvement.<br />
REFERENCES<br />
1. Secretary <strong>of</strong> State for Health. The New NHS, Modern, Dependable.<br />
London, UK: HMSO; 1997.<br />
2. Secretary <strong>of</strong> State for Health. A First Class Service, Quality<br />
in the New NHS. London, U.K.: HMSO; 1998.<br />
3. Swage T. Clinical Governance in Healthcare Practice.<br />
Oxford, U.K.: Butterworth & Heinemann; 2000.<br />
4. Bullivant J. (1996) Benchmarking in the UK NHS. Int. J<br />
Health Care Quality Assurance. 1996;9:9–14.<br />
5. Bullivant J, Roberts A. Service benchmarking: to choose<br />
to improve. Health Service Manager (Special Report no.<br />
14). Kingston upon Thames, U.K.: Croner Publications<br />
Ltd; 1997.<br />
6. MacDonald J, Tanner S. Understanding Benchmarking.<br />
London, U.K.: Hodder & Stoughton; 1998.<br />
7. Johnson J. Making self-regulation credible through benchmarking,<br />
peer review, appraisal and management. Brit Med<br />
J. 1998;316:1847–1848.<br />
8. Franklin R. When Will the Penny Drop-the State <strong>of</strong> Benchmarking<br />
in the NHS? Manchester: McClean Jones McCarthy<br />
Ltd; 1995: 1–12.<br />
9. Higgins I. Benchmarking in health care: a review <strong>of</strong> the<br />
literature. Australian Health Rev. 1997;20:60–68.<br />
10. Ellis J. Sharing the evidence: clinical practice benchmarking<br />
to improve continuously the quality <strong>of</strong> care. J Adv<br />
Nursing. 2000;32:215–225.<br />
11. Yaruss J, La Salle L, Conture E. Evaluating stuttering in<br />
young children: diagnostic data. Amer J Speech-Lang Pathol.<br />
1998;7:62–76.<br />
12. Hunt J, Slater A. From start to outcome—and beyond.<br />
Speech Lang <strong>Therapy</strong> Practice. 1999;Autumn:4–6.<br />
Journal <strong>of</strong> <strong>Voice</strong>, Vol. 19, No. 1, 2005
122<br />
ALEXANDRA JOHN ET AL<br />
13. Enderby P. Outcome measures in speech therapy: impairment,<br />
disability, handicap, and distress. Health Trends.<br />
1992;24:61–64.<br />
14. Enderby P, John A. <strong>Therapy</strong> Outcome Measures: Speech-<br />
Language Pathology. San Diego, CA: Singular Publishing<br />
Group, Inc.; 1997.<br />
15. World Health Organisation. International Classification <strong>of</strong><br />
Impairments, Disabilities, and Handicaps (ICIDH).<br />
Geneva, Switzerland: WHO; 1980.<br />
16. John A. <strong>Therapy</strong> Outcome Measures for Benchmarking in<br />
Speech and Language Theraphy. PhD dissertation (unpublished).<br />
University <strong>of</strong> Sheffield; 2001.<br />
17. Ramig LO, Verdolini K. Treatment efficacy: voice disorders.<br />
J Speech Lang Hear Res. 1998;41:101–116.<br />
18. Pannbacker M. <strong>Voice</strong> treatment techniques: a review and<br />
recommendations for outcome studies. Am J Speech Lang<br />
Pathol. 1998;7:49–64.<br />
19. Carding P, Horsley I, Docherty G. A study <strong>of</strong> the effectiveness<br />
<strong>of</strong> voice therapy in the treatment <strong>of</strong> 45 patients with<br />
non-organic dysphonia. J <strong>Voice</strong>. 1999;13:72–104.<br />
20. Verdolini K, Ramig LO, Jacobson B. Outcome measurement<br />
in voice disorders. In: Frattali CM, editor. Measuring<br />
<strong>Outcomes</strong> in Speech-Language Pathology, New York and<br />
Stuttgart: Thieme; 1998. p. 354–386.<br />
21. Enderby P, Emerson J. Does Speech and Language <strong>Therapy</strong><br />
Work? London, U.K.: Whurr Publishers Ltd.; 1995.<br />
APPENDIX: DYSPHONIA<br />
Identify descriptor that is “best fit.” The patient does not have to have each feature mentioned. Use 0.5<br />
to indicate if patient is slightly better or worse than a descriptor.<br />
Impairment (as appropriate to age)<br />
0 Severe persistent aphonia. Unable to phonate. Does not phonate.<br />
1 Consistent dysphonia. Occasional phonation. May be dysphonic with aphonic episodes.<br />
2 Moderate dysphonia. Can phonate but frequent episodes <strong>of</strong> marked vocal impairment occurring.<br />
3 Moderate/mild dysphonia. Less frequent episodes <strong>of</strong> dysphonia (eg occurs some time each day/or<br />
slight persistent "huskiness").<br />
4 Mild dysphonia. Occasional episodes <strong>of</strong> dysphonia occurring (eg on a weekly basis or less).<br />
5 No dysphonia. Appropriate/modal voice consistently used.<br />
Activity/Disability (as appropriate to age)<br />
0 <strong>Voice</strong> production is completely ineffective/inappropriate in all situations.<br />
1 <strong>Voice</strong> production is completely ineffective/inappropriate in most situations except occasionally with<br />
familiar listeners or modified environments.<br />
2 <strong>Voice</strong> production is effective/appropriate in modified environments (e.g. quiet situations, familiar<br />
situations).<br />
3 <strong>Voice</strong> production is effective/appropriate but can be unpredictable in some situations. <strong>Voice</strong> production<br />
requires less personal attention and effort in most situations.<br />
4 <strong>Voice</strong> production is effective/appropriate on most occasions. Rarely effortful. Very occasional difficulties<br />
experienced.<br />
5 <strong>Voice</strong> production is spontaneously effective and appropriate.<br />
Participation/Handicap (as appropriate to age)<br />
0 Unable to fulfil any social/educational/family role. Not involved in decision making/no autonomy/no<br />
control over environment. No social integration.<br />
1 Low self-confidence/poor self-esteem/limited social integration/socially isolated/contributes to some<br />
basic and limited decisions. Cannot achieve potential in any situation.<br />
2 Some self-confidence/some social integration/makes some decisions and influences control in familiar<br />
situations.<br />
3 Some self-confidence, autonomy emerging. Makes decisions and has control <strong>of</strong> some aspects <strong>of</strong> life.<br />
Able to achieve some limited social integration/educational activities. Diffident over control over<br />
life. Needs encouragement to achieve potential.<br />
Journal <strong>of</strong> <strong>Voice</strong>, Vol. 19, No. 1, 2005
THERAPY OUTCOME MEASURE 123<br />
4 Mostly confident, occasional difficulties integrating or in fulfilling social/role activity. Participating in<br />
all appropriate decisions. May have difficulty in achieving potential in some situations occasionally.<br />
5 Achieving potential, autonomous and unrestricted. Able to fulfil social, educational, and family role.<br />
Well-being/Distress (as appropriate to age)<br />
0 Severe constant: upset/frustration/anger/distress/embarrassment/concern/withdrawal.<br />
1 Frequently severe: upset/frustration/anger/distress/embarrassment/concern/withdrawal.<br />
2 Moderate consistent: upset/frustration/anger/distress/embarrassment/concern/withdrawal.<br />
3 Moderate frequent: upset/frustration/anger/distress/embarrassment/concern/withdrawal.<br />
4 Mild occasional: upset/frustration/anger/distress/embarrassment/concern/withdrawal.<br />
5 No inappropriate: upset/frustration/anger/distress/embarrassment/concern/withdrawal.<br />
Journal <strong>of</strong> <strong>Voice</strong>, Vol. 19, No. 1, 2005