Canada-Wide Action Plan for Extended Producer ... - CCME
Canada-Wide Action Plan for Extended Producer ... - CCME
Canada-Wide Action Plan for Extended Producer ... - CCME

You also want an ePaper? Increase the reach of your titles
YUMPU automatically turns print PDFs into web optimized ePapers that Google loves.
1. INTRODUCTION<br />
Why a <strong>Canada</strong>-wide <strong>Action</strong> <strong>Plan</strong> on <strong>Extended</strong> <strong>Producer</strong> Responsibility?<br />
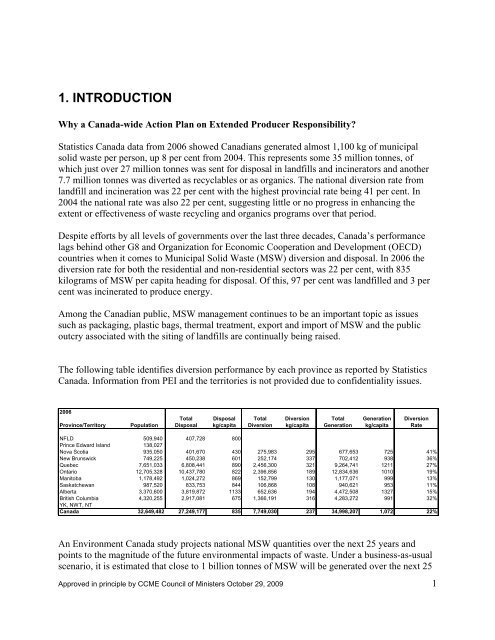
Statistics <strong>Canada</strong> data from 2006 showed Canadians generated almost 1,100 kg of municipal<br />
solid waste per person, up 8 per cent from 2004. This represents some 35 million tonnes, of<br />
which just over 27 million tonnes was sent <strong>for</strong> disposal in landfills and incinerators and another<br />
7.7 million tonnes was diverted as recyclables or as organics. The national diversion rate from<br />
landfill and incineration was 22 per cent with the highest provincial rate being 41 per cent. In<br />
2004 the national rate was also 22 per cent, suggesting little or no progress in enhancing the<br />
extent or effectiveness of waste recycling and organics programs over that period.<br />
Despite ef<strong>for</strong>ts by all levels of governments over the last three decades, <strong>Canada</strong>’s per<strong>for</strong>mance<br />
lags behind other G8 and Organization <strong>for</strong> Economic Cooperation and Development (OECD)<br />
countries when it comes to Municipal Solid Waste (MSW) diversion and disposal. In 2006 the<br />
diversion rate <strong>for</strong> both the residential and non-residential sectors was 22 per cent, with 835<br />
kilograms of MSW per capita heading <strong>for</strong> disposal. Of this, 97 per cent was landfilled and 3 per<br />
cent was incinerated to produce energy.<br />
Among the Canadian public, MSW management continues to be an important topic as issues<br />
such as packaging, plastic bags, thermal treatment, export and import of MSW and the public<br />
outcry associated with the siting of landfills are continually being raised.<br />
The following table identifies diversion per<strong>for</strong>mance by each province as reported by Statistics<br />
<strong>Canada</strong>. In<strong>for</strong>mation from PEI and the territories is not provided due to confidentiality issues.<br />
2006<br />
Total Disposal Total Diversion Total Generation Diversion<br />
Province/Territory Population Disposal kg/capita Diversion kg/capita Generation kg/capita Rate<br />
NFLD 509,940 407,728 800<br />
Prince Edward Island 138,027<br />
Nova Scotia 935,050 401,670 430 275,983 295 677,653 725 41%<br />
New Brunswick 749,225 450,238 601 252,174 337 702,412 938 36%<br />
Quebec 7,651,033 6,808,441 890 2,456,300 321 9,264,741 1211 27%<br />
Ontario 12,705,328 10,437,780 822 2,396,856 189 12,834,636 1010 19%<br />
Manitoba 1,178,492 1,024,272 869 152,799 130 1,177,071 999 13%<br />
Saskatchewan 987,520 833,753 844 106,868 108 940,621 953 11%<br />
Alberta 3,370,600 3,819,872 1133 652,636 194 4,472,508 1327 15%<br />
British Columbia 4,320,255 2,917,081 675 1,366,191 316 4,283,272 991 32%<br />
YK, NWT, NT<br />
<strong>Canada</strong> 32,649,482 27,249,177 835 7,749,030 237 34,998,207 1,072 22%<br />
An Environment <strong>Canada</strong> study projects national MSW quantities over the next 25 years and<br />
points to the magnitude of the future environmental impacts of waste. Under a business-as-usual<br />
scenario, it is estimated that close to 1 billion tonnes of MSW will be generated over the next 25<br />
Approved in principle by <strong>CCME</strong> Council of Ministers October 29, 2009 1