Download PDF - Gear Technology magazine
Download PDF - Gear Technology magazine
Download PDF - Gear Technology magazine

Create successful ePaper yourself
Turn your PDF publications into a flip-book with our unique Google optimized e-Paper software.
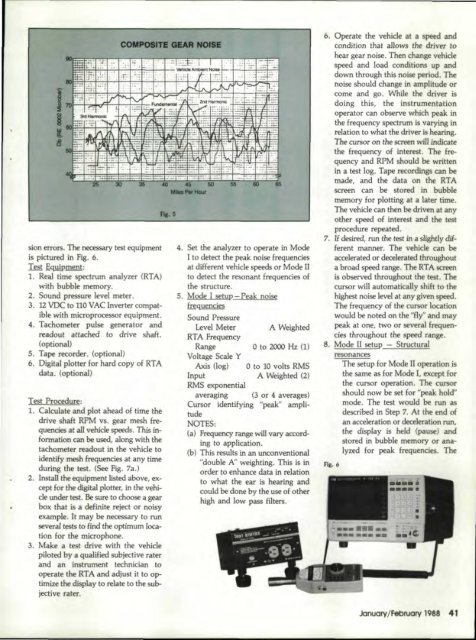
COMPOSITE<br />
sion 'errors. The necessary test equipment<br />
is pictured in. Fig. 6.<br />
Test sqyipmenb<br />
1. Real time spectrum analyzer (RTA)<br />
with bubble memory.<br />
2. Sound pressure level meter.<br />
3. 12 VDC to no VAC Inverter compatible<br />
with microprocessor equipment.<br />
4. Tachometer pulse generator and<br />
readout atta.ched todriV'e shaft.<br />
(optional)<br />
5. Tape recorder. (eptional)<br />
6. Digital plotter for hard copy of RTA<br />
data. (optional)<br />
Test Proeedurer<br />
1. Calculate and plot ahead of 'ti,me the<br />
drive shMt RPM vs .. gear mesh fee-<br />
,quendes at all vehide' speeds. This infannalion<br />
can be used, along with the<br />
tachometer readout in the vehide to<br />
identify mesh frequencies at anytime<br />
during th test. (See Fig.7a.)<br />
2. Install the ,equipment listed above, 'exeept<br />
for the digital plotter, in. the vehicle<br />
under test Be sure to choose a gear<br />
box that is a definite reject or noisy<br />
example. It may be neeessarytorun<br />
several tests to find the ,optimum Iocation<br />
for the miaophone.<br />
3. Make a Itest drive with the vehicle<br />
piloted by a qualified subjective rater<br />
and an instrument It,echni.cianto<br />
operate the RTAandadjust it to optimize<br />
the display to relate to the subjective<br />
rater.<br />
Ra·S<br />
OEAR NOISE<br />
4. Set the analyzer to operate ~n Mode<br />
Ito detect the peak noise frequencies<br />
at different vehicle speeds er Mode II<br />
to detect the resonant frequencies of<br />
the structure.<br />
S. Mode I setup-Peak noise<br />
mquencies<br />
Sound Pressure<br />
Level Meter<br />
RTA Frequency<br />
Range<br />
Voltage Scale Y<br />
Axis Oog)<br />
A Weighted<br />
o to .2000 Hz (1)<br />
o to 10 volts RMS<br />
Input<br />
A Weighted (2)<br />
RMS exponential<br />
averaging (3 or 4 averages)<br />
CQr50r identifying "peak" amplitude<br />
NOTES:<br />
(a) .Frequency range will vary accordins:<br />
to application.<br />
(b) This results in an unconventional<br />
"double A" weighting. This is in<br />
order to enhance data in relation<br />
to what the ear is hearing and<br />
could be done by the use of other<br />
high and low pass .filters.<br />
6. Operate the vehicle ,at a speed and<br />
condition that allows the driver to<br />
hear gear noise. Then change vehicle<br />
speed and load conditions up and<br />
down through this noise period. The<br />
noise should change in amplitude or<br />
come and ge, While Ithe driver is<br />
doing this, the instrumentation<br />
operater can. observe whi.ch peak in<br />
'the frequency spectrum is varying in<br />
relation to what the driver is he.aring,<br />
The C1Lrsor on theSCl1een wil1 indicate<br />
the fr1!quen.cy of in'terest. The &1!-<br />
quency and RPM should be wnt'ten<br />
In a. test log. Tape recordings can be<br />
made, and the data 'on the RTA<br />
screen can best.ored iin bubble<br />
memory for plotting, at a later time.<br />
The vehicle can theabe driven. at any<br />
other speed of interest ,and the test<br />
procedure repeated.<br />
7. If desired, run the test ina. slJghtly diJfe:rent<br />
manner. The vehicle can be<br />
accelerated or decelerated throughout<br />
at broad speed range. The RTA screen<br />
is observed throu,ghout the test. Th<br />
cursor wiD automatically shift loth<br />
highest noise level at any given peed.<br />
The frequency of the curser location<br />
would be noted, on the "f1y" and may<br />
peak at one, two or several frequencies<br />
throughout the speed range.<br />
S. Mode II setup - Structural<br />
resonances<br />
The setup for Mode n ,operation is<br />
the same as for Mode I, ,except for<br />
the cursor operation. The 'cursor<br />
should now be set for "peak hold"<br />
mode. The test would be run as<br />
described in Step 7. At the end of<br />
an aceeleratlon all'deceleration run,<br />
the display is held (pause) and<br />
stored in bubble memozy or analyzed<br />
10·11' peak frequencies. The<br />
As. 6<br />
.Januarv/~ru.ary 1988 ,411