trade apprenticeship training in india - Directorate General of ...
trade apprenticeship training in india - Directorate General of ...
trade apprenticeship training in india - Directorate General of ...

You also want an ePaper? Increase the reach of your titles
YUMPU automatically turns print PDFs into web optimized ePapers that Google loves.
TRADE APPRENTICESHIP TRAINING IN<br />
INDIA<br />
(AS ON 31.12.2006)<br />
UNDER<br />
APPRENTICESHIP TRAINING SCHEME<br />
GOVERNMENT OF INDIA<br />
MINISTRY OF LABOUR & EMPLOYMENT<br />
DIRECTORATE GENERAL OF EMPLOYMENT & TRAINING<br />
SURVEY & STUDY DIVISION<br />
3/10, JAM NAGAR HOUSE<br />
NEW DELHI<br />
NOVEMBER, 2009
P R E F A C E<br />
This publication is the eleventh <strong>in</strong> its series and reflects an attempt towards creat<strong>in</strong>g a<br />
reliable database for plann<strong>in</strong>g and tak<strong>in</strong>g corrective action <strong>in</strong> <strong>apprenticeship</strong> <strong>tra<strong>in</strong><strong>in</strong>g</strong> under<br />
the Apprentices Act, 1961. This publication presents statistics on establishments engaged <strong>in</strong><br />
<strong>apprenticeship</strong> <strong>tra<strong>in</strong><strong>in</strong>g</strong>, <strong>in</strong>take capacity, output and their employability <strong>in</strong> the labour market<br />
alongwith a brief analysis <strong>of</strong> the current status <strong>of</strong> the scheme. Further, attempts have been<br />
made to <strong>in</strong>clude <strong>in</strong>formation on stipend to apprentices, participation <strong>of</strong> SC/ST <strong>in</strong> the<br />
<strong>apprenticeship</strong> programme with overall view <strong>of</strong> <strong>apprenticeship</strong> scheme <strong>in</strong> India besides other<br />
related <strong>in</strong>formation. I hope that this publication will be useful not only to the planners but<br />
also to the employers, employees, jobs seekers and workers.<br />
The data presented <strong>in</strong> this publication has been collected through the network <strong>of</strong> State<br />
Apprenticeship Advisors (SAAs) and Regional Directors <strong>of</strong> Apprenticeship Tra<strong>in</strong><strong>in</strong>g<br />
(RDATs). The cooperation extended by them <strong>in</strong> provid<strong>in</strong>g <strong>in</strong>formation has been<br />
commendable and is hereby acknowledged.<br />
I also place on record my s<strong>in</strong>cere appreciation <strong>of</strong> the work done by Shri K.S. Meena,<br />
Director <strong>of</strong> Employment Exchanges and Shri A.S. Khan, Jo<strong>in</strong>t Director <strong>of</strong> Employment<br />
Exchanges under overall supervision and guidance <strong>of</strong> Smt. Amarjeet Kaur, Deputy Director<br />
<strong>General</strong> (Employment).<br />
Dated: 19 th November, 2009<br />
(SHARDA PRASAD)<br />
DIRECTOR GENERAL OF EMPLOYMENT & TRAINING/<br />
JOINT SECRETARY
STUDY TEAM<br />
1. Smt. Amarjeet Kaur Deputy Director <strong>General</strong> (Employment)<br />
2. Sh. K.S. Meena Director <strong>of</strong> Employment Exchanges<br />
3. Sh. A.S. Khan Jo<strong>in</strong>t Director <strong>of</strong> Employment Exchanges<br />
4. Sh. M.R. S<strong>in</strong>dhwani Dy. Director <strong>of</strong> Employment Exchanges<br />
5. Sh. Chandra Bhanu Senior Statistical Officer<br />
6. Sh. R.V. Sakhare Assistant Employment Officer<br />
7. Sh Gopal Krishan Junior Investigator<br />
Computer Assistance<br />
Smt. Ranjana<br />
Junior Computor<br />
(i)
S. No CONTENTS PAGE NO.<br />
1. Introduction 1<br />
2. Aims & Objectives 1-2<br />
3. Evolution <strong>of</strong> Apprenticeship Tra<strong>in</strong><strong>in</strong>g Scheme 2<br />
4. Coverage 2-3<br />
5. Implementation <strong>of</strong> the Act 3<br />
6. Central Apprenticeship Council 3<br />
7. Test<strong>in</strong>g & Certifications <strong>of</strong> Trade Apprentices 3<br />
8. Stipend dur<strong>in</strong>g Apprenticeship Tra<strong>in</strong><strong>in</strong>g 4<br />
9. Response Position 4<br />
10. Overall Apprenticeship Tra<strong>in</strong><strong>in</strong>g <strong>in</strong> India 5<br />
11. Overall Trade Apprenticeship Tra<strong>in</strong><strong>in</strong>g 5-9<br />
12. Performance <strong>of</strong> the Apprentices <strong>in</strong> Trade Tests/Exam<strong>in</strong>ations 9<br />
13. Trade Apprenticeship <strong>in</strong> Central Sector 9-10<br />
14. Trade Apprenticeship <strong>in</strong> the State/Private Sector 10-11<br />
15. Trade-wise Apprenticeship Tra<strong>in</strong><strong>in</strong>g 11<br />
16. Trades with no Enrolment 11<br />
17. Trades with only Freshers Enrolment 12<br />
18. Trades with only ITI pass Enrolment 12<br />
19. Revised eligibility criteria 12<br />
20. Introduction <strong>of</strong> New Trades 12<br />
21. Participation <strong>of</strong> SC/STs <strong>in</strong> the Apprenticeship Tra<strong>in</strong><strong>in</strong>g Scheme 13<br />
22. Employment & Unemployment <strong>of</strong> Apprenticeship Tra<strong>in</strong>ees 13<br />
23. Placement <strong>of</strong> Apprentices with Tra<strong>in</strong><strong>in</strong>g Employers 13<br />
ANNEXURES<br />
I. Statement show<strong>in</strong>g State-wise number <strong>of</strong> establishments hav<strong>in</strong>g<br />
<strong>tra<strong>in</strong><strong>in</strong>g</strong> facilities as on 31.12.2006 under the Apprenticeship Tra<strong>in</strong><strong>in</strong>g<br />
Scheme.<br />
II.<br />
III.<br />
IV.<br />
Statement show<strong>in</strong>g State-wise number <strong>of</strong> establishments actually<br />
engag<strong>in</strong>g Apprentices as on 31.12.2006 under the Apprenticeship<br />
Tra<strong>in</strong><strong>in</strong>g Scheme.<br />
Statement show<strong>in</strong>g State-wise <strong>in</strong>take capacity and Apprentices<br />
undergo<strong>in</strong>g <strong>tra<strong>in</strong><strong>in</strong>g</strong> as on 31.12.2006 under the Apprenticeship<br />
Tra<strong>in</strong><strong>in</strong>g Scheme.<br />
Statement show<strong>in</strong>g State-wise number <strong>of</strong> Scheduled Caste and<br />
Scheduled Tribe Apprentices undergo<strong>in</strong>g <strong>tra<strong>in</strong><strong>in</strong>g</strong> as on 31.12.2006<br />
under the Apprenticeship Tra<strong>in</strong><strong>in</strong>g Scheme.<br />
V. Statement show<strong>in</strong>g State-wise number <strong>of</strong> Fresher and NTC holder<br />
Apprentices undergo<strong>in</strong>g <strong>tra<strong>in</strong><strong>in</strong>g</strong> as on 31.12.2006 under the<br />
Apprenticeship Tra<strong>in</strong><strong>in</strong>g Scheme.<br />
VI.<br />
Statement show<strong>in</strong>g State-wise number <strong>of</strong> Apprentices appeared and<br />
passed out <strong>in</strong> the <strong>trade</strong> test held <strong>in</strong> June, 2006 under the Apprenticeship<br />
Tra<strong>in</strong><strong>in</strong>g Scheme.<br />
(ii)<br />
14<br />
15<br />
16<br />
17<br />
18<br />
19
VII.<br />
VIII.<br />
IX.<br />
X<br />
XI.<br />
XII.<br />
XIII.<br />
XIV.<br />
XV.<br />
Statement show<strong>in</strong>g State-wise number <strong>of</strong> Apprentices appeared and<br />
passed out <strong>in</strong> the <strong>trade</strong> test held <strong>in</strong> December, 2006 under the<br />
Apprenticeship Tra<strong>in</strong><strong>in</strong>g Scheme.<br />
Statement show<strong>in</strong>g State-wise number <strong>of</strong> Apprentices appeared,<br />
passed-out and Employed by the same Employer, <strong>in</strong> the <strong>trade</strong> tests held<br />
dur<strong>in</strong>g 2006 under the Apprenticeship Tra<strong>in</strong><strong>in</strong>g Scheme.<br />
Statement show<strong>in</strong>g <strong>trade</strong>-wise number <strong>of</strong> workers other than unskilled<br />
workers, <strong>in</strong>take capacity and no. <strong>of</strong> Apprentices undergo<strong>in</strong>g <strong>tra<strong>in</strong><strong>in</strong>g</strong> as<br />
freshers and ITI passed out dur<strong>in</strong>g the year 2006 under the<br />
Apprenticeship Tra<strong>in</strong><strong>in</strong>g Scheme.<br />
Statement show<strong>in</strong>g State-wise participation ratio <strong>of</strong> SC/ST Apprentices<br />
undergo<strong>in</strong>g <strong>tra<strong>in</strong><strong>in</strong>g</strong> as on 31.12.2006 under the Apprenticeship<br />
Tra<strong>in</strong><strong>in</strong>g Scheme.<br />
Statement show<strong>in</strong>g number <strong>of</strong> NTC holder and Non NTC holder<br />
Apprentices tra<strong>in</strong>ed under the Apprentices Act on the Live Register as<br />
on 31.12.2006 together with their number placed <strong>in</strong> Employment<br />
dur<strong>in</strong>g January-December 2006.<br />
Statement show<strong>in</strong>g number <strong>of</strong> NTC holder and Non NTC holder<br />
Apprentices registered and placed through Employment Exchanges-All<br />
India 1986-2006.<br />
Schedule for submission <strong>of</strong> half yearly return end<strong>in</strong>g June & December<br />
to be furnished by RDATs/SAAs<br />
(ATS-1)<br />
Schedule for submission <strong>of</strong> half yearly return end<strong>in</strong>g June & December<br />
compris<strong>in</strong>g number <strong>of</strong> estts., engaged Apprentices, seats<br />
located/Apprentices on roll. (for RDAT only)<br />
(ATS-2)<br />
Schedule for submission <strong>of</strong> half yearly return compris<strong>in</strong>g<br />
sector/number <strong>of</strong> estts. Apprentices engaged, seats located, Apprentices<br />
on roll. (for State/Public Sector/Private Sector only)<br />
(ATS-3)<br />
20<br />
21<br />
22-25<br />
26<br />
27<br />
28<br />
29-30<br />
31-32<br />
33-34<br />
(iii)
SALIENT FEATURES/FINDINGS<br />
The report is eleventh <strong>in</strong> its series and has been prepared on the basis <strong>of</strong> data collected through<br />
revised ATS-1to 3 returns <strong>in</strong>stead <strong>of</strong> ATS I to VI from Regional <strong>Directorate</strong>s <strong>of</strong> Apprenticeship<br />
Tra<strong>in</strong><strong>in</strong>g/State Apprenticeship Advisers. 254 groups <strong>of</strong> <strong>in</strong>dustries, compris<strong>in</strong>g 153 designated<br />
<strong>trade</strong>s have been <strong>in</strong>cluded <strong>in</strong> the study.<br />
OVERALL TRADE APPRENTICESHIP TRAINING<br />
• Overall 1,85,407 apprentices were on roll <strong>of</strong> 27,099 establishments whereas <strong>in</strong>take<br />
capacity was 2,60,927 <strong>in</strong> 30,990 establishments.<br />
• There has been rise <strong>in</strong> overall <strong>trade</strong> <strong>apprenticeship</strong> <strong>tra<strong>in</strong><strong>in</strong>g</strong> <strong>in</strong> terms <strong>of</strong> number <strong>of</strong><br />
establishments hav<strong>in</strong>g <strong>tra<strong>in</strong><strong>in</strong>g</strong> facilities, establishments engag<strong>in</strong>g apprentices, <strong>in</strong>take<br />
capacity and number <strong>of</strong> apprentices on roll by 2465, 7792, 35843 & 22562 respectively <strong>in</strong><br />
the year 2006 over 2000. This <strong>in</strong>crease varies from 3% to 26%. The rise <strong>of</strong> 26% is<br />
registered <strong>in</strong> the apprentices engaged by establishments.<br />
• Utilization <strong>of</strong> seats was <strong>of</strong> the order <strong>of</strong> 71% dur<strong>in</strong>g 2006 as compared to 68% dur<strong>in</strong>g 2005<br />
<strong>in</strong> case <strong>of</strong> establishments hav<strong>in</strong>g <strong>tra<strong>in</strong><strong>in</strong>g</strong> facilities.<br />
• There has been <strong>in</strong>crease <strong>in</strong> number <strong>of</strong> SC/ST apprentices.<br />
APPRENTICESHIP IN CENTRAL SECTOR<br />
• There has been 2% rise <strong>in</strong> number <strong>of</strong> establishments hav<strong>in</strong>g <strong>tra<strong>in</strong><strong>in</strong>g</strong> facilities. The<br />
number was 778 <strong>in</strong> 2006 as compared to 760 <strong>in</strong> 2005.<br />
• Participation rate <strong>of</strong> establishments dur<strong>in</strong>g 2006 was 76%.<br />
• Utilization <strong>of</strong> capacity was <strong>of</strong> the order <strong>of</strong> 87%.<br />
• The percentage <strong>of</strong> successful apprentices was 53% <strong>in</strong> June, 2006 and 57% <strong>in</strong><br />
November/December, 2006 <strong>trade</strong> tests respectively.<br />
• Maximum number <strong>of</strong> establishments hav<strong>in</strong>g <strong>tra<strong>in</strong><strong>in</strong>g</strong> facilities was <strong>in</strong> Maharashtra (76)<br />
followed by Tamil Nadu (67), West Bengal (70), U.P. (58), etc.<br />
(iv)
• Union Territories <strong>of</strong> Dadra & Nagar Haveli, Daman & Diu did not have any establishment<br />
with <strong>apprenticeship</strong> <strong>tra<strong>in</strong><strong>in</strong>g</strong> facilities whereas <strong>in</strong> the States/Union Territories <strong>of</strong><br />
Arunachal Pradesh, Goa, Himachal Pradesh, J&K, Manipur, Meghalaya,<br />
Mizoram,Nagaland, Tripura, Andaman & Nicobar, Chandigarh and Puducherry had less<br />
than ten establishments with <strong>apprenticeship</strong> <strong>tra<strong>in</strong><strong>in</strong>g</strong> facilities.<br />
APPRENTICESHIP IN STATE/PRIVATE SECTOR<br />
• There was 16.47% decrease <strong>in</strong> number <strong>of</strong> establishments hav<strong>in</strong>g <strong>tra<strong>in</strong><strong>in</strong>g</strong> facilities over the<br />
previous year.<br />
• Participation <strong>of</strong> establishments was around 88%.<br />
• Utilization <strong>of</strong> capacity was around 69%.<br />
• Percentage <strong>of</strong> successful apprentices was 43% <strong>in</strong> June, 2006 and 53% <strong>in</strong><br />
November/December, 2006 <strong>in</strong> the <strong>trade</strong> tests held by NCVT.<br />
• Maximum number <strong>of</strong> establishments hav<strong>in</strong>g <strong>tra<strong>in</strong><strong>in</strong>g</strong> facilities were <strong>in</strong> Maharashtra<br />
(6812), Uttar Pradesh (4343), Gujarat (3821), Tamil Nadu (2164), Haryana (1894), Delhi<br />
(1527), Andhra Pradesh (1441), Kerala (1305) followed by Karnataka (1209) etc.<br />
• States/Union Territories <strong>of</strong> Meghalaya and Mizoram had no establishment with<br />
<strong>apprenticeship</strong> <strong>tra<strong>in</strong><strong>in</strong>g</strong> facility whereas <strong>in</strong> States/UTs <strong>of</strong> Arunachal Pradesh, Manipur,<br />
Nagaland, Tripura, Andaman & Nicobar, Chandigarh and Dadra & Nagar Haveli the<br />
number <strong>of</strong> such establishments was less than 40.<br />
TRADE-WISE APPRENTICESHIP TRAINING<br />
• Most popular <strong>trade</strong> amongst apprentices was Fitter <strong>trade</strong> with 36,146 apprentices followed<br />
by Electrician-22,149; Mechanic Motor Vehicle-14,533; L<strong>in</strong>eman-10,744; Welder Gas &<br />
Electric-10,529; Turner-9,696; Mechanic Diesel-9,478; Electronic Mechanic – 6,785;<br />
Wireman -4,629; Boiler Attendant -3,346; etc.<br />
• In three <strong>trade</strong>s viz;(i) Sports Goods Maker (Woods), (ii) Construction Mach<strong>in</strong>ery<br />
Mechanic-cum-Operator, (iii) Sports Goods Maker (Leather) and (iv) Fibre Re<strong>in</strong>forced<br />
Plastic Processor, there were neither <strong>in</strong>take capacity nor enrolment <strong>of</strong> apprentices.<br />
(v)
• In the follow<strong>in</strong>g seven <strong>trade</strong>s <strong>in</strong>take capacity existed whereas enrolment was NIL: -<br />
1. Mechanic Sew<strong>in</strong>g Mach<strong>in</strong>e 5. Brick layer (Refractory)<br />
2. Plastic Mould Maker 6. Steel Melt<strong>in</strong>g Hand<br />
3. Mono Caster Operator 7. Mono Key Board Operator<br />
4. Mechanic Medical Equipment for Hospitals<br />
& Occupation Health Centres<br />
EMPLOYMENT OF TRADE APPRENTICES<br />
• Dur<strong>in</strong>g 2006, 10,699 apprentices were placed <strong>in</strong> jobs through Employment Exchanges as<br />
aga<strong>in</strong>st 7,849 <strong>in</strong> 2005.<br />
• The placement <strong>of</strong> NTC holder apprentices to their Live Register was 0.75% and those <strong>of</strong><br />
non NTC holder apprentices were 0.7%.<br />
• There had been 1% rise <strong>in</strong> number <strong>of</strong> unemployed apprentices <strong>in</strong> the year 2006 over the<br />
previous year.<br />
• 3504 apprentices had been placed with the same employers where they took<br />
<strong>apprenticeship</strong> <strong>tra<strong>in</strong><strong>in</strong>g</strong>.<br />
• Information on Apprenticeship Tra<strong>in</strong><strong>in</strong>g Scheme may be seen on DGE&T website:<br />
www.dget.nic.<strong>in</strong>.<br />
(vi)
INTRODUCTION<br />
The Indian economy was <strong>in</strong> the mode <strong>of</strong> globalization and liberalization. But global<br />
f<strong>in</strong>ancial melt down and consequent economic recession <strong>in</strong> developed economies have clearly<br />
been a major factor <strong>in</strong> India’s economic slow down. Given the orig<strong>in</strong> and dimension <strong>of</strong> the crisis<br />
<strong>in</strong> advanced countries, every develop<strong>in</strong>g country has suffered to a vary<strong>in</strong>g degree. No country,<br />
<strong>in</strong>clud<strong>in</strong>g India, rema<strong>in</strong>ed immune to the global economic shock. Dur<strong>in</strong>g such economic situation<br />
many macro economic <strong>in</strong>dicators vary and have direct and <strong>in</strong>direct effect on employment,<br />
<strong>in</strong>vestment spend<strong>in</strong>g, capacity utilization, household <strong>in</strong>comes and bus<strong>in</strong>ess pr<strong>of</strong>its. Govt. <strong>of</strong> India<br />
has taken various <strong>in</strong>itiatives adopt<strong>in</strong>g expansionary macroeconomic policies and positive sign<br />
emerged <strong>in</strong> the Indian economy.<br />
The Eleventh Five Year Plan envisages greater employment opportunities than estimated<br />
<strong>in</strong>crease <strong>in</strong> the labour force result<strong>in</strong>g <strong>in</strong> reduction <strong>in</strong> unemployment rate. It is expected that<br />
agriculture sector may not contribute towards any <strong>in</strong>crease <strong>in</strong> employment. Hence, employment<br />
generation strategy is based on reduction <strong>in</strong> under employment and movement <strong>of</strong> surplus labour <strong>in</strong><br />
agriculture sector to higher wages and more ga<strong>in</strong>ful employment <strong>in</strong> non-agriculture sector. The<br />
Eleventh Five Year Plan has especially identified labour <strong>in</strong>tensive manufactur<strong>in</strong>g and services<br />
sectors with employment potential like food process<strong>in</strong>g, leather products, footwear, textiles, wood<br />
& bamboo products, gem & jewellery, handicrafts, handlooms, tourism and construction for this<br />
purpose. This change warrants a shift <strong>in</strong> emphasis <strong>in</strong> management philosophy with the high<br />
potential for multidiscipl<strong>in</strong>e tra<strong>in</strong>ed manpower.<br />
Keep<strong>in</strong>g <strong>in</strong> view, change <strong>in</strong> the world <strong>of</strong> work, there appears to be shift from unilateral to<br />
multilateral talent/tra<strong>in</strong>ed manpower. Also cost cutt<strong>in</strong>g and down siz<strong>in</strong>g approaches put emphasis<br />
from mono skills to multi tasks. Skill <strong>tra<strong>in</strong><strong>in</strong>g</strong> consist<strong>in</strong>g <strong>of</strong> <strong>apprenticeship</strong> <strong>tra<strong>in</strong><strong>in</strong>g</strong> too with Skill<br />
Development Initiative may play a vital role <strong>in</strong> develop<strong>in</strong>g multi skilled manpower.<br />
AIMS & OBJECTIVES<br />
In the Eleventh Five Year Plan, the thrust will be on creat<strong>in</strong>g a pool <strong>of</strong> skilled personnel<br />
<strong>in</strong> appropriate numbers with adequate skills, <strong>in</strong> consonance with the requirements <strong>of</strong> the ultimate<br />
users such as the <strong>in</strong>dustry <strong>trade</strong> and service sectors. Such an effort is necessary to support the<br />
employment expansion envisaged as a result <strong>of</strong> <strong>in</strong>clusive growth <strong>in</strong>clud<strong>in</strong>g <strong>in</strong> particular the shift<br />
<strong>of</strong> surplus labour from agriculture to non agriculture. A comprehensive skill development<br />
programme with wide coverage throughout the country has already been <strong>in</strong>itiated by the<br />
government.<br />
1
In general, it is <strong>of</strong>ten felt that <strong>in</strong>stitutionally tra<strong>in</strong>ed have no desired result because <strong>tra<strong>in</strong><strong>in</strong>g</strong><br />
imparted <strong>in</strong> <strong>in</strong>stitutions alone is not enough for acquisition <strong>of</strong> skills and needs to be supplemented<br />
by <strong>tra<strong>in</strong><strong>in</strong>g</strong> <strong>in</strong> the actual world <strong>of</strong> work. For facilitat<strong>in</strong>g <strong>tra<strong>in</strong><strong>in</strong>g</strong> and <strong>in</strong>creas<strong>in</strong>g employability <strong>of</strong><br />
the job seekers <strong>in</strong> the <strong>in</strong>dustrial/non-<strong>in</strong>dustrial establishments, the Apprentices Act, 1961 was<br />
enacted with the follow<strong>in</strong>g objectives: -<br />
(I)<br />
(II)<br />
To regulate the programme <strong>of</strong> <strong>tra<strong>in</strong><strong>in</strong>g</strong> <strong>of</strong> apprentices <strong>in</strong> the <strong>in</strong>dustry so as to<br />
conform to the prescribed syllabi, period <strong>of</strong> <strong>tra<strong>in</strong><strong>in</strong>g</strong> etc., as laid down by the<br />
Central Apprenticeship Council; and<br />
To utilise fully the facilities available <strong>in</strong> <strong>in</strong>dustry for impart<strong>in</strong>g practical <strong>tra<strong>in</strong><strong>in</strong>g</strong><br />
with a view to meet the requirements <strong>of</strong> skilled manpower for <strong>in</strong>dustry.<br />
EVOLUTION OF APPRENTICESHIP SCHEME<br />
The National Apprenticeship Scheme was launched <strong>in</strong> 1959, <strong>in</strong>itially on voluntary basis.<br />
The Apprentices Act 1961 came <strong>in</strong>to force on March 1, 1962. In the beg<strong>in</strong>n<strong>in</strong>g, the Act envisaged<br />
<strong>tra<strong>in</strong><strong>in</strong>g</strong> <strong>of</strong> <strong>trade</strong> apprentices. The <strong>tra<strong>in</strong><strong>in</strong>g</strong> <strong>of</strong> Graduates and Diploma Holders <strong>in</strong> Eng<strong>in</strong>eer<strong>in</strong>g and<br />
Technology as Graduate and Technician Apprentices was brought with<strong>in</strong> the purview <strong>of</strong> the Act<br />
through an amendment <strong>in</strong> 1973. The Apprentices Act was, further, amended <strong>in</strong> 1986 to br<strong>in</strong>g<br />
with<strong>in</strong> its purview the <strong>tra<strong>in</strong><strong>in</strong>g</strong> <strong>of</strong> students pass<strong>in</strong>g out <strong>of</strong> the (10+2) vocational stream as<br />
Technician (Vocational) Apprentices. The <strong>tra<strong>in</strong><strong>in</strong>g</strong> <strong>of</strong> this category <strong>of</strong> apprentices commenced <strong>in</strong><br />
terms <strong>of</strong> the requisite Rules notified by the Government <strong>in</strong> October, 1987.<br />
COVERAGE<br />
The Apprentices Act makes it obligatory on the part <strong>of</strong> employers both <strong>in</strong> public and<br />
private sector <strong>in</strong>dustries to engage <strong>trade</strong> apprentices accord<strong>in</strong>g to the ratio <strong>of</strong> apprentices to<br />
workers other than unskilled workers <strong>in</strong> designated <strong>trade</strong>s prescribed under the Rules. In order to<br />
locate facilities for <strong>apprenticeship</strong> <strong>tra<strong>in</strong><strong>in</strong>g</strong>, the <strong>tra<strong>in</strong><strong>in</strong>g</strong> places are located on the basis <strong>of</strong> the<br />
f<strong>in</strong>d<strong>in</strong>gs <strong>of</strong> surveys conducted <strong>in</strong> the <strong>in</strong>dustrial establishments. The duration <strong>of</strong> <strong>tra<strong>in</strong><strong>in</strong>g</strong> for <strong>trade</strong><br />
apprentices varies from six months to four years depend<strong>in</strong>g upon the requirements <strong>of</strong> the specified<br />
<strong>trade</strong>. The syllabi for different <strong>trade</strong>s are prepared and f<strong>in</strong>alized by the respective Trade<br />
Committees compris<strong>in</strong>g <strong>trade</strong> experts from <strong>in</strong>dustry. The engagement <strong>of</strong> apprentices is done<br />
2
throughout the year. Trade Test for apprentices is also held twice a year. It covers employers<br />
both <strong>in</strong> Public & Private Sector establishments hav<strong>in</strong>g requisite <strong>tra<strong>in</strong><strong>in</strong>g</strong> <strong>in</strong>frastructure as laid<br />
down <strong>in</strong> the Act to engage apprentices. 254 groups <strong>of</strong> <strong>in</strong>dustries are covered under the<br />
Apprentices Act.<br />
IMPLEMENTATION OF THE ACT<br />
The responsibility for implement<strong>in</strong>g the Apprentices Act, 1961 <strong>in</strong> respect <strong>of</strong> Trade<br />
Apprentices <strong>in</strong> Central Government Establishments/Departments rests with the Central<br />
Apprenticeship Adviser/Director <strong>of</strong> Apprenticeship Tra<strong>in</strong><strong>in</strong>g <strong>in</strong> the DGE&T, M<strong>in</strong>istry <strong>of</strong> Labour<br />
and Employment with the assistance <strong>of</strong> six Regional <strong>Directorate</strong>s <strong>of</strong> Apprenticeship<br />
Tra<strong>in</strong><strong>in</strong>g (RDATs) at Chennai, Faridabad, Hyderabad, Kanpur, Kolkata and Mumbai. State<br />
Apprenticeship Advisers are responsible for implementation <strong>of</strong> the Act <strong>in</strong> respect <strong>of</strong> Trade<br />
Apprentices <strong>in</strong> State Govt. Undertak<strong>in</strong>gs/Departments and Private Establishments. The <strong>tra<strong>in</strong><strong>in</strong>g</strong><br />
programme for Graduate Eng<strong>in</strong>eers, Diploma Holders and Technician (Vocational) apprentices is<br />
controlled by four Regional Board <strong>of</strong> Apprenticeship Tra<strong>in</strong><strong>in</strong>g (BOATs), which are autonomous<br />
bodies under the Department <strong>of</strong> Secondary & Higher Education, M<strong>in</strong>istry <strong>of</strong> Human Resource<br />
Development.<br />
CENTRAL APPRENTICESHIP COUNCIL<br />
Central Apprenticeship Council is an apex statutory body to advise the Government on<br />
lay<strong>in</strong>g down <strong>of</strong> policies and prescrib<strong>in</strong>g norms and standards <strong>in</strong> respect <strong>of</strong> Apprenticeship<br />
Tra<strong>in</strong><strong>in</strong>g Scheme. It is tripartite by constitution with members from Governments both Central<br />
and State/UTs., Employers & Trade Unions.<br />
TESTING & CERTIFICATION OF TRADE APPRENTICES<br />
All India Trade Tests (AITTs) for <strong>trade</strong> apprentices are conducted by National Council <strong>of</strong><br />
Vocational Tra<strong>in</strong><strong>in</strong>g (NCVT) twice a year i.e. <strong>in</strong> April/May and October/November. National<br />
Apprenticeship Certificates (NACs) are awarded to candidates by NCVT who pass the AITT.<br />
NACs are recognized for employment under Government, Semi-Government<br />
Departments/Organisations.<br />
3
STIPEND DURING APPRENTICESHIP TRAINING<br />
Rates <strong>of</strong> stipend paid to various apprentices are described below. These rates <strong>of</strong> stipend<br />
are revised every two years based on Consumer Price Index.<br />
(1) The rates <strong>of</strong> stipend payable w.e.f. 21.03.2007 to <strong>trade</strong> apprentices are as follows: -<br />
(a) Dur<strong>in</strong>g First Year <strong>of</strong> Tra<strong>in</strong><strong>in</strong>g Rs. 1090/- per month.<br />
(b) Dur<strong>in</strong>g Second Year <strong>of</strong> Tra<strong>in</strong><strong>in</strong>g Rs. 1240/- per month<br />
(c) Dur<strong>in</strong>g Third Year <strong>of</strong> Tra<strong>in</strong><strong>in</strong>g Rs. 1,440/- per month<br />
(d) Dur<strong>in</strong>g Fourth Year <strong>of</strong> Tra<strong>in</strong><strong>in</strong>g Rs. 1,620/- per month<br />
Note: - Substituted by GSR 214 (E) dated 21 st March, 2007.<br />
The expenditure on stipend for <strong>trade</strong> apprentices is borne by the employers.<br />
(2) The rates <strong>of</strong> stipend payable to Graduate, Technician and Technician (Vocational)<br />
apprentices w.e.f. 7 th January, 2008 are as follows: -<br />
(a) Graduate apprentices Rs. 2,600/- per month.<br />
(b) Sandwich course Rs. 1,850/- per month<br />
(Students from degree <strong>in</strong>stitutions)<br />
(c) Technician apprentices Rs. 1,850/- per month<br />
(d) Sandwich course Rs. 1,510/- per month<br />
(Students from diploma <strong>in</strong>stitutions)<br />
(e) Technician (vocational) apprentices Rs. 1,440/- per month.<br />
Note: - Substituted vide GSR 17 (E) dated 7 th January, 2008.<br />
Expenditure on stipend for the categories <strong>of</strong> Graduate, Technician & Technician<br />
(Vocational) apprentices is shared equally between employers and the Central<br />
Government.<br />
RESPONSE POSITION<br />
Statistics on <strong>trade</strong> apprentices are collected through Regional Directors <strong>of</strong> Apprenticeship<br />
Tra<strong>in</strong><strong>in</strong>g and State Apprenticeship Advisers <strong>of</strong> various States/ UTs through returns. Upto<br />
31.03.2004, <strong>in</strong>formation was collected through ATS 1 to ATS-6 returns. Now, for the current<br />
year, <strong>in</strong>formation has been collected through revised half yearly returns ATS 1 to ATS-3. These<br />
revised returns have been published <strong>in</strong> Gazette <strong>of</strong> India for implementation. The data presented<br />
<strong>in</strong> this publication relates to the period as on 31 st December, 2006. The response rate was <strong>of</strong> the<br />
order <strong>of</strong> 100% <strong>in</strong> case <strong>of</strong> Central Sector and 64% <strong>in</strong> case <strong>of</strong> State/Private Sector.<br />
4
OVERALL VIEW OF APPRENTICESHIP TRAINING<br />
As already po<strong>in</strong>ted out that overall <strong>apprenticeship</strong> <strong>tra<strong>in</strong><strong>in</strong>g</strong> comprises <strong>of</strong> both (i) Trade<br />
Apprenticeship Tra<strong>in</strong><strong>in</strong>g Scheme and (ii) Graduate, Technician and Technician (Vocational)<br />
Apprenticeship Tra<strong>in</strong><strong>in</strong>g Scheme. Under Trade Apprenticeship Tra<strong>in</strong><strong>in</strong>g Scheme 153 <strong>trade</strong>s have<br />
been covered whereas <strong>in</strong> Graduate, Technical and Technician (Vocational) Scheme 103 subject<br />
fields have been designated for the category <strong>of</strong> Graduate & Technician Apprentices and 95 subject<br />
fields have been designated for the category <strong>of</strong> Technician (Vocational) Apprentices. An overall<br />
view is presented <strong>in</strong> Table-1: -<br />
TABLE- 1<br />
OVERALL APPRENTICESHIP TRAINING IN INDIA<br />
Items<br />
1. Intake capacity<br />
(No. <strong>of</strong> seats located)<br />
2. No. <strong>of</strong> apprentices on roll<br />
(No. <strong>of</strong> seats utilized)<br />
Trade<br />
Apprentices<br />
AS ON 31 ST DECEMBER, 2006<br />
Graduate, Tech.<br />
(Vocational)<br />
Apprentices*<br />
Overall<br />
Apprentices<br />
2,60,927 87,101 3,48,028<br />
1,85,407 35,400 2,20,807<br />
3. Percentage utilization 71.05% 40.64% 63.45%<br />
4. Out <strong>of</strong> total seats utilized<br />
(i) Scheduled Castes (SC)<br />
(ii). Scheduled Tribes (ST)<br />
20,142<br />
(10.87%)<br />
15,314<br />
(8.26%)<br />
3,312<br />
(9.36%)<br />
424<br />
(1.20%)<br />
23,454<br />
(10.62%)<br />
15,738<br />
(7.12%)<br />
Source: - * M<strong>in</strong>istry <strong>of</strong> HRD<br />
The above table depicts that <strong>in</strong>take capacity <strong>of</strong> <strong>trade</strong> apprentices is more or less thrice <strong>of</strong><br />
<strong>in</strong>take capacity for Graduate, Technician and Technician (Vocational) apprentices whereas it is<br />
more than five times <strong>in</strong> its utilization capacity. Participation rate was 71% <strong>in</strong> Trade Apprentices<br />
and it was 41% <strong>in</strong> Graduate, Technician and Technician (Vocational) Apprentices respectively.<br />
On the whole, it was around 63%. Further, the share <strong>of</strong> SC/STs, <strong>in</strong> utilized seats was 19% <strong>in</strong><br />
Trade Apprentices whereas it stood at 11% <strong>in</strong> case <strong>of</strong> Graduate, Technician and Technician<br />
(Vocational) Apprentices. The overall share <strong>of</strong> SC/ST <strong>in</strong> the utilized seats was <strong>of</strong> order <strong>of</strong> around<br />
18%.<br />
5
OVERALL TRADE APPRENTICESHIP TRAINING<br />
As on 31 st December, 2006, the <strong>apprenticeship</strong> <strong>tra<strong>in</strong><strong>in</strong>g</strong> facilities were available <strong>in</strong> 30,990<br />
establishments. 778 establishments <strong>in</strong> Central Sector and 30,212 <strong>in</strong> State/Private Sector. Table-2<br />
depicts the comparative scenario <strong>of</strong> the overall <strong>trade</strong> <strong>apprenticeship</strong> <strong>tra<strong>in</strong><strong>in</strong>g</strong> <strong>in</strong> India dur<strong>in</strong>g the<br />
years from 2000 to December 2006.<br />
TABLE-2<br />
OVERALL TRADE APPRENTICESHIP TRAINING<br />
Sl.<br />
No.<br />
Items<br />
AS ON 31 ST MARCH<br />
AS ON 31 ST<br />
DECEMBER<br />
2000 2001 2002 2003 2004 2005 2006<br />
No. <strong>of</strong><br />
1 establishments<br />
hav<strong>in</strong>g <strong>tra<strong>in</strong><strong>in</strong>g</strong><br />
facilities<br />
No. <strong>of</strong><br />
2<br />
establishments<br />
engag<strong>in</strong>g<br />
apprentices<br />
3 Intake capacity<br />
4<br />
No. <strong>of</strong><br />
apprentices on<br />
roll<br />
28,525 28,418 28,911 29,123 32,413 36,930 30,990<br />
19,307 19,079 18,636 18,788 20,990 26,577 27,099<br />
2,25,084 2,18,447 2,20,915 2,30,470 2,46,137 2,54,943 2,60,927<br />
1,62,845 1,57,654 1,52,882 1,54,029 1,68,821 1,74,380 1,85,407<br />
There has been rise <strong>in</strong> the number <strong>of</strong> establishments with <strong>tra<strong>in</strong><strong>in</strong>g</strong> facilities except <strong>in</strong> the<br />
year 2001 & 2006. Similarly, the number <strong>of</strong> establishments engaged apprentices had gone up<br />
from 19,307<strong>in</strong> 2000 to 27,099 dur<strong>in</strong>g 2006. Intake capacity and number <strong>of</strong> apprentices on roll<br />
have shown decl<strong>in</strong><strong>in</strong>g trend till 2001 and 2002 respectively thereafter, both registered ris<strong>in</strong>g<br />
trends. Graph-I also depicts the above trend. As aga<strong>in</strong>st a total <strong>of</strong> 30,990 establishments with<br />
<strong>tra<strong>in</strong><strong>in</strong>g</strong> facilities, only 27,099 (87%) establishments had actually engaged apprentices dur<strong>in</strong>g the<br />
period under report. State-wise number <strong>of</strong> establishments with <strong>tra<strong>in</strong><strong>in</strong>g</strong> facilities and the number<br />
<strong>of</strong> establishments who actually engaged apprentices are given <strong>in</strong> Annexure-I &II. The <strong>in</strong>take<br />
capacity as well as the apprentices on roll <strong>of</strong> the establishments is given <strong>in</strong> Annexure-III.<br />
6
GRAPH-1<br />
O V E R A L L T R A D E A P P R E N T I C E S H I P<br />
T R A I N I N G ( Y E A R - W I S E ) A S O N 3 1 S T<br />
M A R C H & D E C E M B E R 2 0 0 6<br />
3 0 0<br />
2 5 0<br />
NO. (IN THOUSANDS)<br />
2 0 0<br />
1 5 0<br />
1 0 0<br />
5 0<br />
0<br />
2 0 0 0 2 0 0 1 2 0 0 2 2 0 0 3 2 0 0 4 2 0 0 5 2 0 0 6<br />
E s t t s . W i t h F a c i l i t i e s<br />
E s t t s . E n g a g i n g A p p r e n t i c e s<br />
I n t a k e C a p a c i t y<br />
A p p r e n t i c e s o n R o l l<br />
Out <strong>of</strong> 1,85,407 apprentices on roll dur<strong>in</strong>g the year 2006, 20,142 (11%) were Scheduled Caste and<br />
15,314 (8%) were Scheduled Tribe apprentices. The State-wise details <strong>of</strong> SC and ST apprentices<br />
who had undergone <strong>apprenticeship</strong> <strong>tra<strong>in</strong><strong>in</strong>g</strong> are given <strong>in</strong> Annexure-IV. Further analysis <strong>of</strong> data<br />
<strong>in</strong>dicates that out <strong>of</strong> total 1,86,301 apprentices on roll as many as 1,52,387 (82%)apprentices were<br />
NTC holders and the rema<strong>in</strong><strong>in</strong>g 33,914 (18%) were freshers. The State-wise <strong>in</strong>formation about<br />
Freshers & NTC holder apprentices is given <strong>in</strong> Annexure-V. Table 3 and Graph 2 reflect the<br />
break-up <strong>of</strong> Trade Apprenticeship Tra<strong>in</strong><strong>in</strong>g <strong>in</strong> Central Sector and State/Private Sector as on 31 st<br />
December 2006.<br />
7
TABLE-3<br />
SECTOR-WISE OVERALL TRADE APPRENTICESHIP TRAINING<br />
Items<br />
AS ON 31 ST DECEMBER 2006<br />
Central Sector State/Private Total<br />
Sector<br />
1. No. <strong>of</strong> estts. hav<strong>in</strong>g <strong>tra<strong>in</strong><strong>in</strong>g</strong> facilities 778 30212 30990<br />
2. No. <strong>of</strong> estts. engag<strong>in</strong>g apprentices 592 26507 27099<br />
3. Intake capacity 33552 227375 260927<br />
4. No. <strong>of</strong> apprentices on roll 29511 155896 185407<br />
GRAPH-2<br />
NO. (IN THOUSANDS)<br />
O V E R A L L ( S E C T O R - W IS E ) T R A D E<br />
A P P R E N T IC E S H IP T R A IN IN G<br />
A S O N 3 1 S T D E C E M B E R 2 0 0 6<br />
2 8 0<br />
2 6 0<br />
2 4 0<br />
2 2 0<br />
2 0 0<br />
1 8 0<br />
1 6 0<br />
1 4 0<br />
1 2 0<br />
1 0 0<br />
8 0<br />
6 0<br />
4 0<br />
2 0<br />
0<br />
C E N T R A L<br />
S T A T E /P R IV A T E<br />
T O T A L<br />
E s t t s . W i t h F a c i l i t i e s<br />
E s t t s . E n g a g i n g A p p r e n t i c e s<br />
I n t a k e C a p a c i t y<br />
A p p r e n t i c e s o n R o l l<br />
8
Out <strong>of</strong> 30,990 establishments with <strong>in</strong>take capacity <strong>of</strong> 2,60,927, only 27,099<br />
establishments engaged 1,85,407 apprentices result<strong>in</strong>g <strong>in</strong> 88% and 71% utilization <strong>of</strong> capacity <strong>in</strong><br />
Central Sector and State/Private Sector respectively. Overall participation rate <strong>of</strong> establishments<br />
was 87% whereas 13% <strong>of</strong> the establishments with <strong>tra<strong>in</strong><strong>in</strong>g</strong> facilities had not participated <strong>in</strong> the<br />
<strong>apprenticeship</strong> <strong>tra<strong>in</strong><strong>in</strong>g</strong> programme.<br />
PERFORMANCE OF THE APPRENTICES IN ALL INDIA TRADE TESTS/<br />
EXAMINATIONS<br />
All India exam<strong>in</strong>ation (popularly known as all India <strong>trade</strong> test) is held twice a year <strong>in</strong> June<br />
and December. 31,939 candidates appeared for <strong>trade</strong> test dur<strong>in</strong>g June, 2006 and 54,057 candidates<br />
appeared <strong>in</strong> the <strong>trade</strong> test held <strong>in</strong> December, 2006. Thus, <strong>in</strong> all about 85,996 apprentices appeared<br />
<strong>in</strong> the <strong>trade</strong> tests. Out <strong>of</strong> 31,939 candidates who appeared <strong>in</strong> the <strong>trade</strong> test <strong>in</strong> June, 2006, 16,798<br />
candidates were declared successful and out <strong>of</strong> 54,057 candidates who appeared <strong>in</strong> December,<br />
2006, 30,923 passed out. The percentage <strong>of</strong> successful apprentices was 53% <strong>in</strong> June, 2006 and<br />
57% <strong>in</strong> December, 2006 <strong>trade</strong> tests respectively. State-wise details <strong>of</strong> candidates, who appeared<br />
and passed out <strong>in</strong> <strong>trade</strong> tests conducted dur<strong>in</strong>g June, 2006 and December, 2006 are given <strong>in</strong><br />
Annexure-VI & VII respectively. The success rate <strong>of</strong> apprentices <strong>in</strong> Central Sector was <strong>of</strong> the<br />
order <strong>of</strong> 80% dur<strong>in</strong>g <strong>trade</strong> test held <strong>in</strong> June, 2006. This rate was around 75% dur<strong>in</strong>g December,<br />
2006 exam<strong>in</strong>ation show<strong>in</strong>g a decrease <strong>of</strong> 5%.<br />
TRADE APPRENTICESHIP IN CENTRAL SECTOR<br />
As on 31 st December, 2006, there were 778 establishments with <strong>apprenticeship</strong> <strong>tra<strong>in</strong><strong>in</strong>g</strong><br />
facilities. Out <strong>of</strong> these, only 592 establishments engaged apprentices. The participation rate was<br />
76%. In these establishments, the <strong>in</strong>take capacity was <strong>of</strong> the order <strong>of</strong> 33,552 aga<strong>in</strong>st which<br />
29,511 apprentices were on roll result<strong>in</strong>g <strong>in</strong> 88% utilization <strong>of</strong> the capacity. These apprentices<br />
comprised <strong>of</strong> 5,054 (17%) Scheduled Caste and 1,524 (5%) Scheduled Tribe. The details about<br />
the <strong>trade</strong> apprentices under the Central Sector dur<strong>in</strong>g the year 2000 to 2006 are given <strong>in</strong> Table -4.<br />
9
Items<br />
TABLE-4<br />
TRADE APPRENTICESHIP IN CENTRAL SECTOR<br />
AS ON 31 ST MARCH<br />
AS ON 31 ST<br />
DECEMBER<br />
2000 2001 2002 2003 2004 2005 2006<br />
1. No. <strong>of</strong> estts. hav<strong>in</strong>g <strong>tra<strong>in</strong><strong>in</strong>g</strong> 803 781 712 649 690 760 778<br />
facilities<br />
2. No. <strong>of</strong> estts. engag<strong>in</strong>g<br />
590 577 532 517 559 595 592<br />
apprentices<br />
3. Intake capacity 41,138 39,232 36,719 31,434 31,534 32,209 33,552<br />
4. No. <strong>of</strong> apprentices on roll 32,817 29,461 26,552 27,055 28,374 27,014 29,511<br />
The maximum number <strong>of</strong> establishments hav<strong>in</strong>g <strong>tra<strong>in</strong><strong>in</strong>g</strong> facilities <strong>in</strong> the Central Sector<br />
were located <strong>in</strong> Maharashtra (76), West Bengal (70), Tamil Nadu (67) and followed by Uttar<br />
Pradesh (58). In Maharashtra, 96% <strong>of</strong> the establishments hav<strong>in</strong>g <strong>tra<strong>in</strong><strong>in</strong>g</strong> facilities <strong>in</strong> central<br />
sector engaged apprentices whereas this was 90% <strong>in</strong> case <strong>of</strong> Tamil Nadu, 74% <strong>in</strong> Uttar Pradesh<br />
and 70% <strong>in</strong> respect <strong>of</strong> West Bengal.<br />
TRADE APPRENTICESHIP IN THE STATE/PRIVATE SECTOR<br />
State/Private Sector contributes the maximum number <strong>of</strong> apprentices under the<br />
Apprenticeship Tra<strong>in</strong><strong>in</strong>g Scheme under the Apprentices Act, 1961. As on 31.12.2006, there were<br />
30,212 establishments hav<strong>in</strong>g <strong>tra<strong>in</strong><strong>in</strong>g</strong> facilities, out <strong>of</strong> which 26,507 establishments actually<br />
engaged apprentices <strong>in</strong> the Apprenticeship Tra<strong>in</strong><strong>in</strong>g Scheme. The participation rate <strong>in</strong> their case<br />
was 88%. The performance <strong>of</strong> the State/Private Sector for the period 2000-2006 is shown <strong>in</strong><br />
Table-5. It may be observed that every year, more or less the same number <strong>of</strong> establishments<br />
engaged apprentices till 2003 but there is <strong>in</strong>crease <strong>of</strong> 8236 apprentices dur<strong>in</strong>g the year 2006 over<br />
the year 2003. As on 31 st December, 2006, the <strong>in</strong>take capacity <strong>of</strong> these establishments was<br />
about 2.27 lakh aga<strong>in</strong>st which about 1.56 lakh <strong>trade</strong> apprentices were on roll. The capacity<br />
utilisation, therefore, was <strong>of</strong> the order <strong>of</strong> 69%. Amongst 1.56 lakh apprentices, 15,088 (10%)<br />
were Scheduled Caste and 13,790 (9%) were Scheduled Tribe apprentices. 23,943 apprentices<br />
took the <strong>trade</strong> test held <strong>in</strong> June, 2006, out <strong>of</strong> which 10,371 passed out. Similarly, about 44,233<br />
apprentices appeared <strong>in</strong> the <strong>trade</strong> test held <strong>in</strong> November/December, 2006, out <strong>of</strong> which about<br />
23,578 were declared successful. The success rate <strong>of</strong> apprentices, therefore, was 43% <strong>in</strong> June,<br />
2006 and 53% <strong>in</strong> December, 2006 <strong>trade</strong> tests respectively, which was low as compared to the<br />
success rate <strong>of</strong> apprentices <strong>in</strong> the Central Sector. Please refer Annexure VI, VII & VIII.<br />
10
TABLE-5<br />
TRADE APPRENTICESHIP IN STATE/PRIVATE SECTOR<br />
Sl.<br />
No.<br />
Items<br />
AS ON 31 ST MARCH<br />
AS ON 31 ST<br />
DECEMBER<br />
2000 2001 2002 2003 2004 2005 2006<br />
1 No. <strong>of</strong> estts. hav<strong>in</strong>g<br />
<strong>tra<strong>in</strong><strong>in</strong>g</strong> facilities<br />
No. <strong>of</strong> estts.<br />
2<br />
engag<strong>in</strong>g<br />
apprentices<br />
3 Intake capacity<br />
4 No. <strong>of</strong> apprentices<br />
on roll<br />
27,722<br />
27,637 28,199 28,474 31,723 36,170 30,212<br />
18,717<br />
18,502 18,104 18,271 20,431 25,982 26,507<br />
1,83,946 1,79,215 1,84,196 1,99,036 2,14,603 2,22,734 2,27,375<br />
1,30,028 1,28,193 1,26,330 1,26,974 1,40,512 1,47,366 1,55,896<br />
TRADE-WISE APPRENTICESHIP TRAINING<br />
As on 31.12.2006, there were 153 <strong>trade</strong>s covered under the Act. The number <strong>of</strong> workers<br />
other than unskilled workers, <strong>in</strong>take capacity and number <strong>of</strong> apprentices undergone <strong>tra<strong>in</strong><strong>in</strong>g</strong><br />
<strong>in</strong>clud<strong>in</strong>g freshers and ITI passed out are shown <strong>in</strong> Annexure-IX. It may be seen, there from,<br />
that there were many <strong>trade</strong>s <strong>in</strong> which the actual enrolment was negligible as compared to <strong>in</strong>take<br />
capacity. Largest (45,713) capacity was <strong>in</strong> Fitter Trade. The lowest <strong>in</strong>take capacity was 2 for<br />
Embroidery and Needle Worker; 3 <strong>in</strong> Mechanic Medical Equipment for Hospitals & Occupational<br />
Health Centre; 4 each <strong>in</strong> Mechanic Sew<strong>in</strong>g Mach<strong>in</strong>e and Health & Slimm<strong>in</strong>g Assistant; 5 <strong>in</strong><br />
Mono Key Board Operator and 6 <strong>in</strong> Pruner Tea Garden. In four <strong>trade</strong>s, Sports Goods Maker<br />
(Woods), Construction Mach<strong>in</strong>ery Mechanic-cum-Operator, Sports Goods Maker (Leather) and<br />
Fibre Re<strong>in</strong>forced Plastic Processor, there was no <strong>in</strong>take capacity.<br />
TRADES WITH NO ENROLMENT<br />
The follow<strong>in</strong>g seven <strong>trade</strong>s did not have enrolment whereas <strong>in</strong>take capacity existed: -<br />
Mechanic Sew<strong>in</strong>g Mach<strong>in</strong>e<br />
Plastic Mould Maker<br />
Mono Caster Operator<br />
Mechanic Medical Equipment for<br />
Hospitals & Occupational Health<br />
Centers.<br />
Brick Layer (Refractory)<br />
Steel Melt<strong>in</strong>g Hand<br />
Mono Key Board Operator<br />
11
TRADES WITH ONLY FRESHERS ENROLMENT<br />
As compared to last year there is deletion <strong>of</strong> one <strong>trade</strong> i.e. Beautician dur<strong>in</strong>g 2006.<br />
Crane Operator (Overhead) (Steel Industry)<br />
Engraver<br />
Knitter (Hosiery)<br />
Pr<strong>in</strong>t<strong>in</strong>g (Textile)<br />
Shotfirer/Blaster (M<strong>in</strong>es)<br />
Mate (M<strong>in</strong>es)<br />
Embroidery and Needle Worker<br />
Shipwright (Steel)<br />
Rigger<br />
Operator cum Mechanic Pollution Control<br />
Equipment<br />
Hair Dresser<br />
Health and Slimm<strong>in</strong>g Assistant<br />
Optical Worker<br />
Advance Attendant Operator (Process)<br />
Mechanic Advance Mach<strong>in</strong>e Tool<br />
Ma<strong>in</strong>tenance<br />
Jewellery and Precious Metal Worker<br />
Barber/Hair Cutter/Dresser<br />
Pruner Tea Gardens<br />
Material Handl<strong>in</strong>g Equipment Mechanic<br />
cum Operator<br />
TRADES WITH ONLY ITI PASS ENROLMENT<br />
As compared to last year there is deletion <strong>of</strong> Gas Cutter <strong>trade</strong> whereas Dress Maker has taken its<br />
place.<br />
Fruit and Vegetable Processor<br />
Mechanic (Mar<strong>in</strong>e Diesel Eng<strong>in</strong>es)<br />
Leather Goods Maker<br />
F<strong>in</strong>ished Leather Maker<br />
Mechanic Agricultural Mach<strong>in</strong>ery<br />
Dress Maker<br />
Hair & Sk<strong>in</strong> Carer<br />
Power-Electrician<br />
Operator-cum-Mechanic (Power Plant)<br />
REVISED ELIGIBILITY CRITERIA<br />
Dur<strong>in</strong>g the period under report, curriculum <strong>of</strong> the follow<strong>in</strong>g four <strong>trade</strong>s have been changed:<br />
Welder (Gas & Electric)<br />
Foundryman<br />
Sheet Metal Worker<br />
Carpenter<br />
INTRODUCTION OF NEW TRADES<br />
The follow<strong>in</strong>g new <strong>trade</strong>s have been designated under the Apprentices Act, 1961 dur<strong>in</strong>g<br />
the period under report:<br />
Sales Person (Retail)<br />
Senior Sales Person (Retail)<br />
Glass Former & Processor<br />
Wood Handicraft Worker<br />
12
PARTICIPATION OF SC/STs IN THE APPRENTICEHSIP TRAINING<br />
SCHEME<br />
Participation <strong>of</strong> SC/STs <strong>in</strong> the Trade Apprenticeship Programme is analyzed on the basis<br />
<strong>of</strong> ratio <strong>in</strong>corporated <strong>in</strong> the Apprentices Act, 1961. Annexure-X reveals the trend. It may be<br />
observed, therefrom, that the ratio <strong>in</strong> respect <strong>of</strong> both SC & ST is on the lower side as aga<strong>in</strong>st the<br />
provision <strong>of</strong> the Act. This shows that implement<strong>in</strong>g agencies need to make more effort to<br />
<strong>in</strong>crease participation <strong>of</strong> SC/ST tra<strong>in</strong>ees <strong>in</strong> the scheme as per Apprentices Act, 1961. This entails<br />
them to come forward with <strong>in</strong>cessant efforts to achieve goals.<br />
EMPLOYMENT & UNEMPLOYMENT OF APPRENTICESHIP<br />
TRAINEES<br />
As on 31 st December 2006, there were about 2.01 lakh Non-NTC holder apprentices job -<br />
seekers on the live register <strong>of</strong> the Employment Exchanges as compared to 1.91 lakh as on<br />
31.12.2005. Similarly, NTC holders Live Register (LR) comprised <strong>of</strong> 15.31 lakh as on<br />
31.12.2006 as compared to 15.11 lakh as on 31.12.05. State-wise distribution is given <strong>in</strong><br />
Annexure-XI. It can be observed, therefrom, that maximum concentration <strong>of</strong> the job-seekers<br />
<strong>in</strong> this category was <strong>in</strong> Southern Region. As aga<strong>in</strong>st this, the placement made through the<br />
Employment Exchanges was 1,520 for Non NTC holders and 10,699 for NTC holders dur<strong>in</strong>g<br />
2006. In this connection, it may be mentioned that all the job-seekers on the live register may not<br />
necessarily be unemployed. As per the survey on the Activity Status <strong>of</strong> Job-Seekers registered<br />
with the Employment Exchanges carried out <strong>in</strong> 1988, about 38.7% <strong>of</strong> the National Apprenticeship<br />
Certificate holders were employed but cont<strong>in</strong>ued to be on the roll <strong>of</strong> the Employment Exchanges<br />
for better/regular employment <strong>in</strong> the organized sector. Tak<strong>in</strong>g this above fact <strong>in</strong>to consideration,<br />
the actual unemployment amongst NTC holder was 9.38 lakh (61.26%) as on 31st December<br />
2006.<br />
PLACEMENT OF APPRENTICES WITH TRAINING EMPLOYERS<br />
3504 apprentices have reported to be placed with the same employers where they took the<br />
<strong>tra<strong>in</strong><strong>in</strong>g</strong> the maximum number <strong>of</strong> 1091 <strong>in</strong> Gujarat, 530 <strong>in</strong> Tamilnadu, 522 <strong>in</strong> Karnataka, 500 <strong>in</strong><br />
Kerala, 419 <strong>in</strong> Orissa, 143 <strong>in</strong> West Bengal and 113 <strong>in</strong> Andhra Pradesh etc. 42% <strong>of</strong> the States/UTs<br />
have reported this <strong>in</strong>formation. This is likely to improve <strong>in</strong> future years.<br />
13
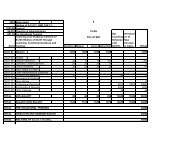
Annexure-I<br />
Statement show<strong>in</strong>g State-wise number <strong>of</strong> establishments hav<strong>in</strong>g <strong>tra<strong>in</strong><strong>in</strong>g</strong><br />
facilities as on 31.12.2006 under the Apprenticeship Tra<strong>in</strong><strong>in</strong>g Scheme.<br />
Sl. Name <strong>of</strong> the Number <strong>of</strong> establishments hav<strong>in</strong>g<br />
No. State/U.T. <strong>tra<strong>in</strong><strong>in</strong>g</strong> facilities <strong>in</strong><br />
State/<br />
Central Private<br />
Total<br />
Sector Sector<br />
1. 2. 3. 4. 5.<br />
1. Andhra Pradesh 45 1441 1486<br />
2. Arunachal Pradesh 6 1 7<br />
3. Assam 23 280 303<br />
4. Bihar 11 71 82<br />
5. Chhatisgarh 20 96 116<br />
6. Delhi 37 1527 1564<br />
7. Goa 7 140 147<br />
8. Gujarat 27 3821 3848<br />
9. Haryana 20 1894 1914<br />
10. Himachal Pradesh 8 190 198<br />
11. Jammu & Kashmir 4 572 576<br />
12. Jharkhand 30 217 247<br />
13. Karnataka 38 1209 1247<br />
14. Kerala 50 1305 1355<br />
15. Madhya Pradesh 45 315 360<br />
16. Maharashtra 76 6812 6888<br />
17. Manipur 3 25 28<br />
18. Meghalaya 6 - 6<br />
19. Mizoram 2 - 2<br />
20. Nagaland 2 11 13<br />
21. Orissa 46 452 498<br />
22. Punjab 15 859 874<br />
23. Rajasthan 30 798 828<br />
24. Tamilnadu 67 2164 2231<br />
25. Tripura 3 34 37<br />
26. Uttarakhand 16 152 168<br />
27. Uttar Pradesh 58 4343 4401<br />
28. West Bengal 70 1097 1167<br />
29. Andaman & Nicobar 3 7 10<br />
30. Chandigarh 5 37 42<br />
31. Dadra & Nagar Haveli - 21 21<br />
32. Daman & Diu - 90 90<br />
33. Pondicherry 5 231 236<br />
All India Total 778 30212 30990<br />
14
Annexure-II<br />
Statement show<strong>in</strong>g State-wise number <strong>of</strong> establishments actually engag<strong>in</strong>g<br />
apprentices as on 31.12.2006 under the Apprenticeship Tra<strong>in</strong><strong>in</strong>g Scheme.<br />
Sl.<br />
No.<br />
Name <strong>of</strong> the<br />
State/U.T.<br />
Number <strong>of</strong> establishments engag<strong>in</strong>g<br />
apprentices <strong>in</strong><br />
Central State/Private Total<br />
Sector<br />
Sector<br />
1. 2. 3. 4. 5.<br />
1. Andhra Pradesh 36 1048 1084<br />
2. Arunachal Pradesh 1 1 2<br />
3. Assam 14 74 88<br />
4. Bihar 5 49 54<br />
5. Chhatisgarh 8 52 60<br />
6. Delhi 31 1527 1558<br />
7. Goa 7 62 69<br />
8. Gujarat 24 4519 4543<br />
9. Haryana 16 1205 1221<br />
10. Himachal Pradesh 8 190 198<br />
11. Jammu & Kashmir 2 572 574<br />
12. Jharkhand 22 217 239<br />
13. Karnataka 36 2969 3005<br />
14. Kerala 37 1032 1069<br />
15. Madhya Pradesh 35 315 350<br />
16. Maharashtra 73 4189 4262<br />
17. Manipur 2 10 12<br />
18. Meghalaya - - 6<br />
19. Mizoram - - 2<br />
20. Nagaland - 7 2<br />
21. Orissa 27 366 393<br />
22. Punjab 14 445 459<br />
23. Rajasthan 21 383 404<br />
24. Tamilnadu 60 1384 1444<br />
25. Tripura - 29 29<br />
26. Uttarakhand 14 138 152<br />
27. Uttar Pradesh 43 4343 4386<br />
28. West Bengal 49 1096 1145<br />
29. Andaman & Nicobar 1 6 7<br />
30. Chandigarh 4 33 37<br />
31. Dadra & Nagar Haveli - 12 12<br />
32. Daman & Diu - 20 20<br />
33. Pondicherry 2 214 216<br />
All India Total 592 26507 27099<br />
15
Annexure-III<br />
Statement show<strong>in</strong>g State-wise <strong>in</strong>take capacity and apprentices undergo<strong>in</strong>g <strong>tra<strong>in</strong><strong>in</strong>g</strong> as on<br />
31.12.2006 under the Apprenticeship Tra<strong>in</strong><strong>in</strong>g Scheme.<br />
Sl.<br />
No.<br />
Name <strong>of</strong> the<br />
State/U.T.<br />
Intake capacity<br />
No. <strong>of</strong> apprentices undergo<strong>in</strong>g<br />
<strong>tra<strong>in</strong><strong>in</strong>g</strong><br />
Central State/Pvt. Total Central State/Pvt. Total<br />
Sector Sector Sector Sector<br />
1. 2. 3. 4. 5. 6. 7. 8.<br />
1. Andhra Pradesh 3444 17548 20992 3353 13649 17002<br />
2. Arunachal Pradesh 20 17 37 - 3 3<br />
3. Assam 526 261 787 547 49 596<br />
4. Bihar 173 792 965 144 283 427<br />
5. Chhatisgarh 524 1193 1717 261 477 738<br />
6. Delhi 1086 6206 7292 761 4071 4832<br />
7. Goa 209 1027 1236 175 584 759<br />
8. Gujarat 570 29609 30179 532 26386 26918<br />
9. Haryana 439 7677 8116 316 5611 5927<br />
10. Himachal Pradesh 141 1998 2139 80 1221 1301<br />
11. Jammu & Kashmir 24 648 672 7 743 750<br />
12. Jharkhand 1108 1268 2376 778 1474 2252<br />
13. Karnataka 3386 22705 26091 3137 15926 19063<br />
14. Kerala 1630 8154 9784 1400 7499 8899<br />
15. Madhya Pradesh 1897 4701 6598 1719 2448 4167<br />
16. Maharashtra 3538 47749 51287 3090 31252 34342<br />
17. Manipur 31 80 111 18 26 44<br />
18. Meghalaya 42 - 42 - - 0<br />
19. Mizoram 7 - 7 - - 0<br />
20. Nagaland 5 30 35 - 12 12<br />
21. Orissa 1157 3795 4952 1016 3097 4113<br />
22. Punjab 622 5527 6149 355 3167 3522<br />
23. Rajasthan 675 7332 8007 651 3173 3824<br />
24. Tamilnadu 5116 29767 34883 4936 16161 21097<br />
25. Tripura 30 184 214 18 109 127<br />
26. Uttarakhand 775 1154 1929 684 423 1107<br />
27 Uttar Pradesh 2976 23073 26049 2468 13453 15921<br />
28. West Bengal 3306 3377 6683 3004 3269 6273<br />
29. Andaman & Nicobar 18 52 70 10 52 62<br />
30. Chandigarh 56 263 319 37 151 188<br />
31. Dadra & Nagar Haveli - 88 88 - 89 89<br />
32. Daman & Diu - 60 60 - 98 98<br />
33. Pondicherry 21 1040 1061 14 940 954<br />
All India Total 33552 227375 260927 29511 155896 185407<br />
16
Annexure-IV<br />
Statement show<strong>in</strong>g State-wise number <strong>of</strong> Scheduled Caste and Scheduled Tribe apprentices<br />
undergo<strong>in</strong>g <strong>tra<strong>in</strong><strong>in</strong>g</strong> as on 31.12.2006 under the Apprenticeship Tra<strong>in</strong><strong>in</strong>g Scheme.<br />
Sl. Name <strong>of</strong> the Number <strong>of</strong> Scheduled Caste Number <strong>of</strong> Scheduled Tribe<br />
No. State/U.T. apprentices undergo<strong>in</strong>g <strong>tra<strong>in</strong><strong>in</strong>g</strong> apprentices undergo<strong>in</strong>g <strong>tra<strong>in</strong><strong>in</strong>g</strong><br />
Central State/ Pvt. Total Central State/ Pvt. Total<br />
Sector Sector Sector Sector<br />
1. 2. 3. 4. 5. 6. 7. 8<br />
1. Andhra Pradesh 460 2046 2506 120 819 939<br />
2. Arunachal Pradesh - - - - 1 1<br />
3. Assam 35 1 36 52 1 53<br />
4. Bihar 7 43 50 10 5 15<br />
5. Chhatisgah 49 66 115 50 77 127<br />
6. Delhi 84 279 363 22 1 23<br />
7. Goa 21 - 21 7 - 7<br />
8. Gujarat 76 2222 2298 32 1993 2025<br />
9. Haryana 69 919 988 3 - 3<br />
10. Himachal Pradesh 26 141 167 3 71 74<br />
11. Jammu & Kashmir 0 43 43 0 4 4<br />
12. Jharkhand 84 23 107 162 75 237<br />
13. Karnataka 404 1107 1511 204 419 623<br />
14. Kerala 191 706 897 18 33 51<br />
15. Madhya Pradesh 341 343 684 266 165 431<br />
16. Maharashtra 473 3267 3740 179 1316 1495<br />
17. Manipur - 1 1 1 1 2<br />
18. Meghalaya - - - - - -<br />
19. Mizoram - - - - - -<br />
20. Nagaland - - - - 12 12<br />
21. Orissa 48 465 513 33 712 745<br />
22. Punjab 129 645 774 2 38 40<br />
23. Rajasthan 101 228 329 77 170 247<br />
24. Tamilnadu 1445 47 1492 122 7696 7818<br />
25. Tripura - 34 34 - 30 30<br />
26. Uttarakhand 78 21 99 35 4 39<br />
27. Uttar Pradesh 522 2109 2631 40 106 146<br />
28. West Bengal 404 146 550 86 34 120<br />
29. Andaman & Nicobar - - - - - -<br />
30. Chandigarh 5 21 26 0 - -<br />
31. Dadra & Nagar Haveli - - - - - -<br />
32. Daman & Diu - 3 3 - 7 7<br />
33. Pondicherry 2 162 164 - - -<br />
All India Total 5054 15088 20142 1524 13790 15314<br />
17
Statement show<strong>in</strong>g State-wise number <strong>of</strong> Fresher & National Trade Certificate (NTC)<br />
holder apprentices undergo<strong>in</strong>g <strong>tra<strong>in</strong><strong>in</strong>g</strong> as on 31.12.2006 under the Apprenticeship<br />
Tra<strong>in</strong><strong>in</strong>g Scheme.<br />
Sl.<br />
No.<br />
Name <strong>of</strong> the<br />
State/U.T.<br />
Annexure-V<br />
Number <strong>of</strong> apprentices undergo<strong>in</strong>g<br />
<strong>tra<strong>in</strong><strong>in</strong>g</strong><br />
Freshers NTC Total<br />
holder<br />
1. 2. 3. 4. 5.<br />
1. Andhra Pradesh 687 16288 16975<br />
2. Arunachal Pradesh 3 - 3<br />
3. Assam 189 394 583<br />
4. Bihar 120 427 547<br />
5. Chhatisgarh 77 454 531<br />
6. Delhi 4369 463 4832<br />
7. Goa 212 385 597<br />
8. Gujarat 4520 22066 26586<br />
9. Haryana 361 5554 5915<br />
10. Himachal Pradesh 590 711 1301<br />
11. Jammu & Kashmir 627 57 684<br />
12. Jharkhand 1237 1002 2239<br />
13. Karnataka 4976 14087 19063<br />
14. Kerala 1010 7889 8899<br />
15. Madhya Pradesh 1424 1628 3052<br />
16. Maharashtra 5421 29628 35049<br />
17. Manipur - 51 51<br />
18. Meghalaya - - -<br />
19. Mizoram - - -<br />
20. Nagaland - - -<br />
21. Orissa 415 3698 4113<br />
22. Punjab 767 2756 3523<br />
23. Rajasthan 649 3125 3774<br />
24. Tamilnadu 2188 18909 21097<br />
25. Tripura - 127 127<br />
26. Uttaranchal 61 502 563<br />
27. Uttar Pradesh 2647 15931 18578<br />
28. West Bengal 1319 4959 6278<br />
29. Andaman & Nicobar 5 8 13<br />
30. Chandigarh 36 152 188<br />
31. Dadra & Nagar Haveli - 88 88<br />
32. Daman & Diu - 98 98<br />
33. Pondicherry 4 950 954<br />
All India Total 33914 152387 186301<br />
18
Annexure-VI<br />
Statement show<strong>in</strong>g State-wise number <strong>of</strong> apprentices appeared and passed out <strong>in</strong> the<br />
<strong>trade</strong> test held <strong>in</strong> June, 2006 under the Apprenticeship Tra<strong>in</strong><strong>in</strong>g Scheme.<br />
Sl. Name <strong>of</strong> the Number Appeared Number Passed<br />
No. State/U.T.<br />
Central State/ Pvt. Total Central State/ Pvt. Total<br />
Sector Sector Sector Sector<br />
1. 2. 3. 4. 5. 6. 7. 8<br />
1. Andhra Pradesh 1329 4959 6288 944 1110 2054<br />
2. Arunachal Pradesh 2 - 2 2 - 2<br />
3. Assam 119 13 132 77 12 89<br />
4. Bihar 7 - 7 3 - 3<br />
5. Chhatisgah - 137 137 - 205 205<br />
6. Delhi 44 - 44 34 - 34<br />
7. Goa - 106 106 - 1 1<br />
8. Gujarat - 4716 4716 - 3805 3805<br />
9. Haryana 46 1340 1386 38 978 1016<br />
10. Himachal Pradesh - - - - - -<br />
11. Jammu & Kashmir 1 - 1 - - -<br />
12. Jharkhand 89 514 603 72 350 422<br />
13. Karnataka 2004 434 2438 1725 157 1882<br />
14. Kerala 344 1180 1524 247 209 456<br />
15. Madhya Pradesh - - - - - -<br />
16. Maharashtra 754 - 754 538 - 538<br />
17. Manipur 9 12 21 7 9 16<br />
18. Meghalaya - - - - - -<br />
19. Nagaland - - - - - -<br />
20. Orissa 275 2963 3238 224 637 861<br />
21. Punjab 96 - 96 92 - 92<br />
22. Rajasthan 179 691 870 168 293 461<br />
23. Tamilnadu 1373 6088 7461 1178 2315 3493<br />
24. Tripura - - - - - -<br />
25. Uttarakhand - - - - - -<br />
26. Uttar Pradesh 930 - 930 710 - 710<br />
27. West Bengal 392 270 662 366 225 591<br />
28. Andaman & Nicobar - 52 52 - - -<br />
29. Chandigarh 1 48 49 1 - 1<br />
30 Daman & Diu - 91 91 - 65 65<br />
31 Dadar & Nagar Haveli - - - - - -<br />
32 Pondicherry 2 329 331 1 - 1<br />
All India Total 7996 23943 31939 6427 10371 16798<br />
Note: * Gujarat & Goa figures <strong>in</strong>cluded <strong>in</strong> Maharashtra State.<br />
@ Uttarakhand, M.P. and Chhatisgarh figures <strong>in</strong>cluded <strong>in</strong> U.P. State.<br />
19
Annexure-VII<br />
Statement show<strong>in</strong>g State-wise number <strong>of</strong> apprentices appeared and passed out <strong>in</strong> the<br />
<strong>trade</strong> test held <strong>in</strong> November/December, 2006 under the Apprenticeship Tra<strong>in</strong><strong>in</strong>g Scheme.<br />
Sl. Name <strong>of</strong> the Number Appeared Number Passed<br />
No. State/U.T.<br />
Central State/ Pvt. Total Central State/ Pvt. Total<br />
Sector Sector Sector Sector<br />
1. 2. 3. 4. 5. 6. 7. 8<br />
1. Andhra Pradesh 1419 6091 7510 949 2600 3549<br />
2. Arunachal Pradesh - - - - - -<br />
3. Assam 100 - 100 64 - 64<br />
4. Bihar 32 131 163 26 - 26<br />
5. Chhatisgah 29 172 201 23 121 144<br />
6. Delhi 155 163 318 104 - 104<br />
7. Goa 71 86 157 43 23 66<br />
8. Gujarat 135 7374 7509 121 6175 6296<br />
9. Haryana 129 2227 2356 14 1667 1681<br />
10. Himachal Pradesh 30 324 354 13 83 96<br />
11. Jammu & Kashmir 1 145 146 0 97 97<br />
12. Jharkhand 101 565 666 6 508 514<br />
13. Karnataka 969 5183 6152 726 1747 2473<br />
14. Kerala 634 1168 1802 524 594 1118<br />
15. Madhya Pradesh 325 441 766 276 330 606<br />
16. Maharashtra 1676 5898 7574 1189 2720 3909<br />
17. Manipur 9 2 11 7 2 9<br />
18. Meghalaya - - - - - -<br />
19. Mizoram - - - - - -<br />
20. Nagaland - - - - - -<br />
21. Orissa 134 497 631 127 379 506<br />
22. Punjab 194 3109 3303 165 630 795<br />
23. Rajasthan 158 762 920 19 314 333<br />
24. Tamilnadu 2202 7251 9453 1766 3722 5488<br />
25. Tripura - 109 109 - - -<br />
26. Uttarakhand 201 213 414 199 175 374<br />
27. Uttar Pradesh 452 1506 1958 437 1126 1563<br />
28. West Bengal 658 280 938 540 226 766<br />
29. Andaman & Nicobar 4 - 4 3 - 3<br />
30. Chandigarh 6 40 46 4 23 27<br />
31. Dadra & Nagar Haveli - 74 74 - 72 72<br />
32. Daman & Diu - 91 91 - 65 65<br />
33. Pondicherry - 331 331 - 179 179<br />
All India Total 9824 44233 54057 7345 23578 30923<br />
20
Annexure-VIII<br />
Sl.<br />
No.<br />
Statement show<strong>in</strong>g State-wise number <strong>of</strong> apprentices undergo<strong>in</strong>g <strong>tra<strong>in</strong><strong>in</strong>g</strong>,<br />
appeared, passed and employed by the same employer <strong>in</strong> the <strong>trade</strong><br />
tests held dur<strong>in</strong>g 2006 under the Apprenticeship Tra<strong>in</strong><strong>in</strong>g Scheme.<br />
Name <strong>of</strong> the<br />
State/U.T.<br />
Undergo<strong>in</strong>g<br />
<strong>tra<strong>in</strong><strong>in</strong>g</strong><br />
As on 31.12.2006<br />
Appeared Passed Number <strong>of</strong> passed<br />
out apprentices<br />
employed by<br />
the same<br />
employer<br />
1 2 3 4 5 6<br />
1. Andhra Pradesh 17002 6378 2059 113<br />
2. Arunachal Pradesh 3 - - -<br />
3. Assam 596 113 76 26<br />
4. Bihar 427 163 26 8<br />
5. Chhatisgah 506 201 144 -<br />
6. Delhi 761 155 104 -<br />
7. Goa 175 71 43 -<br />
8. Gujarat 26918 7509 6296 1091<br />
9. Haryana 5927 2356 1681 -<br />
10. Himachal Pradesh 80 30 13 -<br />
11. Jammu & Kashmir 7 1 - -<br />
12. Jharkhand 778 101 6 12<br />
13. Karnataka 19063 6152 2473 522<br />
14. Kerala 8899 1802 1118 500<br />
15. Madhya Pradesh 3302 766 603 13<br />
16. Maharashtra 34342 1676 1189 -<br />
17. Manipur 43 11 9 -<br />
18. Meghalaya - - - -<br />
19. Mizoram - - - -<br />
20. Nagaland 12 - - -<br />
21. Orissa 4113 631 598 419<br />
22. Punjab 3623 194 165 39<br />
23. Rajasthan 3824 920 333 -<br />
24. Tamilnadu 21097 9453 5488 530<br />
25. Tripura 18 - - -<br />
26. Uttarakhand 764 331 299 -<br />
27. Uttar Pradesh 5132 452 437 87<br />
28. West Bengal 6278 988 853 143<br />
29. Andaman & Nicobar 62 56 3 1<br />
30. Chandigarh 188 46 27 -<br />
31. Dadra & Nagar Haveli - - - -<br />
32. Daman & Diu - - - -<br />
33. Pondicherry 954 331 179 -<br />
All India Total 164894 40887 24222 3504<br />
21
Annexure-IX<br />
Statement show<strong>in</strong>g <strong>trade</strong>-wise number <strong>of</strong> workers other than unskilled workers,<br />
<strong>in</strong>take capacity and number <strong>of</strong> apprentices undergo<strong>in</strong>g <strong>tra<strong>in</strong><strong>in</strong>g</strong> as freshers and ITI<br />
passed out dur<strong>in</strong>g the year 2006 under the Apprenticeship Tra<strong>in</strong><strong>in</strong>g Scheme.<br />
Sl. Trade Number <strong>of</strong> Intake Number <strong>of</strong> apprentices undergone<br />
No. workers other Capacity<br />
<strong>tra<strong>in</strong><strong>in</strong>g</strong><br />
than unskilled Fresher ITI Passed out Total<br />
workers (5+6)<br />
1 2 3 4 5 6 7<br />
1. Fitter 193610 45713 2725 33421 36146<br />
2. Turner 54955 14258 1222 8474 9696<br />
3. Mach<strong>in</strong>ist 43914 9992 1302 5328 6630<br />
4. Mach<strong>in</strong>ist (Gr<strong>in</strong>der) 9247 2003 161 938 1099<br />
5. Pattern Maker 880 234 42 55 97<br />
6. Foundryman 5581 1026 124 553 677<br />
7. Forger & Heat Treater 4382 1152 106 644 750<br />
8. Sheet Metal Worker 10853 3090 266 1754 2020<br />
9. Welder (Gas & Electric) 65047 13964 694 9835 10529<br />
10. Motor Vehicle Body Builder 4583 871 60 503 563<br />
11. Electrician 126756 27813 1816 20333 22149<br />
12. L<strong>in</strong>eman 59454 14008 262 10482 10744<br />
13. Wireman 19334 5944 132 4497 4629<br />
14. Auto Electrician 7537 1285 253 661 914<br />
15. Electrician Aircraft 315 30 4 16 20<br />
16. W<strong>in</strong>der (Armature) 1442 280 105 87 192<br />
17. Cable Jo<strong>in</strong>ter 432 223 29 114 143<br />
18. Electrician (M<strong>in</strong>es) 1899 297 58 185 243<br />
19. Electroplator 1174 229 11 85 96<br />
20. Carpenter 11904 2518 190 1337 1527<br />
21. Plumber 4068 2008 76 1274 1350<br />
22. Mason (Build<strong>in</strong>g Constructor) 1296 305 13 75 88<br />
23. Furniture & Cab<strong>in</strong>et Maker 57 12 1 5 6<br />
24. Sports Goods Maker (Wood) - - - - -<br />
25. Mechanic Mach<strong>in</strong>e Tool Ma<strong>in</strong>tenance 7069 1532 593 446 1039<br />
26. Mechanic Ma<strong>in</strong>tenance<br />
(Textile Mach<strong>in</strong>ery)<br />
27. Mechanic Ma<strong>in</strong>tenance<br />
(Chemical Plant)<br />
28. Mechanic Dairy Ma<strong>in</strong>tenance 172 58 16 13 29<br />
29. Mechanic Sew<strong>in</strong>g Mach<strong>in</strong>e 34 4 - - -<br />
30. Mechanic M<strong>in</strong><strong>in</strong>g Mach<strong>in</strong>ery 885 87 42 1 43<br />
31. Material Handl<strong>in</strong>g Equipment<br />
192 64 87<br />
- 87<br />
Mechanic-cum-Operator<br />
32. Tool & Die Maker (Die & Moulds) 1536 1412 121 499 620<br />
33. Tool & Die Maker<br />
(Press Tools, Jigs & Fixture)<br />
1188 457 19<br />
7319 1228 567<br />
1121 672 69<br />
34. Plastic Mould Maker 95 50 - - 0<br />
35. Instrument Mechanic 5768 2811 153 1728 1881<br />
36. Mechanic Instrument Aircraft 256 26 10 3 13<br />
37. Mechanic Watch & Clock 40 12 5 1 6<br />
38. Refrigeration & Air-condition<strong>in</strong>g 10284 5055 928 3064 3992<br />
Mechanic<br />
22<br />
36 55<br />
332 899<br />
348 417
1 2 3 4 5 6 7<br />
39. Mechanic (Motor Vehicle) 35410 18386 1937 12596 14533<br />
40. Mechanic (Diesel) 34464 12411 1204 8274 9478<br />
41. Mechanic (Tractor) 2837 1698 67 1226 1293<br />
42. Mechanic (Earth Mov<strong>in</strong>g Mach<strong>in</strong>ery) 523 423 156 139 295<br />
43. Mechanic (Mar<strong>in</strong>e Diesel Eng<strong>in</strong>es) 53 11 - 1 1<br />
44. Driver-cum-Fitter 2843 202 98 7 105<br />
45. Auto Mechanic<br />
Two Wheeler / Three Wheeler<br />
46. Construction Mach<strong>in</strong>ery<br />
Mechanic-cum-Operator<br />
1650<br />
-<br />
500<br />
-<br />
126<br />
-<br />
188<br />
-<br />
314<br />
-<br />
47. Draughtsman (Civil) 18063 2713 72 1707 1779<br />
48. Draughtsman (Mech.) 10853 1711 113 1067 1180<br />
49. Surveyor 3318 353 48 128 176<br />
50. Fitter Structural 2363 428 43 249 292<br />
51. Boiler Attendant 8664 5127 1708 1638 3346<br />
52. Steam Turb<strong>in</strong>e-cum-Auxilary<br />
Plant Operator<br />
1124 467 136 150 286<br />
53. Switch Board Attendant 747 1743 419 459 878<br />
54. L<strong>in</strong>o Operator 1290 237 62 8 70<br />
55. Mono Key Board Operator 15 5 - - -<br />
56. Mono Caster Operator 45 10 - - -<br />
57. Process Cameraman 154 46 21 2 23<br />
58. Retoucher lithographic 112 45 31 6 37<br />
59. Engraver 8 15 15 - 15<br />
60. Book B<strong>in</strong>der 6333 1836 788 197 985<br />
61. Plate Maker (Lithographic) 398 224 86 10 96<br />
62. Offset Mach<strong>in</strong>e M<strong>in</strong>der 2260 1108 628 70 698<br />
63. Apprentice Food Production (<strong>General</strong>) 9019 3290 2128 63 2191<br />
64. Apprentice Food Production (Vegetarian) 2657 462 237 58 295<br />
65. Steward 10124 3648 1767 217 1984<br />
66. Baker & Confectioner 788 376 67 8 75<br />
67. House Keeper 4649 1253 514 37 551<br />
68. Hotel Clerk or Receptionist<br />
or Front Office Assistant<br />
2403 663 223<br />
37 260<br />
69. Fruit and Vegetable Processor 135 21 - 9 9<br />
70. Weaver 9936 300 117 2 119<br />
71. D<strong>of</strong>fer-cum-Piecer 14244 1525 322 246 568<br />
72. Tenter (Draw<strong>in</strong>g/Speed/Fly Frames) 7796 754 292 66 358<br />
73. W<strong>in</strong>der (Textile) 10779 563 287 55 342<br />
74. Knitter (Hoisery) 138 32 7 - 7<br />
75. Pr<strong>in</strong>t<strong>in</strong>g (Textile) 5388 527 469 - 469<br />
76. Creel Boy-cum-Warper 84 28 27 4 31<br />
77. Sirdar (Colliery) 528 132 168 18 186<br />
78. Shotfirer/Blaster (M<strong>in</strong>es) 470 67 47 - 47<br />
79. Mate (M<strong>in</strong>es) 395 42 30 - 30<br />
80. Attendant Operator (C.P) 24713 2875 1013 1147 2160<br />
81. Instrument Mechanic (C.P) 2052 940 209 382 591<br />
82. Laboratory Assistant (C.P) 5584 1559 363 636 999<br />
83. Fibre Re<strong>in</strong>forced Plastic Processor - - - - -<br />
84. Plastic Process<strong>in</strong>g Operator 4412 1111 43 570 613<br />
85. Designer & Master Cutter 205 79 11 9 20<br />
86. Tailor (Men) 10134 1579 626 595 1221<br />
87. Tailor (Women) 1027 311 58 126 184<br />
88. Tailor (<strong>General</strong>) 3967 1348 348 363 711<br />
89. Dress Maker 400 82 - 49 49<br />
23
1 2 3 4 5 6 7<br />
90. Embroidery and Needle Worker 16 2 2 - 2<br />
91. Mechanic Agricultural Mach<strong>in</strong>ery 121 19 - 4 4<br />
92. Horticulture Assistant 575 89 20 15 35<br />
93. Stockman (Dairy) 283 43 7 2 9<br />
94. Attendant Operator (Dairy) 3499 708 293 185 478<br />
95. Pump Operator cum Mechanic 2387 935 55 303 358<br />
96. Sports Goods Maker (Leather) - - - - 0<br />
97. Leather Goods Maker 626 133 - 63 63<br />
98. Foot Wear Maker 1922 285 48 103 151<br />
99. F<strong>in</strong>ished Leather Maker 540 203 - 3 3<br />
100. Ma<strong>in</strong>tenance Mechanic for<br />
Leather Mach<strong>in</strong>ery<br />
101. Upholsterer 105 33 10 11 21<br />
102. Shipwright (Steel) 145 21 4 - 4<br />
103. Pipe Fitter 609 96 12 75 87<br />
104. Rigger 702 74 30 - 30<br />
105. Gas Cutter 159 35 10 2 12<br />
106. Shipwright (Wood) 284 42 8 6 14<br />
107. Mechanic Radio & Radar Aircraft 336 191 11 31 42<br />
108. Electronics Mechanic 30545 7925 725 6060 6785<br />
109. Mechanic Television (Video) 546 73 1 45 46<br />
110. Photographer 31 11 3 5 8<br />
111. Brick Layer (Refractory) 337 38 - - 0<br />
112. Furnace Operator (Steel Industry) 237 17 31 2 33<br />
113. Steel Melt<strong>in</strong>g Hand 255 19 - - 0<br />
114. Crane Operator (Overhead)<br />
(Steel Industry)<br />
115. Beautician 181 58 50 5 55<br />
116. Hair Dressor 51 55 20 - 20<br />
117. Health & Slimm<strong>in</strong>g Assistant 13 4 1 - 1<br />
118. Hair and Sk<strong>in</strong> Carer 132 37 - 24 24<br />
119. Ceramic Moulder 263 142 129 30 159<br />
120. Ceramic Caster 348 336 248 54 302<br />
121. Ceramic Kiln Operator 473 208 56 11 67<br />
122. Ceramaic Press Operator 599 242 53 45 98<br />
123. Ceramic Decorator 259 106 146 29 175<br />
124. Moulder (Refractory) 1804 1365 291 387 678<br />
125. Enamel Glazer 64 76 97 16 113<br />
126. Insulator Maker/Mach<strong>in</strong>e Operator<br />
(Ceramic)<br />
127. Optical Worker 195 28 25 - 25<br />
128. Pa<strong>in</strong>ter (<strong>General</strong>) 8127 1452 246 639 885<br />
129. Pa<strong>in</strong>ter (Mar<strong>in</strong>e) 287 41 10 29 39<br />
130. Data Preparation & Computer S<strong>of</strong>tware 3559 1235 231 345 576<br />
131. Desk Top Publish<strong>in</strong>g Operator 635 221 35 25 60<br />
132. Programm<strong>in</strong>g & Systems Adm<strong>in</strong>istration<br />
Assistant<br />
133. Advanced Attendant Operator<br />
(Process)<br />
134. Operator cum Mechanic Pollution<br />
Control Equipment<br />
135. Mechanic Medical Equipment for<br />
Hospitals and Occupational Health<br />
Centers<br />
12 14 1 1<br />
550 35 10 - 10<br />
53 89 5 3<br />
13343 4400 59 3200 3259<br />
504 101 8 -<br />
354<br />
16<br />
24<br />
34<br />
3<br />
1<br />
-<br />
-<br />
-<br />
2<br />
8<br />
8<br />
1<br />
0
1 2 3 4 5 6 7<br />
136. Mechanic Industrial Electronics 49 7 3 1 4<br />
137. Mechanic Advanced Mach<strong>in</strong>e Tool<br />
Ma<strong>in</strong>tenance<br />
138. Operator Advanced Mach<strong>in</strong>e Tool 120 21 6 2 8<br />
139. Power Electrician 1331 372 - 243 243<br />
140. Operator-cum-Mechanic<br />
(Power Plant)<br />
141. Jewellery and Precious Metal Worker 4243 1372 338 - 338<br />
142. Gardener 2550 829 125 36 161<br />
143. Call Centre Assistant 785 272 42 16 58<br />
144. Barber/Hair Cutter/Dresser 1218 278 77 - 77<br />
145. Battery Repairer 656 236 93 2 95<br />
146. Tyre Repairer 862 233 62 4 66<br />
147. Screen Pr<strong>in</strong>t<strong>in</strong>g 269 79 14 2 16<br />
148. Beautician Assistant 1324 476 199 2 201<br />
149. Medical Laboratory Technician<br />
(Pathology)<br />
150. Medical Laboatory Technician<br />
(Radiology)<br />
151. Medical Laboatory Technician<br />
(Cardiology and Physiology)<br />
152. Pruner Tea Gardens 30 6 2 - 2<br />
153. Cable Television Operator 383 101 34 4 38<br />
All India Total 1024653 260927 33914 152387 186301<br />
82<br />
619<br />
2517<br />
801<br />
499<br />
18<br />
33<br />
864 364 329<br />
310<br />
157<br />
4<br />
-<br />
115<br />
51<br />
-<br />
8<br />
22<br />
12<br />
4<br />
8<br />
693<br />
137<br />
63<br />
25
Annexure-X<br />
Statement show<strong>in</strong>g State-wise participation ratio <strong>of</strong> SC/ST apprentices undergo<strong>in</strong>g<br />
<strong>tra<strong>in</strong><strong>in</strong>g</strong> as on 31.12.2006 under the Apprenticeship Tra<strong>in</strong><strong>in</strong>g Scheme<br />
Sl. Name <strong>of</strong> the Ratio <strong>of</strong> Scheduled Caste Ratio <strong>of</strong> Scheduled Tribe<br />
No. State/U.T. Apprentices to the Total Apprentices to the Total<br />
Apprentices Apprentices<br />
As per Act As on As per Act As on<br />
31.12.2006 31.12.2006<br />
1. 2. 3. 4. 5. 6.<br />
1. Andhra Pradesh 1:8 1:7 1:20 1:18<br />
2. Assam 1:17 1:17 1:9 1:11<br />
3. Bihar 1:7 1:9 1:11 1:11<br />
4. Guajarat 1:14 1:12 1:7 1:13<br />
5. Haryana 1:5 1:6 1:20 1:1976<br />
6. Himachal Pradesh 1:5 1:8 1:20 1:18<br />
7. Jammu & Kashmir 1:12 1:17 1:20 1:188<br />
8. Karnataka 1:8 1:13 1:20 1:31<br />
9. Kerala 1:11 1:10 1:20 1:174<br />
10. Madhya Pradesh 1:8 1:6 1:5 1:10<br />
11. Maharashtra 1:17 1:9 1:17 1:23<br />
12. Manipur 1:50 1:44 1:3 1:22<br />
13. Meghalaya 1:10 - 1:2 -<br />
14. Nagaland - - 1:2 1:1<br />
15. Orissa 1:7 1:8 1:4 1:6<br />
16. Punjab 1:4 1:5 1:20 1:88<br />
17. Rajasthan 1:6 1:12 1:8 1:15<br />
18. Tamilnadu 1:6 1:14 1:20 1:3<br />
19. Uttar Pradesh 1:5 1:6 1:20 1:109<br />
20. Tripura 1:8 1:4 1:3 1:4<br />
21. West Bengal 1:5 1:11 1:17 1:52<br />
22. Andman & Nicobar Island - - 1:6 -<br />
23. Arunachal Pradesh - - 1:2 1:3<br />
24. Chandigarh 1:8 1:7 1:20 -<br />
25. Dadra & Nagar Haveli 1:50 - 1:2 -<br />
26. Delhi 1:6 1:13 1:13 1:210<br />
27. Daman & Diu 1:50 1:33 1:20 1:14<br />
28. Goa - 1:36 1:2 1:108<br />
29. Mizoram - - 1:2 -<br />
30. Pondicherry 1:6 1:6 1:30 -<br />
31. Jharkhand - 1:21 - 1:10<br />
32. Chattisgarh - 1:6 - 1:6<br />
33. Uttarakhand - 1:11 - 1:28<br />
26
Annexure-XI<br />
STATEMENT SHOWING NUMBER OF NTC HOLDER AND NON NTC HOLDER TRAINED UNDER<br />
THE APPRENTICES ACT ON THE LIVE REGISTER AS ON 31.12.2006 TOGATHER WITH THEIR<br />
NUMBER PLACED IN EMPLOYMENT DURING DECEMBER, 2006.<br />
Sl. STATE/U.Ts.<br />
No.<br />
As on 31.12.2006<br />
NTC holder Non NTC holder<br />
Live Register Placement Live Register Placement<br />
STATES<br />
1. Andhra Pradesh 290789 76 56444 50<br />
2. Arunachal Pradesh 62 - - -<br />
3. Assam 14566 13 516 -<br />
4. Bihar 43259 2 1359 -<br />
5. Chhatisgarh 48281 195 752 1<br />
6 Delhi 18590 3 323 -<br />
7. Goa 6788 75 354 -<br />
8. Gujarat 93462 4505 8025 143<br />
9. Haryana 42210 64 909 -<br />
10. Himachal Pradesh 32690 50 749 6<br />
11. Jammu & Kashmir 2718 8 279 -<br />
12. Jharkhand 67787 - 6336 -<br />
13. Karnataka 70488 122 11726 513<br />
14. Kerala 125191 587 13237 50<br />
15. Madhya Pradesh 36245 23 1926 -<br />
16. Maharashtra 140295 2426 15245 136<br />
17. Manipur 2066 - 9 -<br />
18. Meghalaya 323 - 6 -<br />
19. Mizoram 1613 - - -<br />
20. Nagaland 288 - 7 -<br />
21. Orissa 32453 258 3162 9<br />
22. Punjab 37452 18 2093 -<br />
23. Rajasthan 21082 333 980 53<br />
24. Sikkim * - - - -<br />
25. Tamilnadu 202575 1278 59026 550<br />
26. Tripura 3214 12 239 -<br />
27. Uttarakhand 19369 196 640 5<br />
28. Uttar Pradesh 99706 422 7182 4<br />
29. West Bengal 58329 27 5581 -<br />
UNION TERRITORIES<br />
30. A & N Islands - - - -<br />
31. Chandigarh 5048 - 243 -<br />
32. D & N Haveli 185 - - -<br />
33. Daman & Diu 564 - 3 -<br />
34. Lakshadweep - - - -<br />
35. Pondicherry 13539 6 3650 -<br />
ALL INDIA TOTAL 1531227 10699 201001 1520<br />
Note:-<br />
* No Employment Exchange is function<strong>in</strong>g <strong>in</strong> this State.<br />
27
Annexure-XII<br />
Statement show<strong>in</strong>g number <strong>of</strong> NTC holder and Non NTC holder apprentices registered and placed<br />
through Employment Exchnages-All India 1986-2006.<br />
Year Number <strong>of</strong> Number Placed <strong>in</strong> Number on the Live % <strong>of</strong> Placement % <strong>of</strong> Placement<br />
Registered Employment Register at the end to Live Register to Live Register<br />
<strong>of</strong> the period <strong>of</strong> NTC <strong>of</strong> Non NTC<br />
holder holder<br />
NTC Non NTC Non NTC Non apprentices apprentices<br />
holder NTC holder NTC holder NTC<br />
holder holder holder<br />
1. 2. 3. 4. 5. 6. 7. 8. 9.<br />
1986 - - 9924 2732 685626 68618 1.4 4.0<br />
1987 - - 14451 4354 719877 67148 2.0 6.5<br />
1988 - - 13598 4401 793872 80823 1.7 5.4<br />
1989 - - 13242 3448 854947 82125 1.5 4.2<br />
1990 - - 12481 3723 923175 90244 1.4 4.1<br />
1991 - - 15804 2959 913219 95470 1.7 3.1<br />
1992 - - # # # # # #<br />
1993 - - 12421 2588 1025548 90736 1.2 2.9<br />
1994 - - 12911 2086 969295 98432 1.3 2.1<br />
1995 - - 8986 1459 1067054 90339 0.8 1.6<br />
1996 - - 12297 2524 1114856 105584 1.1 2.4<br />
1997 - - 14177 2719 1218401 111529 1.2 2.4<br />
1998 144720 17334 9422 2590 1341378 134328 0.7 1.9<br />
1999 152101 18790 12425 2677 1409788 145612 0.9 1.8<br />
2000 163959 12601 5050 1450 1380068 146689 0.4 1.0<br />
2001 152236 20058 4630 1988 1382648 154013 0.3 1.3<br />
2002 150221 22718 5267 1531 1423862 165348 0.4 0.9<br />
2003 138438 20830 4912 645 1459744 167509 0.3 0.4<br />
2004 141605 22524 4354 1407 1493569 171234 0.3 0.8<br />
2005 129718 22465 6494 1355 1511459 191475 0.4 0.7<br />
2006 152387 33914 10699 1520 1531227 201001 0.7 0.8<br />
Note:-<br />
# Skipped<br />
28
Annexure-XIII<br />
ATS-1 (For RDAT/STATE/UT)<br />
Part-I<br />
Schedule for submission <strong>of</strong> Half Yearly Return:<br />
For the half year end<strong>in</strong>g June<br />
By 31st July<br />
For the half year end<strong>in</strong>g December<br />
By 31st January<br />
Report for the half year end<strong>in</strong>g<br />
Name and Address <strong>of</strong> Regional Director <strong>of</strong> Apprenticeship<br />
Tra<strong>in</strong><strong>in</strong>g/State/UT Apprenticeship Adviser<br />
Telephone No.: Fax No. :<br />
Telegram :<br />
e-mail Address:<br />
Serial Designated Number <strong>of</strong> Number <strong>of</strong> Number <strong>of</strong> Apprentices Number <strong>of</strong> Number <strong>of</strong> Number <strong>of</strong><br />
Number Trade workers other <strong>apprenticeship</strong> under Tra<strong>in</strong><strong>in</strong>g<br />
apprentices apprentices passed out<br />
than unskilled seats located Fresher Industrial Total appeared passed <strong>in</strong> apprentices<br />
workers by State Tra<strong>in</strong><strong>in</strong>g <strong>in</strong> All India All India employed<br />
Apprenticeship Institute Trade Test Trade Test by the same<br />
Adviser/ Passed held <strong>in</strong>_____ held <strong>in</strong>_____ employer<br />
Regional out (Month) (Month)<br />
Director <strong>of</strong><br />
_____ (Year) _____ (Year)<br />
Apprenticeship<br />
Tra<strong>in</strong><strong>in</strong>g as per<br />
ratio<br />
1 2 3 4 5 6 7 8 9 10<br />
29
ATS-1 (For RDAT/STATE/UT)<br />
Part-II<br />
Out <strong>of</strong> apprentices undergo<strong>in</strong>g <strong>tra<strong>in</strong><strong>in</strong>g</strong><br />
persons with disability<br />
Scheduled Scheduled Other Visually Hear<strong>in</strong>g Orthopaedically Total<br />
Women M<strong>in</strong>orities<br />
Caste Tribe Backward Impaired Impaired handicapped (14+15+16)<br />
Class<br />
11 12 13 14 15 16 17<br />
18 19<br />
Date:-<br />
Name and signature <strong>of</strong> Regional Director <strong>of</strong> Apprenticeship Tra<strong>in</strong><strong>in</strong>g/<br />
State/Union Territory Apprenticeship Adviser<br />
30
Annexure-XIV<br />
ATS-2 (For RDAT)<br />
Part-I<br />
Schedule for submission <strong>of</strong> Half Yearly Return:<br />
For the half year end<strong>in</strong>g June<br />
For the half year end<strong>in</strong>g December<br />
Report for the half year end<strong>in</strong>g<br />
Name and Address <strong>of</strong> Regional Director <strong>of</strong> Apprenticeship Tra<strong>in</strong><strong>in</strong>g<br />
Telephone No.: Fax No. :<br />
Telegram :<br />
e-mail Address:<br />
By 31st July<br />
By 31st January<br />
Serial State Number <strong>of</strong> Number <strong>of</strong> establishments Number <strong>of</strong> establishments Number <strong>of</strong> Number <strong>of</strong><br />
Number estts. which where seats have been<br />
engag<strong>in</strong>g apprentices <strong>apprenticeship</strong> apprentices<br />
should be located<br />
Up to the Added/ Total seats on roll<br />
covered Up to the Added/ Total end <strong>of</strong> deleted located<br />
under the end <strong>of</strong> deleted previous dur<strong>in</strong>g<br />
Act previous dur<strong>in</strong>g half year the half<br />
half the half<br />
year year<br />
1 2 3 4 5 6 7 8 9 10 11<br />
31
ATS-2 (For RDAT)<br />
Part-II<br />
Out <strong>of</strong> apprentices undergo<strong>in</strong>g <strong>tra<strong>in</strong><strong>in</strong>g</strong><br />
persons with disability<br />
Scheduled Scheduled Other Visually Hear<strong>in</strong>g Orthopaedically Total<br />
Women<br />
M<strong>in</strong>orities<br />
Caste Tribe Backward Impaired Impaired Handicapped (14+15+16)<br />
Class<br />
11 12 13 14 15 16 17<br />
18<br />
19<br />
Date:-<br />
Name and signature <strong>of</strong> Regional Director<br />
32
Annexure-XV<br />
ATS-3 (For State/Union Territory)<br />
Part-I<br />
Schedule for submission <strong>of</strong> Half Yearly Return:<br />
For the half year end<strong>in</strong>g June<br />
For the half year end<strong>in</strong>g December<br />
Report for the half year end<strong>in</strong>g<br />
Name and Address <strong>of</strong> State<br />
Apprenticeship Adviser<br />
Telephone No.: Fax No. :<br />
Telegram :<br />
e-mail Address:<br />
By 31st July<br />
By 31st January<br />
Serial Sector Number <strong>of</strong> Number <strong>of</strong> establishments Number <strong>of</strong> establishments Number <strong>of</strong> Number <strong>of</strong><br />
Number estts. which where seats have been<br />
engag<strong>in</strong>g apprentices <strong>apprenticeship</strong> apprentices<br />
should be located<br />
Up to the Added/ Total seats on roll<br />
covered Up to the Added/ Total end <strong>of</strong> deleted located<br />
under the end <strong>of</strong> deleted previous dur<strong>in</strong>g<br />
Act previous dur<strong>in</strong>g half year the half<br />
half the half<br />
year year<br />
1 2 3 4 5 6 7 8 9 10 11<br />
1 State/<br />
Public<br />
Sector<br />
2 Private<br />
Sector<br />
33
ATS-3 (For State/Union Territory)<br />
Part-II<br />
out <strong>of</strong> apprentices undergo<strong>in</strong>g <strong>tra<strong>in</strong><strong>in</strong>g</strong><br />
persons with disability<br />
Scheduled Scheduled Other Visually Hear<strong>in</strong>g Orthopaedically Total<br />
Women<br />
M<strong>in</strong>orities<br />
Caste Tribe Backward Impaired Impaired Handicapped (14+15+16)<br />
Class<br />
11 12 13 14 15 16 17 18<br />
19<br />
Date:-<br />
Name and signature <strong>of</strong> State/Union Territory Apprenticeship Adviser<br />
34