EVALUATION OF PASSENGER TRAIN CONCEPTS â Practical Methods for ...
EVALUATION OF PASSENGER TRAIN CONCEPTS â Practical Methods for ...
EVALUATION OF PASSENGER TRAIN CONCEPTS â Practical Methods for ...

You also want an ePaper? Increase the reach of your titles
YUMPU automatically turns print PDFs into web optimized ePapers that Google loves.
<strong>EVALUATION</strong> <strong>OF</strong> <strong>PASSENGER</strong> <strong>TRAIN</strong><br />
<strong>CONCEPTS</strong> – <strong>Practical</strong> <strong>Methods</strong> <strong>for</strong><br />
Measuring Travellers’ preferences in<br />
Relation to Costs<br />
K. Kottenhoff a<br />
a<br />
Inst. of Infrastructure<br />
Transportation & Logistics<br />
KTH (The Royal Institute of Technology)<br />
SE-100 44 Stockholm, Sweden<br />
Abstract : This paper presents practical methods in these areas; costs, valuation methods<br />
and handling of package effects and finally how to trade off passengers’ valuations to costs.<br />
The methods are used as a toolbox <strong>for</strong> identifying the measures that would increase the<br />
value <strong>for</strong> rail passengers and the society and increasing the profitability <strong>for</strong> rail operators.<br />
”<strong>Practical</strong> methods” means that the procedures <strong>for</strong> data collection and analysis should be<br />
efficient in terms of research time and cost and effective in terms of high quality results. Both<br />
costs and valuations are described as per cent change. These changes can be traded off.<br />
Beneficial measures are those where the difference between passengers’ marginal valuation<br />
and operators’ marginal cost is positive. Examples of such measures are higher train speeds<br />
and many on-board com<strong>for</strong>t measures.<br />
Key Words: Passenger Train, Valuation, Cost, Trade-off, Passengers, Com<strong>for</strong>t
Introduction<br />
It is often difficult to operate rail traffic with sufficient profitability. For many years, the railway<br />
industry has failed in some respects to choose rolling stock based on the end users’ preferences<br />
and willingness to pay <strong>for</strong> using the railways. The reasons <strong>for</strong> this include the lack of<br />
established, practical methods in the railway sector 1 to evaluate the relationship between supply/train<br />
properties and travellers’ preferences. The methods should be interpretable and af<strong>for</strong>dable<br />
to have a better chance of being adopted by the industry.<br />
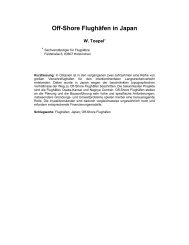
This paper will present practical methods in the areas; costs, valuation methods and package<br />
effects and finally trade off. A cost model will be introduced first. Then follows the two sections<br />
about valuation methods. Finally a trade-off method is presented.<br />
1. Method to<br />
identify<br />
cost reduction<br />
potentials<br />
2. Valuation<br />
methods:<br />
SP with CASI<br />
interviewing<br />
3. Method to<br />
circumvent<br />
package<br />
effects<br />
4. Trade-off<br />
method<br />
costs/<br />
valuations<br />
Figure 1: This paper presents practical methods grouped into four chapters.<br />
1<br />
Stated preference studies has though been conducted by some railways, <strong>for</strong> example BR, DSB and NS.<br />
2
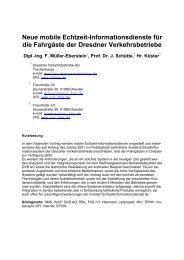
1 Model <strong>for</strong> the identification of cost reduction potentials of<br />
various measures<br />
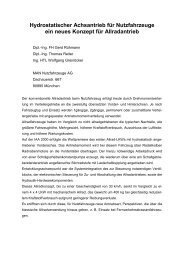
In order to calculate the cost of passenger rail services, an economic model 2 has been developed.<br />
The aim is to analyse how much different measures influence the cost of train operation.<br />
Outputs from the economic model are SEK/passenger kilometre <strong>for</strong> the actual combination<br />
and an earlier reference combination of traffic and vehicle types. The structure of the<br />
model is shown in figure 2. The model output is train service cost per passenger-km using<br />
different input values, such as vehicle investment, maintenance, staff, energy costs and rail<br />
charges. The trains are supposed to operate according to one of a number of traffic type alternatives.<br />
In the examples further on, InterCity services 1 have been used.<br />
Purchase<br />
unit prices<br />
Rail fees<br />
fixed fee<br />
track use fee<br />
etc<br />
Maintenance<br />
km–dep.<br />
time-dep.<br />
Energy<br />
traction<br />
heating etc<br />
Cleaning<br />
time-dep.<br />
Train staff<br />
time-dep.<br />
*<br />
annuity<br />
*<br />
no. of<br />
vehicles<br />
/train<br />
*<br />
no. of<br />
vehicles<br />
/train<br />
*<br />
km<br />
/run<br />
*<br />
no. of<br />
vehicles<br />
/train<br />
*<br />
hours<br />
/run<br />
*<br />
staff<br />
size<br />
Fixed vehicle costs<br />
Distance costs/run<br />
Time costs/run<br />
*<br />
shopspare<br />
*<br />
runs/year<br />
Cost/year/trainset<br />
Type of<br />
traffic<br />
Mariginal costs<br />
(<strong>for</strong> extra train-sets)<br />
/<br />
km/year<br />
Expenses<br />
(/ traveller)<br />
*<br />
1/2<br />
Km-costs<br />
+ X % exp.<br />
/no. of seats<br />
* occupancy rate<br />
Cost of traffic/pass.km<br />
Figure 2: Economic model used to calculate train service costs and elasticities. The three cost types,<br />
fixed, distance and time, add to cost/year/trainset. Expenses are anticipated to be roughly 20-25% extra.<br />
These expenses should represent marginal costs <strong>for</strong> terminal services as ticketing, train shunting<br />
and so on. Finally the cost of traffic per passenger kilometre is calculated.<br />
2<br />
The economic model has been named "Tåganalys" in Swedish<br />
3
The real cost figures <strong>for</strong> the main operator in Sweden, SJ AB, is not official and can not be<br />
used explicitly. The economic model is there<strong>for</strong>e based in part on cost assumptions in the<br />
“Handbook on Investment Cost Benefit Analysis” by the Swedish Rail Administration [1]<br />
The cost levels has been checked against other sources (e.g. Baumgartner [4]) and various<br />
railway journals.<br />
1.1 Cost elasticities<br />
Mathematically elasticity is defined by the <strong>for</strong>mula:<br />
Elasticity<br />
=<br />
∆y<br />
/ y<br />
∆x1 / x<br />
1<br />
, where<br />
y =<br />
f ( x 1<br />
, x2....)<br />
Traffic planners often use a similar measure to express how much travelling is altered marginally<br />
<strong>for</strong> a marginal change in travelling cost or travelling time. That measure can be called<br />
"travelling elasticity with respect to (<strong>for</strong> example) travel cost". The measure used to identify<br />
how sensitive train traffic costs are can be called "train-cost elasticity with respect to input<br />
factor (vehicle investment, energy, interest rate etc.)".<br />
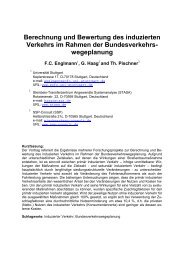
Cost elasticity rates of some of the factors one often tries to influence have been summarised.<br />
Figure 3 shows (absolute values of) some of these elasticity rates <strong>for</strong> a Swedish train operator.<br />
This shows that the elasticity rate <strong>for</strong> space utilisation is comparatively high – higher than that<br />
of many other factors, which are frequently addressed.<br />
Space utilisation<br />
Vehicle investment<br />
Vehicle kilometres<br />
Staff costs<br />
Average speed (
1.2 A calculation example – space lean seating<br />
In this example, the travellers’ com<strong>for</strong>t valuation is not included, because the perception of<br />
com<strong>for</strong>t should be constant. Examples of measures that can make a seat space lean are:<br />
– an intelligent recliner mechanism design<br />
– a thinner seatback<br />
– rounding the seat in front off <strong>for</strong> your legs<br />
Space lean adjustment<br />
movement<br />
2. <strong>Practical</strong> SP based methods<br />
Attractiveness can be examined in different ways. Stated preference (SP) methods have been<br />
used <strong>for</strong> investigating passengers' valuations of certain aspects of trains and train travelling.<br />
In qualitative studies, answers can be obtained to questions like ”what?” and ”how?”, but conflicts<br />
between objectives are more difficult to resolve. One such conflict can be between low<br />
ticket prices and a high quality or standard level. This trade-off is dealt with in Section 4. To<br />
make these trade-offs, it is necessary to quantify the values travellers ascribe to various measures.<br />
To be able to use valuations <strong>for</strong> planning, it is important to know exactly what is being valued.<br />
It is, <strong>for</strong> example, not so useful to know that ”price” is more important than ”travelling<br />
time”. What price and what time? Is reducing the price by one Euro, <strong>for</strong> example, a more important<br />
measure than shortening the travelling time by one hour?<br />
It is not even particularly useful to use a simple grading scale <strong>for</strong> the measures that are being<br />
examined. Does, <strong>for</strong> example, four points mean that something is somewhat more important<br />
or twice as important as three points?<br />
Stated Preference methods are usually able to present valuations on a useful scale. Theory and<br />
practice of SP methods are described by Hensher [7, 8] and a number of other researchers. I<br />
will just give an intuitive example.<br />
Table 2 shows the fictitious result of a stated preference experiment. The factors are described<br />
as differences in the level of attributes; attribute swings [6], and the weights are measured on<br />
a relative scale. It can be seen that 1 Euro was given weighting of 0.10. Another difference in<br />
attribute level, in this case 10 cm of legroom, is weighted at 0.05 and must there<strong>for</strong>e be valued<br />
as 0,50 Euro.<br />
Table 2: Results from a fictitious SP experiment. See text<br />
.<br />
Attribute swing Relative weight Value<br />
10 min shorter journey 0,07 Euro 0,70<br />
1 Euro lower price 0,10 Euro 1<br />
10 cm larger leg room 0,05 Euro 0,50<br />
The important thing is to obtain these weights with satisfactory precision. When choosing<br />
methods, I have tried to find and use methods, which are quick and cost effective to per<strong>for</strong>m<br />
but still reasonably accurate. CASI interviewing and also two "listings" methods will be presented<br />
in this paper.<br />
2.1 Computer assisted self interviewing (CASI)<br />
At the end of the 1980s KTH Traffic Planning conducted their first SP studies. These were<br />
made with cards describing various alternatives. The respondents had to sort the cards.<br />
Around 1990 a 5 kg portable computer were bought and interviewing with pairwise choices<br />
with computer generated alternatives started. The first SP study I organised, in 1992 on the<br />
Swedish east coast main line, were made with this heavy "portable" computer and to make the<br />
electric charge last we had a lead acid battery that we put at the floor by the seat of the pas-<br />
6
senger. The computer was placed so as to allow both the interviewer and the respondent to<br />
view the screen. The respondents who wanted to do so, were invited to do the typing by themselves.<br />
Later in 1992 I found 0,5 kg pocket computers (Poquet) that could run DOS, on the market.<br />
About four of these were used in my next study with train passengers at the local railway Roslagsbanan.<br />
The small computers were handed out to the passengers and they were given a<br />
very short instruction. ("Please read the questions on the screen and press a digit and <br />
when answering.") The battery life <strong>for</strong> our "Poquet" computers is two weeks, more than <strong>for</strong><br />
any competitor.<br />
Later we complemented our interview tools with a number of 1,3 kg HP Omnibook computers.<br />
They have larger and more distinct, but still reflective, screens and no hard disks,<br />
which makes the batteries last 8 hours. Modern backlit laptops often do not have the necessary<br />
battery time and most of them are still to heavy.<br />
One CASI interview normally takes about 10-15 minutes and in trains we do about 100 interviews<br />
per day with 5-8 computers in use. (In February 1999 a KTH student managed to conduct<br />
over 400 interviews in two days!) The answer data files can be saved on PC-cards and<br />
from these cards we copy the results to a master computer. Using a laptop in the field allows<br />
us to make statistics even in the field.<br />
Figure 5: Self completed computer-assisted interview (CASI) with pocket size computers on<br />
board a Swedish train. (MINT interview program) The paper sheet on the table shows alternative<br />
train designs.<br />
Decline is a comparatively small problem when doing CASI interviews in trains. People are<br />
in the train and often welcome the interviewer offering them something to do while travelling.<br />
Regarding refusals from old people and other persons feeling uncom<strong>for</strong>table handling the<br />
computer by themselves, they have often been offered assistance from the interviewer. Sometimes<br />
this has been necessary during the full interview, but often a good introduction has relieved<br />
their discom<strong>for</strong>t.<br />
7
Comparison of stated preference elicitation procedures<br />
In 1992-1993, a series of SP studies at KTH were supervised by Widlert [19] to test different<br />
SP methods. The SP interviews were made on long-distance trains.<br />
One interesting finding in these studies is that the use of very small hand-held computers and<br />
self-interviewing produced results similar to those produced by the method used previously,<br />
when an interviewer was present and a computer with a larger screen was used. Lundin &<br />
Steen [15] reports the following results <strong>for</strong> the same SP experiment carried out with and without<br />
interviewer assisting (table 3).<br />
Table 3: Results (Parameters, t-values and valuations) <strong>for</strong> assisted and non-assisted computer interviewing<br />
(CASI).<br />
Attribute<br />
Portable computer with<br />
interviewer assisting the<br />
respondents.<br />
Pocket computers, self assisted<br />
by respondents<br />
(CASI interview)<br />
Cost (%) -0,093 (8,6) -0,088 (8,5)<br />
Time (%) - 0,085 (9,5) -0,074 (9,2)<br />
Frequency (min) -0,0091 (8,6) -0,0079 (7,9)<br />
Modern coach +0,36 (3,2) +0,38 (3,7)<br />
X2000-coach +0,19 (1,8) +0,29 (2,9)<br />
Time value 0,91 % fare /% time 0,85 % fare /% time<br />
Frequency 0,10 % /min 0,09 % /min<br />
Modern coach +3,9 % +4,4 %<br />
X2000 coach +2,0 % +3,3 %<br />
Comparing the parameters of the two models shows no difference of any of the estimates on a<br />
10% significance level. The so-called scale differs a little but the value of time and frequency<br />
is very close. (The randomness seems to be somewhat larger <strong>for</strong> the CASI interviews, which<br />
can indicate those respondents did their choices a little less consistent.)<br />
Lundin & Steen conclude that the interviewers’ presence at the computer interviews did not<br />
have much influence on the results. They also mention the big time saving there is by handing<br />
out small computers to many passengers at a time instead of sitting next to every person being<br />
interviewed.<br />
2.2 Attribute based "listing" methods<br />
I have tested a simpler approach than the conventional alternative-based SP methods. Basing<br />
the experiment on alternatives composed of attributes and levels is also known as ”conjoint” –<br />
the attributes are joined to <strong>for</strong>m alternatives. In these alternative-based evaluations of attribute<br />
weights, the weights are indirectly evaluated by assessing the alternatives.<br />
8
Attributes<br />
Alternatives<br />
Attribute<br />
weights<br />
A<br />
A<br />
B<br />
composition<br />
decomposition<br />
B<br />
C<br />
C<br />
Figure 6: Alternative-based evaluation using composition and decomposition.<br />
Instead of these alternative-based preference elicitation procedures, the alternative of eliciting<br />
preferences directly <strong>for</strong> the attribute (levels) could be considered. An attribute-based evaluation<br />
method involves the respondents judging attributes directly and not via assessments of<br />
alternatives.<br />
Attributes<br />
A<br />
Attribute<br />
weights<br />
A<br />
B<br />
valuation - estimation method<br />
B<br />
C<br />
C<br />
Figure 7: Attribute-based evaluation. This figure is very simplified; the valuation estimation<br />
method may comprise several steps.<br />
It can be easier <strong>for</strong> the experimenter and <strong>for</strong> the respondents to use an attribute-based elicitation<br />
method. One drawback might be that interactions between attributes would be more difficult<br />
and perhaps impossible to detect. On the other hand, how often is this done in practice?<br />
Listings <strong>for</strong> ranking<br />
Thurstone [17] previously showed that pairwise choices of attributes – every attribute with<br />
every other – produces an approximately correct valuation of the attribute value if the attribute<br />
values among people are normally distributed.<br />
9
Attributes A B C<br />
A - B versus A C versus A<br />
B A versus B - C versus B<br />
C A versus C B versus C -<br />
Sum No of best A No of best B No of best C<br />
Figure 8: Thurstone's method of comparing all attributes with all other in pairwise choices.<br />
For three attributes, three pairs (choices) are sufficient. Even at only ten attributes, this<br />
method requires (too) many choices (45) if every attribute has to be compared with every<br />
other one once. So ranking the attributes could be considered. If, <strong>for</strong> example, B receives rank<br />
1 from one respondent, it has been chosen in favour of both A and C and so on.<br />
I have tested this method by simulation in a worksheet. It confirms that Thurstone’s method<br />
approximately reproduces the input attribute values, at least when the variation in taste <strong>for</strong> the<br />
attributes has intermediate variance.<br />
Valuations from a study using two listing methods<br />
A test of the two versions of ”listing” methods was conducted in a study [10] with doubledecker<br />
trains. The same attributes and levels were used in a computer interview and in a paper<br />
interview. In the computer interview, the respondents were asked to rank the first eight of 11<br />
attributes 3 . The method in the paper interview instead involved marking each attribute as ”important”<br />
or ”not important”. Figure 12 shows that the results from the two listing methods<br />
were similar.<br />
3<br />
The rankings in this method can be converted to pairwise choices between (almost) all attributes and<br />
then counted in accordance with Thurstone’s proposals (see Thurstone references)<br />
10
5% lower ticket price<br />
Seats that are softer<br />
10cm more leg-room<br />
Reclining seatback<br />
5cm wider seat<br />
5% shorter travelling time<br />
Table at my seat<br />
Dimmed lighting +<br />
reading lamps<br />
I can sit face-to-back<br />
Less noise than in this car<br />
More room <strong>for</strong> luggage<br />
Important-list<br />
Ranking method<br />
I can sit face-to-face<br />
0,0 1,0 2,0 3,0 4,0 5,0 6,0<br />
Figure 12: Valuation results <strong>for</strong> Uppsala travellers from two methods: an important/less important<br />
listing in paper interviews and an attribute ranking method used in the computer interviews [10].<br />
In this case, the method <strong>for</strong> estimating the valuations from the important list was simplified to<br />
count the numbers of important marks and assume a linear relationship to the values.<br />
11
3. Evaluating many attributes and circumventing package effects<br />
– a practical two level method<br />
When working with train concepts, we are often interested in more attributes than can be included<br />
in one regular stated preference experiment. In SP experiments with pair wise choices<br />
of alternatives, the number of attributes seldom are more than four to five. This is often to few<br />
when investigating new transport concepts.<br />
3.1 Package effects<br />
It is mostly of interest to improve trains and services using a package of measures and not just<br />
doing one thing at a time.<br />
Package effects are the phenomenon that a specific attribute often receives a lower value<br />
when it is included in a package together with other attributes (packages of measures). The<br />
valuation of the package tends to be lower than the sum of the valuations of the included attributes.<br />
This appears especially to be the case when it comes to secondary attributes.<br />
Monetary values <strong>for</strong> time, frequency and other primary factors have been acceptably consistent<br />
in the different studies [3]. However, the valuations of secondary factors such as many<br />
com<strong>for</strong>t and on-board service attributes have been less consistent, particularly when viewed<br />
as components of an improvement package. The value of com<strong>for</strong>t attributes should perhaps be<br />
reduced by as much as 50% when three to four of them are included in a package.<br />
<strong>Methods</strong> <strong>for</strong> circumventing the problem of package effects have been proposed and tested.<br />
Within the framework of our research, two studies have been conducted to test circumventing<br />
methods. Schmidt conducted one study in 1995/96 as a master’s thesis [16] under my supervision<br />
and in 1998 I conducted a second study [12]. These studies produced some interesting<br />
results about packaging effects [13].<br />
3.2 Study of train attributes in packages<br />
In general each of our SP studies has investigated the values of about three to five passenger<br />
train related attributes. Many of the investigated attributes have received values of about 5-<br />
10% of the ticket fare. As indicated above, it has been suspected that some of the attributes<br />
have received to high values. One reason may be the package effect.<br />
Bates [2] has proposed a methodology with attributes and packages of attributes at various<br />
levels to get around the package effect. This study tests a simplified two level value estimation<br />
method which combines binary stated choice of (package) alternatives with choices of<br />
most important attributes inside each package. The aim is to find a practical method where a<br />
rather big number of attributes can be evaluated without very long interviews. It is also the<br />
aim to considerably reduce the package effect. There<strong>for</strong>e the aggregated attributes should not<br />
be over-valued but the trade-off between attributes in the same package may be approximate.<br />
Interviews were made on-board X2000 trains between Malmö and Stockholm in March and<br />
April 1998. Almost half of the travellers were business. (Usually the number of business travellers<br />
is somewhere between, say 15 and 25 %.)<br />
12
The design of the interviews<br />
All interviews contained two levels of questions not counting the background variable questions.<br />
At upper level the value of three attribute packages were investigated; a timetable package,<br />
a com<strong>for</strong>t package and an on-board service package. At the lower level trade-offs between<br />
the attributes in respective package were investigated. Price was included as an attribute<br />
only at the upper level.<br />
It is more important to use a well-established method, as pair wise choices of alternatives, at<br />
the upper, package level than at the lower, "partworth" level. Doing so give some assurance<br />
<strong>for</strong> not exaggerating the value of the packages and thereby the sum of the values of the included<br />
attributes.<br />
To make the respondents familiar with the various timetable-, com<strong>for</strong>t- and service- attributes<br />
the lower level was conducted first. When conducting the package SP the respondents were<br />
familiar with the content of the packages.<br />
One objective was to test the so-called best/worst conjoint method <strong>for</strong> the lower level. The<br />
other two were used as "listings". The way listings were used in this study was as follows;<br />
respondents were asked to pick the best and second best from a list of five or seven attributes.<br />
To supplement this, they were also asked to pick the worst and second worst from the inverse<br />
level of the attributes. The listing method should be and has been modified in later studies, by<br />
allowing respondents to rank all the attributes in a listing. In this way, the method closely correspond<br />
to the method of pair wise choices of attributes proposed by Thurstone [17].<br />
Packages and their levels in the pairwise SP experiments<br />
The pair wise stated preference experiment included four factors. The price factor had 3 levels:<br />
Lowered price (minus 25% minus 10 SEK), Today's price and Raised price (plus 20%<br />
plus 10 SEK). The rest of the "factors", the three packages, had two levels each. The attributes<br />
that were included in a package were such attributes that were expected to have the same<br />
sign <strong>for</strong> most of the respondents. This applies to <strong>for</strong> example; shorter travelling time and less<br />
shakings and noise, but not <strong>for</strong>; train stops at many stations or sitting face-to-face.<br />
The MINT-program from Hague Consulting Group was used to produce the stated preference<br />
pair wise choice experiment.<br />
13
Initial questions<br />
2. Lower level<br />
TIMETABLE<br />
- travel time<br />
- delaysr<br />
- fequency<br />
- fixed timetable<br />
- interchange<br />
- pricing system<br />
- stops often<br />
COMFORT (in train)<br />
- leg-room<br />
- face-to-face/back<br />
- adjustable seats<br />
- shakings and vibr.<br />
- noise<br />
- air conditioning<br />
- lighting<br />
ON-BOARD<br />
SERVICE<br />
- restaurant<br />
- luggage space<br />
- music outlets<br />
- tables<br />
- amount of staff<br />
Listing or B/W<br />
Listing or B/W<br />
Listing or B/W<br />
1. Upper level<br />
PACKAGE SP with pairwise choices<br />
- Ticket price<br />
- Time table package<br />
- Com<strong>for</strong>t package<br />
- On-board service package<br />
FINAL QUESTIONS<br />
Figure 13: Illustration of the interview-levels and the order in which the questions were put.<br />
Package utilities from SP pairwise choice experiments<br />
As this study is designed with two levels, the first estimation determined the values of the<br />
packages. The next step is to divide these aggregate values into values or "partworths" <strong>for</strong><br />
separate attributes. The valuation of the packages is the result of estimations with Alogit<br />
software. Four models are shown here. The parameters, t-values and number of observations<br />
are shown in table 4.<br />
14
Table 4: Estimation results from the pairwise choice experiment <strong>for</strong> various segments.<br />
All trips Business trips Leisure trips Work trips<br />
Price (%) -0.045 (23.4) -0.041 (15.8) -0.043 (16.5) -0.035 (8.1)<br />
Timetable package 1.65 (16.9) 1.71 (15.2) 1.44 (12.9) 1.42 (7.8)<br />
Com<strong>for</strong>t package 1.91 (22.1) 1.93 (16.3) 1.64 (14.4) 1.36 (7.7)<br />
Service package 0.96 (13.6) 0.88 (9.5) 0.88 (8.7) 0.54 (3.5)<br />
r2 0.362 0.321 0.315 0.200<br />
No.of observ. 3040 1606 1447 529<br />
The valuations <strong>for</strong> the timetable, com<strong>for</strong>t and service packages were all higher than expected.<br />
The differences in parameters <strong>for</strong> the used segments, business, leisure trips and work+school,<br />
is rather small. The weight <strong>for</strong> money, <strong>for</strong> 1% of the ticket price, is very much the same <strong>for</strong> all<br />
three segments.<br />
Table 5: Valuation (% of fare) of packages in the pair wise choice experiment<br />
Level 1 Level 2 Valuation of level 1 in<br />
comparison to level 2<br />
TIMETABLE-package<br />
Travel time is shorter:<br />
#TIDL#, Double no of trains,<br />
same stroke every hour, no<br />
change, seldom delays, simple<br />
fare system<br />
COMFORT-package<br />
Less shakings and noise, air<br />
conditioning, adjustable<br />
seats, legroom +5cm, reading<br />
lamps<br />
SERVICE-package<br />
Big staff on board,<br />
food/coffee service, bigger<br />
room <strong>for</strong> luggage, table and<br />
music outlet at every seat<br />
Travel time is longer: #TIDH#,<br />
Same no of trains, change of<br />
train, delay every fifth journey,<br />
today's fare system<br />
More shakings and noise, no<br />
air cond., fixed seats, legroom<br />
-5cm, light tubes in the<br />
roof<br />
Fewer staff on board, somewhat<br />
less room <strong>for</strong> luggage<br />
+ 37% average <strong>for</strong> all<br />
+ 41% <strong>for</strong> business<br />
+ 33% <strong>for</strong> leisure<br />
+ 41% <strong>for</strong> work trips<br />
+ 42% average <strong>for</strong> all<br />
+ 47% business<br />
+ 38% leisure<br />
+ 39% work trips<br />
+ 21% average <strong>for</strong> all<br />
+ 21% business<br />
+ 21% leisure<br />
+ 16% work trips<br />
Valuation results – willingness-to-pay <strong>for</strong> various measures<br />
The package values have been split up and the sub-values or partworths allocated to the separate<br />
attributes. The valuations of the attributes are shown below, in table 6. Most of the values<br />
are compared with values from other KTH studies.<br />
15
Table 6: Valuation results from this study with comparisons with other studies.<br />
Attribute swing This study Other KTH studies Comments<br />
Timetable 37% Package value<br />
10% ( +10 min) travelling time 2-7% 6-10%<br />
No change of train instead of one change 8-10% 9-13%<br />
Double train frequency 3-4% 4%<br />
Delays are rare instead of one 15-min delay 10-11% 16%<br />
every fifth journey<br />
Regular departure times (One train every hour at 2-4% 1-3%<br />
the same time instead of an irregular service)<br />
Simpler fare but fewer discount prices instead of 0-3% –<br />
today's fare<br />
The train stops at few stations instead of many 3-7% –<br />
stations<br />
Com<strong>for</strong>t 42% Package value<br />
10cm legroom (Your legroom is 5 cm larger instead<br />
8% 6%<br />
of 5 cm smaller)<br />
More instead of somewhat less shaking and 8-10% 11%<br />
vibration than in this train<br />
Somewhat more instead of some-what less noise 5% 8%<br />
than in this train<br />
Air conditioning (Air conditioning with cool air in 5-7% ≈10%<br />
the summer time instead of no air conditioning,<br />
but windows that open)<br />
Face-to-back instead of face-to-face seating 1-3% 0-2%<br />
Your seatback is adjustable instead of not adjustable<br />
8-12% 6-11%<br />
Dimmed lighting and reading lamps instead of full 2-4% 4/ 11%<br />
fluorescent lighting<br />
On-board services 21% Package value<br />
There is catering onboard 8% 5-11%<br />
Music/radio outlets at your seat 1% 2- 5%<br />
There is always staff to help instead of somewhat 3%<br />
less staff than today<br />
More instead of less luggage space in the coach 3% 1%<br />
There is a table at your seat 5-7% 2%<br />
The valuation levels are surprisingly similar to those achieved in other KTH-studies in which<br />
secondary com<strong>for</strong>t and service attributes were estimated as separate attributes. Some of the<br />
differences in valuation levels may be caused by different attribute descriptions. As a whole<br />
the methodology in the package study has worked sufficiently well, with interesting support<br />
<strong>for</strong> two things:<br />
– The somewhat high valuation levels <strong>for</strong> com<strong>for</strong>t and service attributes obtained in other<br />
studies are generally supported.<br />
– It should be possible to use simplified methods similar to this one in order to assess the<br />
relative values or partworths of a great number of secondary attributes.<br />
16
4. A simplistic method to judge the profitability of various measures<br />
Comparisons of costs and benefits can be made at various levels. Figure 15 illustrates relations<br />
between a technical measure, its cost and the corresponding attribute(s) and passengers'<br />
valuation of this. The increased (or decreased) value may lead to an increased (or decreased)<br />
number of passengers, which in turn may call <strong>for</strong> a change in the produced supply and thereby<br />
increasing (or decreasing) costs. Another way is that the operator changes the ticket prices in<br />
direct relation to the changed value or willingness-to-pay (wtp). In this case the number of<br />
passengers should not be altered.<br />
Techn. measure<br />
Cost<br />
Attribute(s)<br />
Passengers'<br />
evaluation<br />
Cost/<br />
valuation<br />
Utility - valuation -<br />
willingness-to-pay<br />
Increased costs<br />
Increased<br />
number of<br />
passengers<br />
Cost/<br />
benefit<br />
Increased<br />
ticket prices<br />
Figure 15: Relationships between measures, costs, willingness-to-pay, increased travelling and benefits.<br />
In this case a restricted wtp/cost comparison is made, not a full cost/benefit analysis.<br />
A simpler "cost/benefit" comparison is made here. The passengers' valuation of a measure is<br />
compared with its cost. The cost/valuation model in figure 15 illustrates this.<br />
A full cost/benefit appraisal is replaced by a cost/valuation appraisal, where valuation stands<br />
<strong>for</strong> the passengers' valuations of various measures, estimated using stated preference methodology.<br />
The term valuation is chosen instead of willingness-to-pay because the latter may imply<br />
that there is an immediate opportunity to raise ticket prices and because willingness-toaccept<br />
is sometimes more relevant.<br />
4.1 Method <strong>for</strong> comparing marginal costs and valuations<br />
Using an economic model, e.g. the model described in section 1, it is possible to calculate cost<br />
changes in per cent. They can be compared with revenue changes in per cent. The prerequisite<br />
<strong>for</strong> this comparison to be fair is that the traffic just about breaks even, that is to say costs<br />
are covered 100%.<br />
17
There are many opportunities <strong>for</strong> cost and revenue changes that are of interest. They include<br />
combinations of increased and/or decreased cost and revenue. The most interesting measures<br />
are of course those measures, which both decrease costs and increase revenues.<br />
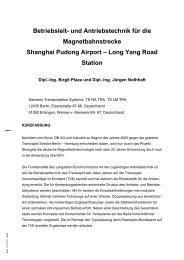
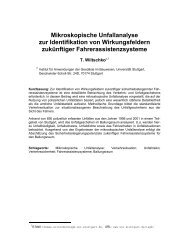
4.2 Summary of values and costs of various measures<br />
The various types of measure place themselves approximately in the manner shown below in<br />
figure 16, showing marginal values and costs. Note that the positions in figure 16 are not indisputable.<br />
Firstly there are uncertainties in the calculations and secondly the costs may be<br />
affected by choices of technology. Thirdly the value sets diverge in different sub markets.<br />
COST<br />
c/v = 1<br />
Solely<br />
compartments<br />
+15 %<br />
+10<br />
1+2 seating<br />
Catering<br />
at seat<br />
Café<br />
Solely face-to-face<br />
or non-facing seats<br />
1+3 seating<br />
-15% -10<br />
Legroom<br />
-5<br />
+-10 cm<br />
2+3 seating<br />
in wide trains<br />
+5<br />
-5<br />
-10<br />
-15%<br />
Reclining<br />
Play<br />
seat backs<br />
Video area<br />
AC<br />
Music<br />
outlets<br />
Ind. ventilation<br />
VALUATION<br />
Table<br />
+5 Reading +10 +15 %<br />
Space lights<br />
lean seats<br />
-20% time<br />
Double decks<br />
Travel time<br />
To be recommended<br />
Probably profitable<br />
Prof. in some cases<br />
Probably unprofitable<br />
To be avoided<br />
Figure 16: Ball-park marks <strong>for</strong> valuation (willingness to pay) and effect on the train service cost of<br />
different factors or undertakings.<br />
18
One interpretation of the figure is that the principle objective should be higher speeds, doubledecker<br />
or wide trains and items addressing com<strong>for</strong>t.<br />
Higher speed is placed below to the right, i.e. the costs decrease as the value increases. A 20%<br />
travelling time reduction increases willingness-to-pay by 10-20%, dependent on journey purpose<br />
(or even more <strong>for</strong> certain business travellers). At the same time traffic service costs are<br />
calculated to decrease by 3-5%.<br />
As a rule, com<strong>for</strong>t and service measures are profitable, i.e. the cost rise is lower than the marginal<br />
value.<br />
A higher usage of space brings the costs down and appropriately done the value decreases less<br />
than the costs. Passengers appear to value double decks in a slightly positive manner while<br />
three-plus-two seating, which is required <strong>for</strong> the effective use of wide bodies, appears to be<br />
slightly negative. The cost savings are of the same magnitude.<br />
A 10% increase in seating density, corresponding to 10cm per seat at the original seating distance<br />
of one metre, would cut costs by about 5%. This is a significant cost reduction. However,<br />
on the other hand, the valuation of legroom is of the same magnitude.<br />
A seemingly trivial measure, seats with space lean design, may save as much as 5 % of the<br />
total train service costs without reducing com<strong>for</strong>t. A somewhat more expensive seat is well<br />
compensated if the seat density can be increased about 10% with retained com<strong>for</strong>t experience,<br />
as shown in the example in section 2.<br />
Compartments with fewer than four seats side-by-side increase costs substantially. A few<br />
Swedish passengers do prefer compartments, but most prefer open saloons and the average<br />
valuation of compartments is negative. The conclusion is that compartments should be<br />
avoided as a general <strong>for</strong>m of interior.<br />
The majority of the passengers display substantial willingness-to-pay <strong>for</strong> sitting face-to-back<br />
(most) or face-to-face (fewer). So interiors with only one of these furnishing alternatives is a<br />
com<strong>for</strong>t reducing mistake.<br />
There are many other com<strong>for</strong>t and on-board service measures that should be profitable, such<br />
as good ventilation (AC or individual air outlets), a table at your seat, reading lights and music<br />
outlets.<br />
There are also many measures regarding train size and traffic service concepts that have not<br />
been analysed yet.<br />
19
5. Summary and outlook<br />
Models which can help design passenger rail systems with greater competitiveness and financial<br />
strength have been developed. These include cost and valuation models/methods.<br />
Discussion of the cost calculations<br />
The cost model that has been developed is fairly simple. It is useful <strong>for</strong> identifying the importance<br />
of various measures to reduce costs. The cost elasticity concept is so simple that people<br />
may wonder why it is not used on a wider scale. The cost model has so far been used <strong>for</strong><br />
Swedish train services but other cost data can of course be inputted.<br />
The idea that trains can be spacious because space is cheap in trains is contradicted by the<br />
high cost elasticity of space utilisation. This make it important to investigate the passengers'<br />
willingness to pay <strong>for</strong> space and com<strong>for</strong>t measures.<br />
Discussion of computer aided interviewing<br />
Computer aided interviewing is efficient. Per<strong>for</strong>ming a small-scale SP study (say 200 respondents)<br />
with the help of computers takes just a few weeks, including the analysis. In paper interviews,<br />
the time <strong>for</strong> coding and manually setting up assessment models is added.<br />
The rate of useful answers is very high in computer interviews. Almost the only reason <strong>for</strong><br />
missing data is when people stop answering. In paper questionnaires on the other hand, the<br />
number of missing answers can be fairly high.<br />
We can now look <strong>for</strong>ward to new types of inexpensive, lightweight computers. They should<br />
have graphical screens, a long battery life, touch screens and an operating system that can run<br />
modern CASI interview programs. Regrettably no such modern interviewing system has yet<br />
been found, in spite of extensive search on the market in the spring 2003. (On the other hand,<br />
our DOS based pocket computers together with MINT interviewing program still work.)<br />
Transport modelling and valuation methods<br />
Transport models are often made <strong>for</strong> travel <strong>for</strong>ecasting purposes. In my work, <strong>for</strong>ecasting has<br />
not been in focus. Instead, models which can help design passenger rail systems with greater<br />
competitiveness and financial strength have been developed. For this work, tools that are the<br />
equivalent of or similar to those used by traffic planners have been employed.<br />
Discussion of the attribute-based methods<br />
Attribute-based methods were introduced as a way to simplify interviewing when we were<br />
interested in a large number of attributes (10-30). The methods are perhaps not as effectively<br />
underpinned in theoretical terms as the alternative-based SP methods. I do not recommend<br />
that an attribute-based SP experiment be used alone in a study. Instead, it can be seen as a<br />
complement to traditional SP or combined experiments, as it was in the package study presented<br />
here.<br />
20
Willingness to pay or to accept?<br />
Using terms such as value, valuation or even willingness-to-pay (wtp) does not always mean<br />
that passengers are actually willing to pay higher ticket prices if the measures are implemented.<br />
In Swedish trains, where my studies have been conducted, many of the investigated<br />
attributes have already been implemented at the ”high” level. For example, most of the trains<br />
already have fairly com<strong>for</strong>table seats with reclining seatbacks, 20 cm of legroom, a mixture of<br />
face-to-face and face-to-back seating, tables and individual reading lamps and a café. So the<br />
valuations in many cases should be understood as the negative value if the standard is reduced.<br />
Validation of the valuation results<br />
As in other research, it is desirable to validate the results. The problem as I see it is that, at<br />
least when it comes to the valuations, there is no key, no true answers. However, there are<br />
other studies to compare with and it is possible to obtain some idea of the quality.<br />
The main problem that has to be investigated further is the probable over-estimation of many<br />
com<strong>for</strong>t and on-board service attributes; so called secondary attributes. A study that really<br />
underlines this problem is the one by Wardman [18]. According to this, the over-estimation<br />
by most studies is very high.<br />
The package study (see chapter 3) was designed to reduce the anticipated over-valuation normally<br />
obtained when separate attributes are used in traditional SP experiments. However, the<br />
result indicates almost the same, high values <strong>for</strong> train-related attributes as in earlier studies<br />
with separate attributes. This result is good, but it contradicts the findings in other studies [2,<br />
9, 16, 20] relating to powerful packaging effects.<br />
Is there any example of a train service where the conditions have been improved and the<br />
payment increased? The answer is that there are some positive indications; when the X2000<br />
was introduced, ticket prices were raised by about as much as the value placed on the reduced<br />
travelling time and improvement in com<strong>for</strong>t. Even so, the number of passengers increased.<br />
Another example is the impressive increase in travel on trains in Blekinge. The luxury Danish<br />
IC/3, marketed under the name of ”Kustpilen”, replaced simple rail-bus services in 1991. The<br />
number of travellers increased by almost 200% in the first four years [14]. The timetable improvements<br />
and price decrease alone cannot explain this increase. It was concluded that a<br />
large part of the increase was due to the enhanced com<strong>for</strong>t and on-board service. The latest<br />
Swedish example is the success by Svealandsbanan with its fast and com<strong>for</strong>table trains [5].<br />
Travelling has increased by about 600 %.<br />
Conclusion<br />
The combination of a simplistic model <strong>for</strong> the identification of cost drivers, practical methods<br />
<strong>for</strong> the investigation of travellers' valuations and a percentage based cost benefit analysis has<br />
produced very valuable results <strong>for</strong> the railway industry (including operators, vehicle manufacturers<br />
and society).<br />
Using these methods in other railways will probably show that regional rail commuters have<br />
higher valuation of com<strong>for</strong>t than many of today’s trains fulfil. People who travel by train over<br />
21
200 days per year are willing to pay <strong>for</strong> high train standard. It is also, in many cases, beneficial<br />
even <strong>for</strong> the operator to run the trains at higher speeds.<br />
Acknowledgements<br />
I am thankful to Dr. Staffan Widlert who introduced me into the world of stated preference<br />
methods in the 1990:s. Dr. Christer Lindh is a good discussion partner and Professor Bo-<br />
Lennart Nelldal is our inspiring leader at the group <strong>for</strong> rail planning research at KTH.<br />
22
References<br />
[1] Banverket, Beräkningshandledning, (Calculation manual, in Swedish), BVH 106<br />
[2] Bates J., Use of Stated Preference <strong>Methods</strong> to determine London Underground Passenger<br />
Priorities<br />
[3] Bates, J., Reflections on Stated Preference Theory and Practice, unpublished paper from John<br />
Bates Services,<br />
[4] Baumgartner, J.P., Orders of magnitude of costs in the railway sector, EPFL Ecole Polytechnique<br />
Fédérale de Lausanne, Institut des Transports et de Planification, 1996, Report <strong>for</strong><br />
UNIFE<br />
[5] Fröidh, O., Introduction of reginal high speed trains, PhD thesis, Div. of Transportation &<br />
Logistics, KTH, TRITA-INFRA 03-041, ISRN KTH/INFRA--03/041--SE, 2003<br />
[6] Gissel, Stine, Decision aid methods <strong>for</strong> railway infrastructure pallning, PhD thesis, Report 4<br />
1999, Dep. of Planning, Technical University of Denmark<br />
[7] Hensher, D., Stated preference analysis of travel choices: the state of practice, Transportation<br />
vol 21, No2 May 1994, pp 107-134<br />
[8] Hensher, D., Louviere, J., Swait, D., Stated Choice <strong>Methods</strong>; Analysis and Application,<br />
Cambridge University Press, 2000<br />
[9] Jones, P., Addressing the Packaging Problem in Stated Preference Studies, European Transport<br />
Forum (PTRC), September 1997<br />
[10]Kottenhoff, K, Utvärdering av dubbeldäckat tåg "Competence" (in Swedish), Traffic & Transport<br />
Planning, KTH, June 1999<br />
[11]Kottenhoff, K., Evaluation of Passenger Train Concepts – <strong>Methods</strong> methods and results of<br />
measuring preferences in relation to costs, KTH Traffic & Transport Planning, PhD thesis,<br />
TRITA-IP FR 99-48, ISRN KTH/IP/FR--99/48--SE<br />
[12]Kottenhoff, K, Passenger preferences in terms of timetable, com<strong>for</strong>t and on-board service<br />
attributes - evaluated using a stated preference method with reduced package effects, KTH<br />
Traffic Planning, TRITA-IP AR 00-87, ISRN KTH/IP/AR--00/87--SE, 2000<br />
[13]Kottenhoff, K., Swedish studies of reasons and scale of the package effects in stated preference<br />
studies, Eupropean Transport Forum (PTRC), 2000<br />
[14]Lindh, C., Kottenhoff, K., The value and effects of introducing high standard train and bus<br />
concepts in Blekinge, Sweden, Transport Policy, 1995 Vol.2, No.4<br />
23
[15]Lundin, A., Steen, M., Metodstudier i stated preferences. SP-metodens känslighet för olika<br />
ut<strong>for</strong>mning av datainsamling, (Methodological studies in Stated Preferences. The sensitivity to<br />
various ways of collecting SP data, in Swedish), KTH Traffic & Transport Planning, Master<br />
thesis No.1993:6, TRITA-TPL-93-11-95, 1993<br />
[16]Schmidt, L., Värdeminskning vid värdering av tågkoncept (Value reduction when evaluating<br />
train concepts – a study of com<strong>for</strong>t, service and timetable packages with SP methodology, in<br />
Swedish), KTH Traffic Planning, Master Thesis No. 1996:44, TRITA AR 96-44, 1996<br />
[17]Thurstone, L.L., The measurement of values, The University of Chicago Press, 1959<br />
[18]Wardman, M., Whelan, G., Rolling stock quality improvements and user willingness to pay,<br />
ITS working paper 523, Leeds, March 1998<br />
[19]Widlert, Staffan. Stated Preference Studies – The Designs Affects the Results, 7th int. congress<br />
on travel behaviour, Santiago Chile, 1994<br />
[20]Widlert, S., Gärling, T., Uhlin, S., Värdering av kollektivtrafikens standard, (Valuation of the<br />
standard of public transport, in Swedish), TFB Report 1989:2, ISBN 91-87246-39-2, June<br />
1989<br />
24