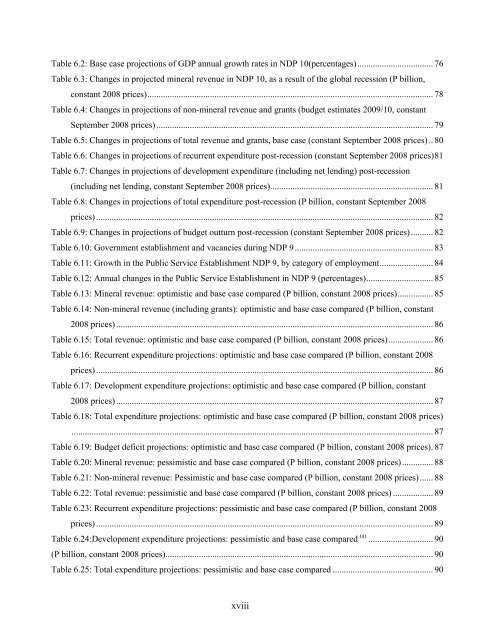
- Page 1 and 2: Pages LIST OF TABLES --------------
- Page 3 and 4: Strategy for a Land-Locked Country
- Page 5 and 6: Improving Efficiency and Effectiven
- Page 7 and 8: Capacity Building -----------------
- Page 9 and 10: SECTOR: LABOUR --------------------
- Page 11 and 12: New and Renewable Sources of Energy
- Page 13 and 14: A COMPASSIONATE, JUST AND CARING NA
- Page 15 and 16: STRATEGIES FOR NDP 10 -------------
- Page 17: LIST OF TABLES Table 1.1 Administra
- Page 21 and 22: LIST OF CHARTS AND FIGURES Chart 2.
- Page 23 and 24: FOREWORD The tenth National Develop
- Page 25 and 26: INTRODUCTION This tenth National De
- Page 27 and 28: ABBREVIATIONS AND ACRONYMS AEIN AGC
- Page 29 and 30: DIS DIT DIV DLGD DLS DMS DNFE DOTS
- Page 31 and 32: LSU M&E MCM MCST MDG MDRF MEA MERCO
- Page 33 and 34: SKIP SLIMS SLMS SME SMME SOE SOER S
- Page 35 and 36: SECTION 1: INTRODUCTION 1
- Page 37 and 38: and the Botswana Congress Party (BC
- Page 39 and 40: Table 1.1 Administrative Districts
- Page 41 and 42: Temperatures 1.17 The mean monthly
- Page 43 and 44: Map 1.3: Annual Rainfall Distributi
- Page 45 and 46: Natural Resources 1.19 The natural
- Page 47 and 48: 1.23 Factors such as declining infa
- Page 49 and 50: CHAPTER 2 POPULATION AND DEVELOPMEN
- Page 51 and 52: (MOESD) uses the statistic for net
- Page 53 and 54: target of reducing fertility to 3.4
- Page 55 and 56: 2.22 In addition, the National Sett
- Page 57 and 58: groups of vulnerable people; lack o
- Page 59 and 60: CHAPTER 3 NDP 10 PLANNING APPROACH
- Page 61 and 62: implementation commenced on 1 st 20
- Page 63 and 64: The Integrated Results Based Manage
- Page 65 and 66: CHART 3.1: CASCADING VISION 2016 IN
- Page 67 and 68: SECTION II: MACRO CHAPTERS 33
- Page 69 and 70:
Economic Development since Independ
- Page 71 and 72:
4.18 GDP growth was estimated to ha
- Page 73 and 74:
Table 4.5: Revised growth targets f
- Page 75 and 76:
undertaken during NDP 10, in order
- Page 77 and 78:
Table 4.9: Budget balance, outturn
- Page 79 and 80:
over the 10 years since the 1995/96
- Page 81 and 82:
International Trade Balance of Paym
- Page 83 and 84:
the other hand, the high level of t
- Page 85 and 86:
Table 4.17: Service exports 2003-08
- Page 87 and 88:
producer's costs will almost certai
- Page 89 and 90:
term will eventually require govern
- Page 91 and 92:
5.16 A further advantage is that th
- Page 93 and 94:
numbers of people. It is therefore
- Page 95 and 96:
5.43 These are the underlying argum
- Page 97 and 98:
Table 5.1: Changes in real bilatera
- Page 99 and 100:
anticipation of policy direction by
- Page 101 and 102:
PRIVATE SECTOR DEVELOPMENT STRATEGY
- Page 103 and 104:
Negative External Perceptions of th
- Page 105 and 106:
Public Sector Infrastructure and Se
- Page 107 and 108:
CHAPTER 6 PROJECTIONS OF GOVERNMENT
- Page 109 and 110:
quarter, and by 20.0 percent on an
- Page 111 and 112:
forms of private sector activity wi
- Page 113 and 114:
growth in the last three years of t
- Page 115 and 116:
Table 6.6: Changes in projections o
- Page 117 and 118:
y the end of NDP 9. They continued
- Page 119 and 120:
Table 6.12: Annual changes in the P
- Page 121 and 122:
Table 6.17: Development expenditure
- Page 123 and 124:
Table 6.22: Total revenue: pessimis
- Page 125 and 126:
SECTION III: EDUCATED AND INFORMED
- Page 127 and 128:
the economy grew, other sectors sou
- Page 129 and 130:
and objective budget process for fu
- Page 131 and 132:
year during NDP 9, while Chart 7.3
- Page 133 and 134:
programmes commenced, which gave sp
- Page 135 and 136:
Science and Technology, Finance and
- Page 137 and 138:
equirements met and the percentage
- Page 139 and 140:
special needs, children in remote a
- Page 141 and 142:
access for disadvantaged children a
- Page 143 and 144:
REVIEW OF NDP 9 Public Service Huma
- Page 145 and 146:
Competency-Based Human Resource Man
- Page 147 and 148:
productivity database, providing ea
- Page 149 and 150:
CHAPTER 8 KNOWLEDGE SOCIETY KEY RES
- Page 151 and 152:
Goal Strategies for NDP 10 8.9 The
- Page 153 and 154:
Table 8.2: Telecommunications Subsc
- Page 155 and 156:
per permanent postal outlet in the
- Page 157 and 158:
Botswana Innovation Hub 8.40 During
- Page 159 and 160:
8.49 During NDP 10, the postal comm
- Page 161 and 162:
communications services. Kitsong Ce
- Page 163 and 164:
Innovation, Research and Developmen
- Page 165 and 166:
CHAPTER 9 SUSTAINABLE ECONOMIC GROW
- Page 167 and 168:
9.11 NDP 10 represents a watershed
- Page 169 and 170:
market development; implementation
- Page 171 and 172:
Chart 9.1: Commercial Bank Deposits
- Page 173 and 174:
Chart 9.2: Botswana Stock Exchange
- Page 175 and 176:
Chart 9.3: Pension Fund Total Asset
- Page 177 and 178:
establish a Financial Intelligence
- Page 179 and 180:
cooperatives, and a role for new or
- Page 181 and 182:
policy during NDP 10 is to align ef
- Page 183 and 184:
SECTOR: TRADE AND INDUSTRY INTRODUC
- Page 185 and 186:
the Southern Cone (MERCOSUR) was si
- Page 187 and 188:
2008, covering investment and trade
- Page 189 and 190:
eviewed to ensure that it fully com
- Page 191 and 192:
Cluster Model Strategy 9.107 MTI ha
- Page 193 and 194:
Chart 9.5: Value of Purchases under
- Page 195 and 196:
communication technology, the revol
- Page 197 and 198:
FDI will contribute to employment c
- Page 199 and 200:
exports, government revenue and GDP
- Page 201 and 202:
ough diamond production value of US
- Page 203 and 204:
Block. Following completion of the
- Page 205 and 206:
Chart 9.7: Composition of Non-Tax M
- Page 207 and 208:
Chart 9.9: Copper and Nickel Prices
- Page 209 and 210:
Chart 9.10: Reportable Accidents 20
- Page 211 and 212:
Table 9.5: Employment in the Minera
- Page 213 and 214:
implemented to promote citizen part
- Page 215 and 216:
Sector Performance Matrix 9.2: Mine
- Page 217 and 218:
(mainly sorghum and maize) varies c
- Page 219 and 220:
Commonwealth Secretariat. On-farm r
- Page 221 and 222:
Table 9.10: Production of Cereals a
- Page 223 and 224:
operational horticultural markets e
- Page 225 and 226:
deficient. This strategy is aimed a
- Page 227 and 228:
SUMMARY OF PROGRAMMES Arable Agricu
- Page 229 and 230:
SECTOR: TOURISM INTRODUCTION 9.272
- Page 231 and 232:
As indicated in Table 9.13, there h
- Page 233 and 234:
SECTOR STRATEGIES 9.290 The challen
- Page 235 and 236:
Planning and Regulation 9.306 The r
- Page 237 and 238:
REVIEW OF NDP 9 Labour Laws 9.313 I
- Page 239 and 240:
• The review of labour laws; •
- Page 241 and 242:
Sector Outcome/ Output Outcome 1: T
- Page 243 and 244:
of access, quality and efficiency.
- Page 245 and 246:
increase. The share of heavy commer
- Page 247 and 248:
Morwamosu, Middlepits-Bokspits, Tsh
- Page 249 and 250:
evived during NDP 9. The additional
- Page 251 and 252:
development of Botswana’s communi
- Page 253 and 254:
main challenge is establishing a me
- Page 255 and 256:
of being absorbed into general gove
- Page 257 and 258:
a fleet of this size presents a sev
- Page 259 and 260:
10.103 Currently there are 24 stora
- Page 261 and 262:
REVIEW OF NDP 9 10.113 During NDP 9
- Page 263 and 264:
However, the quality monitoring for
- Page 265 and 266:
STRATEGIES FOR NDP 10 10.135 The ND
- Page 267 and 268:
percent (57 MCM) of developed water
- Page 269 and 270:
esources. During NDP 10, the follow
- Page 271 and 272:
10.164 The energy sector contributi
- Page 273 and 274:
Southern African Power Pool’s sho
- Page 275 and 276:
Chart 10.4: Access to Electricity i
- Page 277 and 278:
facility. This has compelled the Go
- Page 279 and 280:
annual production of about one mill
- Page 281 and 282:
• The Botswana Energy Champion co
- Page 283 and 284:
egional power supply/demand imbalan
- Page 285 and 286:
existing energy sources and improvi
- Page 287 and 288:
order to augment existing land reso
- Page 289 and 290:
allocated without services. This co
- Page 291 and 292:
of plots. Guidelines will be drafte
- Page 293 and 294:
the Land Boards, Department of Land
- Page 295 and 296:
• Uncoordinated involvement of th
- Page 297 and 298:
PROGRAMME SUMMARIES Infrastructure
- Page 299 and 300:
CHAPTER 11 SUSTAINABLE ENVIRONMENT
- Page 301 and 302:
number of stations and shortage of
- Page 303 and 304:
private sector have become active i
- Page 305 and 306:
mainly due to commercialisation. Th
- Page 307 and 308:
decision making, improved environme
- Page 309 and 310:
PROGRAMME SUMMARIES Environmental P
- Page 311 and 312:
Monument Development Programme 11.6
- Page 313 and 314:
NDP 10, Goal 1: Eradication of abso
- Page 315 and 316:
Goal Strategies 12.16 The country h
- Page 317 and 318:
formulation and legislative reviews
- Page 319 and 320:
Public Works Programme (LIPWP) and
- Page 321 and 322:
SECTOR: HOUSING (SOCIAL) Descriptio
- Page 323 and 324:
Sector Goals, Indicators, Baselines
- Page 325 and 326:
NDP 10 Goal 3: Indicators, Baseline
- Page 327 and 328:
12.60 The World Health Organisation
- Page 329 and 330:
Goal: Reduce Infant and Maternal Mo
- Page 331 and 332:
development of short, medium and se
- Page 333 and 334:
went from 25.3 percent in 2004 to 2
- Page 335 and 336:
others, activities such as scaling-
- Page 337 and 338:
CHAPTER 13 SAFE, SECURE AND PEACEFU
- Page 339 and 340:
• Improved collaboration with str
- Page 341 and 342:
around 2.7 percent of accidents are
- Page 343 and 344:
. SUMMARY OF PROGRAMMES/PROJECTS LI
- Page 345 and 346:
• Implementation of the National
- Page 347 and 348:
SUMMARY OF PROGRAMMES/PROJECTS LINK
- Page 349 and 350:
Sector Performance Matrix Matrix 13
- Page 351 and 352:
assessment study and the developmen
- Page 353 and 354:
from peace to conflict takes a very
- Page 355 and 356:
visits, and facilitate adherence to
- Page 357 and 358:
14.7 The first two sector goals res
- Page 359 and 360:
productivity and work ethics, proje
- Page 361 and 362:
the international arena. However, 6
- Page 363 and 364:
14.37 Anti-corruption: A corruption
- Page 365 and 366:
such as the Industrial Court, Court
- Page 367 and 368:
gave all prosecutorial functions to
- Page 369 and 370:
as debt collection, taxation of bil
- Page 371 and 372:
SECTOR: LEGISLATURE INTRODUCTION 14
- Page 373 and 374:
explore other outreach and educatio
- Page 375 and 376:
Sector Performance Matrix Matrix 14
- Page 377 and 378:
CHAPTER 15 A UNITED, PROUD, MORAL A
- Page 379 and 380:
a national research policy and esta
- Page 381 and 382:
• Faith-based Institutions will p
- Page 383 and 384:
15.22 The mandate of the Department
- Page 385 and 386:
the State of the Nation Address, as
- Page 387 and 388:
SECTION VII: MONITORING AND EVALUAT
- Page 389 and 390:
16.7 To effectively address the abo
- Page 391:
16.17 Roles and responsibilities of


