Regional Land Transport Programme 2009 - 2010 (2MB) - Auckland ...
Regional Land Transport Programme 2009 - 2010 (2MB) - Auckland ...
Regional Land Transport Programme 2009 - 2010 (2MB) - Auckland ...

Create successful ePaper yourself
Turn your PDF publications into a flip-book with our unique Google optimized e-Paper software.
<strong>2009</strong>/10–2011/12 AUCKLAND<br />
REGIONAL LAND TRANSPORT PROGRAMME<br />
www.arta.co.nz
CHAIRMAN’S FOREWORD<br />
Following three successful <strong>Land</strong> <strong>Transport</strong> <strong>Programme</strong>s prepared by<br />
ARTA, this is the first <strong>Regional</strong> <strong>Land</strong> <strong>Transport</strong> <strong>Programme</strong> (RLTP)<br />
since the passing of the <strong>Land</strong> <strong>Transport</strong> Management Amendment<br />
Act (2008), which increased the scope, duration and importance of<br />
the programme.<br />
ARTA now prepares a prioritised programme of transport activities<br />
for the <strong>Auckland</strong> region which extends for three years and which, for<br />
the first time includes State highway activities, along with local<br />
authority activities and ARTA’s own plans and services. In this RLTP,<br />
over 950 projects, worth $4.36 billion, have been prioritised. The<br />
programme is a major milestone in the journey to deliver a fully<br />
integrated programme of transport initiatives for <strong>Auckland</strong>.<br />
In this RLTP, ARTA prioritises land transport projects for the region.<br />
This prioritisation is based on ARTA’s identification of issues facing<br />
<strong>Auckland</strong>’s transport system both now and in the future, and the<br />
process developed by the <strong>Auckland</strong> <strong>Transport</strong> Plan in ensuring<br />
effective solutions that offer value for money.<br />
The Government’s Policy Statement (GPS) for the prioritisation of<br />
funding for land transport, which came into effect on 1 July this year,<br />
has also been taken into consideration. The Government’s stated<br />
priority is for land transport investment to support national economic<br />
growth and productivity, particularly by improving journey time<br />
reliability and the easing of severe congestion.<br />
The inclusion of State highways, for the first time, has enhanced the<br />
programme’s focus on not only the importance of strengthening<br />
<strong>Auckland</strong>’s links with its neighbouring regions, with which it has close<br />
economic ties, but also the importance of producing an integrated<br />
multi-modal solution for addressing <strong>Auckland</strong>’s transport challenges.<br />
It is with pleasure that ARTA produces the first tri-annual <strong>Regional</strong><br />
<strong>Land</strong> <strong>Transport</strong> <strong>Programme</strong> for the <strong>Auckland</strong> region.<br />
Rabin Rabindran<br />
Chairman<br />
ARTA Board<br />
i
CONTENTS<br />
CHAIRMAN’S FOREWORD ................................................................................................................... i<br />
EXECUTIVE SUMMARY....................................................................................................................... iii<br />
1 INTRODUCTION ............................................................................................................................. 1<br />
2 CONTEXT ....................................................................................................................................... 2<br />
ARTA’s Role...................................................................................................................................... 2<br />
ARTA’s Partners ................................................................................................................................ 4<br />
What’s New in this <strong>Regional</strong> <strong>Land</strong> <strong>Transport</strong> <strong>Programme</strong> .................................................................. 6<br />
3 AUCKLAND’S TRANSPORT CHALLENGES .................................................................................... 7<br />
Long-term Challenges ..................................................................................................................... 7<br />
Shorter-term Challenges ................................................................................................................ 12<br />
4 STATEMENT OF PRIORITIES ........................................................................................................ 13<br />
Strategic Focus Areas ..................................................................................................................... 13<br />
Region-wide and Sub-regional Priorities ......................................................................................... 17<br />
5 THE <strong>2009</strong>/12 PROGRAMME ........................................................................................................20<br />
The <strong>Auckland</strong> RLTP Preparation Process ..........................................................................................20<br />
Major Activities in the <strong>2009</strong>/10–2011/12 <strong>Programme</strong> .................................................................... 21<br />
GPS Funding Allocations and Requested Funds .............................................................................. 24<br />
Summary of the RLTP by Activity Class ........................................................................................... 26<br />
6 FUNDING PLAN ........................................................................................................................... 31<br />
Ten-year Funding Forecast ............................................................................................................. 31<br />
R and C Funding ............................................................................................................................ 32<br />
Unsubsidised Schemes ................................................................................................................... 33<br />
7 ROAD POLICING ACTIVITIES ....................................................................................................... 34<br />
8 MONITORING .............................................................................................................................. 36<br />
Implementing the <strong>Regional</strong> <strong>Land</strong> <strong>Transport</strong> Strategy ....................................................................... 36<br />
Further Monitoring ........................................................................................................................ 39<br />
9 SIGNIFICANCE POLICY ................................................................................................................ 40<br />
10 DETAILED <strong>2009</strong>/12 FUNDING REQUESTS ................................................................................... 41<br />
APPENDIX 1: AUCKLAND RLTP’S LEGISLATIVE REQUIREMENTS ..................................................... 78<br />
APPENDIX 2: PRIORITISATION PROCESS .......................................................................................... 79<br />
GLOSSARY ......................................................................................................................................... 86<br />
ii
EXECUTIVE SUMMARY<br />
This <strong>Regional</strong> <strong>Land</strong> <strong>Transport</strong> <strong>Programme</strong> (RLTP) is the first to be<br />
developed by ARTA since the implementation of the <strong>Land</strong> <strong>Transport</strong><br />
Management Amendment Act (LTMA) 2008. The RLTP prioritises<br />
the planned transport activities of <strong>Auckland</strong>’s local authorities, the<br />
<strong>Auckland</strong> <strong>Regional</strong> Council, ARTA and the New Zealand <strong>Transport</strong><br />
Agency (Highways and Network Operations (HNO, formally Transit<br />
New Zealand)) for which government funding is sought from<br />
the New Zealand <strong>Transport</strong> Agency (NZTA) over the following<br />
three years.<br />
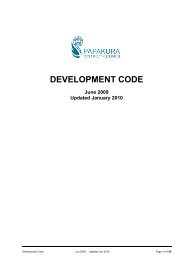
In this RLTP, over 950 projects, worth $4.36 billion, have been<br />
prioritised. The funding sought from NZTA for these projects is<br />
$3.19 billion. The remainder will be funded from local sources. Key<br />
major projects proposed for construction during the period of this<br />
RLTP are shown in Figure 1.<br />
Although this is a three-year RLTP, transport investment is long-term<br />
and it is important to identify the long-term drivers shaping the<br />
future of <strong>Auckland</strong>’s transport network. The first is <strong>Auckland</strong>’s<br />
population growth, which is expected to reach 2 million people<br />
before 2036 and 2.3 million by 2050. Most of the growth will take<br />
place in the urbanised parts of the region. The growth to 2036 alone<br />
will be larger than the current population of any other New Zealand<br />
city and is driving a strong increase in the demand for travel. By 2050,<br />
the transport system will be expected to enable 5.2 million person<br />
trips to be made each day – an increase of 65% from current levels.<br />
The other key driver is the need to support and strengthen the<br />
transport links between <strong>Auckland</strong> and its neighbouring regions with<br />
which it has close economic ties. Together, the regional economies of<br />
<strong>Auckland</strong>, Northland, Waikato and the Bay of Plenty generate 51%<br />
of the country’s Gross Domestic Product and are home to 51% of its<br />
population. By 2036, this is expected to grow to just under 60%.<br />
In this RLTP, there is good progress towards developing and completing<br />
the strategic roading network with many key State highway projects<br />
underway, such as the Hobsonville deviation, the Manukau Harbour<br />
Crossing, the State Highway 20 to State Highway 1 connection and<br />
the Newmarket Viaduct replacement. There is also an increase in<br />
funding for public transport service improvements, which have<br />
been particularly successful in increasing patronage on the rail<br />
network and Northern Busway – both of which have contributed<br />
significantly to reducing peak congestion on adjacent motorway and<br />
arterial road corridors.<br />
On the other hand, while there are a number of projects in this RLTP<br />
aimed at improvements to the regional arterial road network, there is<br />
potential for greater investment in <strong>Auckland</strong>’s regional arterial road<br />
network which is key to the economic prosperity of the region. The<br />
regional arterial roading network comprises only 4% of the length of<br />
the total roading network but carries 18% of all freight and<br />
commercial journeys, and almost half of all bus passenger transport<br />
trips, and 15% of all peak-hour travel and 24% of road crashes are<br />
on regional arterials.<br />
A key issue that has been highlighted in the development of this RLTP<br />
is the strong downward pressure on the local share of funding for<br />
projects in these tough economic times and the need to minimise<br />
local rates increases. This is an important factor holding back<br />
investment in the regional arterial road network and public transport<br />
services and infrastructure investment, which are dependent on<br />
achieving around a 50% local funding share.<br />
Within the three-year time period of this RLTP, the territorial<br />
authorities, ARC and ARTA will cease to exist, however, their functions<br />
and responsibilities will be taken over by the <strong>Auckland</strong> Council.<br />
In the face of these strategic drivers, the overall long-term land<br />
transport challenges facing <strong>Auckland</strong> are to:<br />
><br />
><br />
><br />
><br />
Complete the work underway to deliver a properly connected<br />
strategic and arterial roading network.<br />
Manage the use of this roading network as the primary mover of<br />
freight, commercially important trips and other trips that cannot<br />
be made by public transport.<br />
Accelerate the delivery of a step change improvement in public<br />
transport and active modes.<br />
Maintain and improve <strong>Auckland</strong>’s inter-regional road and rail<br />
connections with its neighbouring regional economies.<br />
These challenges have been taken into account when prioritising<br />
projects, together with a profiling methodology that ensures that the<br />
RLTP gives effect to the <strong>Regional</strong> <strong>Land</strong> <strong>Transport</strong> Strategy (RLTS) and<br />
is consistent with the <strong>2009</strong> Government Policy Statement (GPS).<br />
iii
iv<br />
Figure 1: Major Construction Projects
1 INTRODUCTION<br />
This <strong>Regional</strong> <strong>Land</strong> <strong>Transport</strong> <strong>Programme</strong> (RLTP) has been prepared<br />
by the <strong>Auckland</strong> <strong>Regional</strong> <strong>Transport</strong> Authority (ARTA). The RLTP<br />
prioritises planned transport activities for the following three years<br />
which qualify for government funding through the New Zealand<br />
<strong>Transport</strong> Agency (NZTA).<br />
ARTA is required to prepare a RLTP every three years covering all<br />
transport activities undertaken by the NZTA HNO, <strong>Auckland</strong> local<br />
authorities and ARTA. Its mandate covers the <strong>Auckland</strong> region and all<br />
land transport modes except rail track responsibilities. In preparing<br />
the RLTP, ARTA provides a view on the land transport priorities for the<br />
region, as well as the future programmes of other transport agencies<br />
acting in the region. The legislative requirements relating to the<br />
<strong>Auckland</strong> RLTP are summarised in Appendix 1.<br />
This <strong>Auckland</strong> RLTP details the funding applications for the <strong>2009</strong>/10,<br />
<strong>2010</strong>/11 and 2011/12 years. ARTA’s main task is to prioritise these<br />
funding applications so that, when there is insufficient funding to<br />
carry out all the activities that the region may wish to see proceed,<br />
the most important schemes are funded first. This prioritisation is<br />
based on ARTA’s identification of the issues facing <strong>Auckland</strong>’s<br />
transport system both now and in the future. The prioritisation<br />
process is contained in the <strong>Auckland</strong> <strong>Transport</strong> Plan (ATP), which is<br />
also prepared by ARTA.<br />
Greenlane roading improvements (now completed)<br />
1
2 CONTEXT<br />
ARTA’s Role<br />
Established in 2004 as New Zealand’s first regional transport authority,<br />
ARTA is responsible for integrating all the land transport modes used<br />
to move people and goods around <strong>Auckland</strong>. ARTA does this by<br />
being the only transport authority in the region with an overall,<br />
multi-modal regional view of transport priorities, unconstrained by<br />
territorial boundaries and working collaboratively with each agency<br />
involved in developing and improving <strong>Auckland</strong>’s transport system.<br />
ARTA’s enabling legislation, the Local Government (<strong>Auckland</strong>)<br />
Amendment Act 2004 (LGAAA), sets out ARTA’s objective:<br />
“To plan, fund and develop the <strong>Auckland</strong> regional land<br />
transport system in a way that contributes to an integrated,<br />
safe, responsive, and sustainable land transport system for the<br />
<strong>Auckland</strong> region.”<br />
The <strong>Auckland</strong> regional land transport system is defined as “land<br />
transport within the <strong>Auckland</strong> region managed by <strong>Auckland</strong>’s local<br />
authorities, NZTA Highways Network and Operations (HNO formerly<br />
Transit), ARTA and <strong>Auckland</strong> <strong>Regional</strong> Holdings”.<br />
ARTA’s roles can be defined under the following broad headings:<br />
The operational planner for the <strong>Auckland</strong> regional land<br />
transport system<br />
The overall transport strategy for the <strong>Auckland</strong> region is set by the<br />
2005 <strong>Auckland</strong> <strong>Regional</strong> <strong>Land</strong> <strong>Transport</strong> Strategy (RLTS), prepared by<br />
the <strong>Auckland</strong> <strong>Regional</strong> Council. However, <strong>Auckland</strong>’s current RLTS<br />
cannot identify or prioritise transport projects. The <strong>Land</strong> <strong>Transport</strong><br />
Management Amendment Act (LTMA) 2008 will enable the next<br />
RLTS to specify regionally significant projects. Under current<br />
legislation, the project specification and prioritisation role is<br />
allocated to:<br />
A key element of the policy framework is the <strong>Auckland</strong> <strong>Transport</strong><br />
Plan (ATP). The ATP translates the high-level policies and strategies of<br />
the RLTS into a single implementation plan, and outlines the priorities<br />
and phasing of specific projects over the next ten years, for all<br />
agencies and modes.<br />
This RLTP is the first to be created since the implementation of the<br />
<strong>Land</strong> <strong>Transport</strong> Management Amendment Act 2008. The Act requires:<br />
> Introduction of a Government Policy Statement (GPS) setting out<br />
the Government’s high-level priorities for land transport.<br />
> Introduction of three-yearly <strong>Regional</strong> <strong>Land</strong> <strong>Transport</strong> <strong>Programme</strong>s<br />
that will identify all land transport activities in each region.<br />
> A three-yearly National <strong>Land</strong> <strong>Transport</strong> <strong>Programme</strong>.<br />
> The creation of the New Zealand <strong>Transport</strong> Agency, which<br />
has been formed by combining functions of <strong>Land</strong> <strong>Transport</strong><br />
New Zealand and Transit New Zealand.<br />
> Introduction of full hypothecation (dedication) of fuel excise<br />
duty obtained from motorists to be reserved for land transport<br />
purposes.<br />
> ARTA develops and approves the <strong>Auckland</strong> RLTP.<br />
> The <strong>Auckland</strong> RLTS developed for at least a 30-year timeframe<br />
and able to identify projects of high regional significance.<br />
><br />
><br />
ARTA for public transport, local roading and State highways –<br />
specific activities are implemented by the territorial authorities<br />
and the NZTA.<br />
KiwiRail for railway track development.<br />
The policy framework for the RLTP is provided by a series of national,<br />
regional and local strategies and plans. The purpose of this framework<br />
is to develop an integrated, safe, responsive and sustainable land<br />
transport system. This framework is continually evolving and is shown<br />
diagrammatically in Figure 2.1.<br />
2
Figure 2.1: Plans and strategies relationships to the <strong>Auckland</strong> <strong>Regional</strong> <strong>Land</strong> <strong>Transport</strong> <strong>Programme</strong><br />
National Policy, Strategies and Legislation<br />
<strong>Auckland</strong> <strong>Regional</strong> Growth Strategy (50 years)<br />
<strong>Regional</strong> Policy Statement<br />
KiwiRail’s<br />
proposed Rail<br />
Network<br />
Development<br />
Plan (10 years)<br />
(as it relates to<br />
<strong>Auckland</strong>)<br />
<strong>Regional</strong> <strong>Land</strong> <strong>Transport</strong> Strategy (30 years)<br />
<strong>Auckland</strong> <strong>Transport</strong> Plan (Long-term (10-20-30 years)<br />
Multi-modal Integrated Implementation Plan)<br />
<strong>Regional</strong> Public<br />
<strong>Transport</strong> Plan<br />
Sustainable<br />
<strong>Transport</strong> Plan<br />
<strong>Regional</strong> Arterial<br />
Road Plan<br />
<strong>Regional</strong> Road<br />
Safety Plan<br />
KiwiRail’s<br />
Plan DART<br />
Long Term Council Community Plans<br />
New Zealand <strong>Transport</strong> Agency proposals<br />
<strong>Transport</strong> Strategies/District Plans<br />
<strong>Auckland</strong> <strong>Regional</strong> <strong>Land</strong> <strong>Transport</strong> <strong>Programme</strong> (tri-annual programme)<br />
Recommends <strong>Auckland</strong> priorities for government transport<br />
funding<br />
<strong>Transport</strong> projects are generally funded from two sources – local<br />
funds and central government funds. The latter is made available by<br />
the NZTA to “Approved Organisations”. ARTA is an Approved<br />
Organisation and, by legislation, must prepare the RLTP, covering<br />
transport activities of the <strong>Auckland</strong> local authorities, the NZTA HNO<br />
and ARTA.<br />
The regional public transport provider<br />
An effective, integrated public transport system is critical to the<br />
development of the region. ARTA has responsibility for regional<br />
public transport planning and management. Funding for public<br />
transport infrastructure and operations is sought through the<br />
<strong>Auckland</strong> RLTP, going through the same evaluation and prioritisation<br />
process as for other transport activities.<br />
It is important to note that in <strong>Auckland</strong> not all the funding for land<br />
transport is channelled through the RLTP.<br />
Figure 2.2 summarises the funding streams for land transport in the<br />
<strong>Auckland</strong> region and highlights the land transport activities and<br />
funding sources comprising this RLTP.<br />
3
Figure 2.2: Funding streams for land transport in <strong>Auckland</strong><br />
Treasury<br />
NZTA<br />
Local share by ARC and TAs:<br />
rates, tolls, developer contributions, etc.<br />
TAs<br />
KiwiRail<br />
rail network<br />
below track<br />
ARTA<br />
rail network<br />
above track and<br />
rolling stock<br />
State<br />
highways<br />
Local roads<br />
Passenger transport<br />
services (all modes)<br />
and non-rail<br />
infrastructure<br />
TDM, walk,<br />
cycle<br />
Nonsubsidised<br />
local roads<br />
<strong>Auckland</strong> RLTP<br />
Note: Funding stream for electric trains has yet to be formally agreed by the Government.<br />
ARTA’s Partners<br />
ARTA is not the implementing agency in many cases, especially for<br />
roading, and rail track and signalling projects. Therefore working<br />
with our partners and stakeholders is crucial for successful regional<br />
transport outcomes. One of ARTA’s primary aims is to improve the<br />
integration of transport activities amongst the various agencies in the<br />
<strong>Auckland</strong> region. In order to achieve this, ARTA has established<br />
strong collaborative relationships with agencies in the <strong>Auckland</strong><br />
region and nationally, as described below.<br />
Territorial Authorities<br />
There are seven territorial authorities in the <strong>Auckland</strong> region:<br />
<strong>Auckland</strong> City Council, Franklin District Council, Manukau City<br />
Council, North Shore City Council, Papakura District Council, Rodney<br />
District Council and Waitakere City Council. The territorial authorities<br />
control the roads in their areas, and are responsible for their upkeep<br />
and improvement. ARTA has developed close relationships with the<br />
territorial authorities, and provides advice on how their plans fit with<br />
regional objectives.<br />
The <strong>Auckland</strong> <strong>Regional</strong> Council (ARC)<br />
The ARC is the sole shareholder of ARTA. It provides funding for the<br />
majority of the expenditure for ARTA’s activities. ARTA annually<br />
submits a budget for public transport infrastructure and services to<br />
the ARC for inclusion in its Annual Plan.<br />
New Zealand <strong>Transport</strong> Agency (NZTA)<br />
The NZTA was formed in August 2008 by amalgamating <strong>Land</strong><br />
<strong>Transport</strong> New Zealand, which was responsible for managing the<br />
National <strong>Land</strong> <strong>Transport</strong> <strong>Programme</strong> and allocating transport funding<br />
nationally on behalf of central government, with Transit New Zealand,<br />
which was responsible for managing the State highway network<br />
across the country. NZTA HNO now submits its State highway<br />
programme to ARTA for inclusion in the RLTP. ARTA applies to the<br />
NZTA for funding of the <strong>Auckland</strong> RLTP (including ARTA’s activities).<br />
ARTA is working closely with the NZTA to integrate State highway,<br />
local roading, public transport and walking and cycling projects and<br />
ensure its State highway plans integrate with regional objectives.<br />
Central Government<br />
The Ministry of <strong>Transport</strong> (MoT) releases the Government Policy<br />
Statement on land transport funding, undertakes reviews of<br />
<strong>Auckland</strong>’s transport capabilities and guides the development of<br />
future strategies nationwide. The Ministries of Economic<br />
Development, Education, Environment, Treasury and Health, the<br />
New Zealand Police and the Accident Compensation Corporation<br />
are also involved and have an interest in improving transport in the<br />
region. Central government also directly funds KiwiRail.<br />
KiwiRail (New Zealand Railways Corporation)<br />
KiwiRail is the owner and manager of <strong>Auckland</strong>’s rail corridors and<br />
provides the track and signalling systems on which passenger and<br />
freight train services operate. ARTA works closely with KiwiRail to<br />
ensure the seamless provision of rail services.<br />
Public <strong>Transport</strong> Service Providers<br />
A wide range of transport operators supply bus, ferry and train<br />
services either under contract to ARTA or commercially (i.e. no<br />
subsidy support from ARTA).<br />
4
Tamaki Drive<br />
5
What’s New in this <strong>Regional</strong> <strong>Land</strong> <strong>Transport</strong> <strong>Programme</strong><br />
Three region-wide <strong>Land</strong> <strong>Transport</strong> <strong>Programme</strong>s have been produced<br />
by ARTA since being created in 2004. The LTMA 2008 now requires<br />
ARTA to prepare a RLTP, which has a significantly wider focus than<br />
the previous <strong>Auckland</strong> LTP.<br />
The changes to the previous <strong>Auckland</strong> LTPs can be summarised<br />
as follows:<br />
> ARTA has updated its prioritisation process to take account of<br />
the <strong>2009</strong> GPS.<br />
> State highway activities are now included in the ARTA process.<br />
> The RLTP has to include comment on police activities.<br />
In accordance with the widened scope of the RLTP, ARTA has issued<br />
guidelines outlining regional and national priorities for funding,<br />
enabling local authorities and the NZTA (State highways) to submit<br />
appropriate applications to be considered by ARTA for inclusion in<br />
the RLTP.<br />
Following consultation on this first RLTP, ARTA has considered<br />
submissions, amended the document as necessary and approved a<br />
final RLTP, which will be submitted to the NZTA. NZTA will then<br />
consider the RLTP, and prepare a National <strong>Land</strong> <strong>Transport</strong> <strong>Programme</strong><br />
which will allocate funding. Any activity that is not included in the<br />
RLTP may not be included in the NLTP, even if it is a NZTA State<br />
highway project.<br />
><br />
><br />
The RLTP now has a three-year time period.<br />
This RLTP includes packages and groups of linked projects.<br />
As this is a three-year programme and includes State highway<br />
projects, it prioritises over 950 projects, compared to around 300<br />
projects in each of the previous LTPs, as shown in Figure 2.3 below.<br />
Figure 2.3: Number of projects in past <strong>Land</strong> <strong>Transport</strong> <strong>Programme</strong>s compared with the <strong>Regional</strong> <strong>Land</strong> <strong>Transport</strong> <strong>Programme</strong><br />
Number of schemes analysed in the <strong>2009</strong>/10-2011/12 RLTP compared to the 2006/07-2008/09 LTPs<br />
1000<br />
900<br />
800<br />
700<br />
600<br />
Number of activities<br />
500<br />
400<br />
300<br />
200<br />
100<br />
0<br />
2006/07 2007/08 2008/09 <strong>2009</strong>/12<br />
LTP year<br />
6
3 AUCKLAND’S TRANSPORT CHALLENGES<br />
Long-term Challenges<br />
Four key long-term drivers are shaping the future of <strong>Auckland</strong>’s<br />
transport network:<br />
> Population and economic growth driving a strong increase in the<br />
demand for travel. Figure 3.1 shows that <strong>Auckland</strong>’s growing<br />
population is expected to exceed 2 million people before 2036<br />
and reach around 2.3 million people before 2050.<br />
This anticipated growth to 2031 alone is larger than the current<br />
population of any other New Zealand city (see Figure 3.2) and will be<br />
largely accommodated within <strong>Auckland</strong>’s metropolitan urban limits.<br />
This growth will increase the number of person trips made in <strong>Auckland</strong><br />
each day from around 3.2 million currently to 5.2 million by 2050 – an<br />
increase of 2 million trips daily or 65% from current travel demand.<br />
Freight movements will also increase by a similar proportion.<br />
Figure 3.1: Population growth in the <strong>Auckland</strong> region (1911–2046)<br />
2,800,000<br />
2,600,000<br />
2,400,000<br />
2,200,000<br />
2,000,000<br />
Urban area<br />
Region (census)<br />
Low forecast (Stats NZ)<br />
Medium forecast (Stats NZ)<br />
High forecast (Stats NZ)<br />
1,800,000<br />
Population<br />
1,600,000<br />
1,400,000<br />
1,200,000<br />
1,000,000<br />
800,000<br />
600,000<br />
400,000<br />
200,000<br />
0<br />
1911 1921 1931 1941 1951 1961 1971 1981 1991 2001 2011 2021 2031 2041<br />
7
Figure 3.2: Population growth by regional council (2006–2031)<br />
2.0<br />
1.8<br />
Growth to 2031<br />
2006 Population<br />
1.6<br />
1.4<br />
Population (millions)<br />
1.2<br />
1.0<br />
0.8<br />
0.6<br />
0.4<br />
0.2<br />
0.0<br />
<strong>Auckland</strong><br />
Christchurch<br />
Wellington<br />
Waikato<br />
Bay of Plenty<br />
Otago<br />
Growth in <strong>Auckland</strong> to 2031<br />
><br />
An increasingly constrained urban roading network. Once major<br />
projects currently underway or about to begin (such as the<br />
<strong>Auckland</strong> to Manukau Eastern <strong>Transport</strong> Initiative and the<br />
Western Ring Route projects) are completed, almost all existing<br />
major roading designations will have been exhausted, making<br />
future roading extensions difficult, extremely expensive and<br />
significantly impacting on the built environment.<br />
Congestion on Great South Road<br />
8
The smartest use of limited public funds to meet this burgeoning<br />
demand is to simultaneously invest more in public transport, which is<br />
far more efficient at moving large numbers of people over longer<br />
distances in urban <strong>Auckland</strong> than any other mode – as shown in<br />
Figure 3.3. Over shorter distances (less than 5 kilometres<br />
approximately) walking and cycling are the most efficient modes to<br />
move people.<br />
Figure 3.3: Capacity of different modes to move people<br />
Capacity per hour<br />
A single lane of motorway 2,400 people<br />
Bus lanes<br />
7,500 people<br />
Dedicated busway<br />
12,000 people<br />
Dedicated light rail<br />
12,000 people<br />
<strong>Auckland</strong>’s rail corridors 20,000 – 25,000 people<br />
><br />
><br />
A national economic imperative is for <strong>Auckland</strong> to be a worldclass<br />
city competing on the world stage for international<br />
investment, events and tourism. Success in this endeavour<br />
requires public transport to be a cornerstone of a world-class<br />
transport system. As shown in Figure 3.4, <strong>Auckland</strong> is lagging<br />
behind its competitor cities in developing its public transport<br />
system, and this is limiting its potential to become more<br />
internationally competitive.<br />
The economic role and linkages between the <strong>Auckland</strong> region,<br />
New Zealand and the global economy. Figure 3.5 shows the key<br />
annual road and rail freight movements between the <strong>Auckland</strong><br />
region and surrounding regions. It highlights the significant<br />
freight movements taking place completely within the <strong>Auckland</strong><br />
region and also the important linkages between <strong>Auckland</strong> and<br />
the adjacent regional economies of Waikato, the Bay of Plenty<br />
and Northland. At present, the bulk of this freight is moved by<br />
heavy trucks, predominantly on State highways.<br />
Figure 3.4: Public transport use<br />
140<br />
PT trips and GDP per capita (2007/08, US$)<br />
$40,000<br />
PT trips per capita<br />
120<br />
GDP per capita (US$)<br />
114<br />
116<br />
123<br />
$35,000<br />
100<br />
$30,000<br />
PT trips/capita<br />
80<br />
60<br />
40<br />
41<br />
44 45<br />
48<br />
56<br />
63<br />
77<br />
83<br />
89<br />
91<br />
$25,000<br />
$20,000<br />
$15,000<br />
$10,000<br />
GDP/capita (US$)<br />
20<br />
$5,000<br />
0<br />
$0<br />
<strong>Auckland</strong><br />
Christchurch<br />
Portland<br />
Canberra<br />
Adelaide<br />
Perth<br />
Vancouver<br />
Toronto<br />
Brisbane<br />
Wellington<br />
Sydney<br />
Melbourne<br />
Ottawa<br />
9
Figure 3.5: Road and rail freight movement to and from the <strong>Auckland</strong> region (2007, annual tonnes)<br />
16,000<br />
Road and rail freight (annual tonnes)<br />
14,000<br />
12,000<br />
10,000<br />
8,000<br />
6,000<br />
4,000<br />
2,000<br />
From <strong>Auckland</strong><br />
To <strong>Auckland</strong><br />
0<br />
<strong>Auckland</strong> Waikato Bay of Plenty Northland Canterbury Manawatu Wellington Taranaki<br />
Currently, the combined regions of <strong>Auckland</strong>, Waikato, the Bay<br />
of Plenty and Northland generate 51% of New Zealand’s Gross<br />
Domestic Product and are home to 51% of New Zealand’s population.<br />
By 2031, this is expected to grow to around 60%. High-quality, direct<br />
and well-maintained inter-regional transport connections are essential<br />
to facilitating this rapid growth in these strongly linked regional<br />
economies. Furthermore, trends in international container shipping<br />
signal that larger volumes of freight will move with fewer shipping<br />
lines at a fewer number of hub ports in New Zealand. Thus while<br />
State highways will remain the backbone of this inter-regional<br />
transport network, in the future, rail offers the potential to play a<br />
bigger role as part of the inter-regional transport network.<br />
The overall land transport challenge facing <strong>Auckland</strong> is to:<br />
> Complete the work underway to deliver a properly connected<br />
strategic and arterial roading network.<br />
1. Implementing government policy<br />
Government Policy Statement<br />
The Government produced a Government Policy Statement (GPS<br />
<strong>2009</strong>) on land transport funding in May <strong>2009</strong>, shortly before the<br />
completion of the RLTP. The GPS details the Government’s desired<br />
outcomes and funding priorities for the use of the National <strong>Land</strong><br />
<strong>Transport</strong> Fund (NLTF) to support land transport activities. The<br />
New Zealand <strong>Transport</strong> Agency is required to give effect to the GPS<br />
in developing the National <strong>Land</strong> <strong>Transport</strong> <strong>Programme</strong>. The GPS<br />
covers the financial period <strong>2009</strong>/10–2014/15 and provides figures<br />
for 2015–2019. It will be in effect from 1 July <strong>2009</strong> to 1 July 2012.<br />
The Government’s stated priority is for land transport investment to<br />
support national economic growth and productivity. Of particular<br />
importance to this priority for the Government are:<br />
><br />
><br />
Manage the use of this roading network as the primary mover of<br />
freight, commercially important trips and other trips that cannot<br />
be made by public transport.<br />
Accelerate the delivery of a step change improvement in public<br />
transport and active modes.<br />
><br />
><br />
Investing in the State highway network, as a key to the efficient<br />
movement of freight and people.<br />
Generating better value for money from the Government’s<br />
investment across all land transport activity classes and enhancing<br />
the economic efficiency of individual projects.<br />
><br />
Maintain and improve inter-regional road and rail connections<br />
with its neighbouring regional economies.<br />
The specific impacts the Government expects to be achieved through<br />
the use of the NLTF are:<br />
ARTA has identified six key high-level transport challenges related to<br />
these long-term strategic drivers. These challenges are summarised<br />
below, and are described in more detail in the <strong>Auckland</strong> <strong>Transport</strong><br />
Plan (ATP).<br />
Short to medium-term impacts that contribute to economic<br />
growth and productivity<br />
> Improvements in the provision of infrastructure and services<br />
that enhance transport efficiency and lower the cost of<br />
transportation through:<br />
> Improvements in journey time reliability.<br />
> Easing of severe congestion.<br />
> More efficient supply chains.<br />
> Better use of existing transport capacity.<br />
><br />
><br />
Better access to markets, employment and areas that contribute<br />
to economic growth.<br />
A secure and resilient transport network.<br />
10
Other short to medium-term impacts<br />
2. Linking to the global economy<br />
><br />
><br />
><br />
><br />
Reductions in deaths and serious injuries as a result of<br />
road crashes.<br />
More transportation choices, particularly for those with limited<br />
access to a car where appropriate.<br />
Reductions in adverse environmental effects from land transport.<br />
Contributions to positive health outcomes.<br />
<strong>Auckland</strong>’s transport network is an integral part of the door-to-door<br />
global chain – large volumes of exports and imports are carried<br />
through our air and sea ports, and on the region’s roads and rail<br />
network. In this global logistics chain, <strong>Auckland</strong>’s transport system<br />
needs to be a competitive, modern and integrated freight network<br />
hub and distribution centre, servicing both international and<br />
domestic customers.<br />
The GPS lists seven roads of national significance, which the<br />
Government considers New Zealand’s most essential routes, requiring<br />
significant development to reduce congestion, improve safety and<br />
support economic growth. The GPS requires that these roads are<br />
given priority when the NZTA develops the National <strong>Land</strong> <strong>Transport</strong><br />
<strong>Programme</strong>. The seven roads of national significance are:<br />
><br />
><br />
Puhoi to Wellsford – State Highway 1.<br />
The completed <strong>Auckland</strong> Western Ring Route – State Highways<br />
20/16/18.<br />
><br />
><br />
><br />
<strong>Auckland</strong>’s Victoria Park bottleneck – State Highway 1.<br />
Waikato Expressway – State Highway 1.<br />
Tauranga Eastern corridor – State Highway 2.<br />
> Wellington Northern Corridor (Levin to Wellington) –<br />
State Highway 1.<br />
> Christchurch motorway projects.<br />
The GPS also provides guidance on transport planning and evaluation.<br />
Key aspects of this guidance that ARTA’s planning and evaluation<br />
processes must take account of are:<br />
> The Government’s priority for land transport investment to<br />
support national economic growth and productivity growth –<br />
including the roads of national significance.<br />
3. Changing employment and settlement patterns<br />
The effective day-to-day <strong>Auckland</strong> economy is expanding beyond the<br />
formal <strong>Auckland</strong> regional boundaries to include upper North Island<br />
provincial centres. Locations with lifestyle options and lower overhead<br />
costs, with good transport and freight links will be a catalyst for<br />
investment attraction, creating hubs for exporters and places for<br />
foreign interests to set up businesses. This is particularly true of the<br />
economic ‘golden triangle’, between <strong>Auckland</strong>, Tauranga and<br />
Hamilton. This area already contains around half of New Zealand’s<br />
population and economy. Increasing employment and population in<br />
these centres will place major demands on transport and other<br />
infrastructure. The challenge is how the transport network will address<br />
the growing case for better access and mobility within this extended<br />
catchment that the regional economy now operates within.<br />
4. Promoting sustainability<br />
There is a strong policy expectation and community demand to<br />
achieve a more sustainable lifestyle through increased travel choice,<br />
reduced reliance on private cars, and less use of fossil fuel,<br />
acknowledging that fossil fuels are finite resources. Meeting this<br />
challenge requires transport solutions that better integrate transport<br />
and land use planning, improve public transport services and<br />
networks, and make greater use of non-motorised modes.<br />
><br />
><br />
><br />
The impact of volatile fuel prices, by providing transport choices<br />
such as public transport.<br />
Achieving value for money by prioritising projects which not only<br />
make the greatest contribution to the Government’s priorities,<br />
but which also give projects with higher benefit/cost ratios higher<br />
priority. Projects with a benefit/cost ratio of less than 2 will<br />
require more scrutiny. The GPS also requires the NZTA to consider<br />
broader benefits and costs of proposed investments not captured<br />
in traditional benefit/cost analysis methods.<br />
The need for integrated planning to ensure that transport and<br />
land use is connected. This includes identifying and protecting<br />
future transport corridors.<br />
5. Role of new technology<br />
There is an increasing range of emerging transport developments<br />
now available, with technologies previously considered uneconomic<br />
becoming more viable – e.g. tunnelling improvements, network<br />
efficiency tools, electronic tolling, new fuel options, ‘Intelligent<br />
<strong>Transport</strong> Systems’ and many other innovative solutions that have<br />
the potential to create more efficient transport options.<br />
The GPS also indicates that while the Government supports the<br />
overall intent of the New Zealand <strong>Transport</strong> Strategy 2008 (NZTS),<br />
developed by the previous Government, it considers that moving too<br />
quickly on the aspirational targets for modal shift will have a negative<br />
impact on environmental and economic efficiency. The Government<br />
will develop a forward plan for transport that is likely to replace the<br />
targets set in the 2008 NZTS.<br />
11
6. Funding constraints<br />
The current policy framework of the NZTS, GPS and RLTS sets a highly<br />
aspirational vision and set of transport challenges for <strong>Auckland</strong>,<br />
which will clearly not be easily achieved within current funding<br />
arrangements.<br />
Most local government projects require funding from a number of<br />
different sources categorised as a local share and a national share.<br />
Examples of funding sources are:<br />
Local share<br />
National share<br />
Rates<br />
N or National funds<br />
Developer contributions R or <strong>Regional</strong> funds<br />
Borrowings<br />
C or Crown funds<br />
Local government bonds T or Community <strong>Transport</strong> Funds<br />
<strong>Regional</strong> fuel levy funds Private public partnerships<br />
(levied by regional council)<br />
Private public partnerships<br />
Often the national share is available, but due to other priorities and a<br />
need to keep local government costs to a minimum, the local share<br />
is not available. Consequently, in future it will necessary to find a<br />
suitable mix of central government, regional and local funding<br />
sources to implement key projects. Possible solutions may include a<br />
greater involvement of private sector funding.<br />
While there will continue to be pressure on funding to deliver all the<br />
projects required, the region must be able to fund the right projects<br />
at the right time. This will require careful strategic planning, clear<br />
prioritisation and a high level of agreement between central<br />
government and <strong>Auckland</strong> as a whole, and a need to ensure that a<br />
return on investment is realised.<br />
Shorter-term Challenges<br />
In addition to these long-term strategic challenges, there are a<br />
number of more immediate challenges. These issues and challenges<br />
inform the Strategic Focus Areas which in turn inform the prioritisation<br />
system used in the RLTP to rank transport projects in order of<br />
importance, so that if there is a funding shortfall the most important<br />
projects are carried out first.<br />
> Managing congestion and reducing unreliable travel times<br />
Missing links in the strategic and regional arterial network,<br />
combined with inefficient use of existing transport network<br />
capacity and incidents such as crashes or breakdowns, hinder the<br />
efficient functioning of the network and negatively impact<br />
development and the economic viability of key transport<br />
terminals. Prioritising the allocation of scarce road space to the<br />
movement of people and goods, not vehicles, is the aim of the<br />
<strong>Regional</strong> Arterial Road Plan.<br />
> Increasing choice and reducing reliance on private cars<br />
Incomplete public transport networks and services lead to private<br />
cars often being the only choice for a large proportion of the<br />
region’s population. Providing viable transport choices results in<br />
people of all ages having broader travel options for access to<br />
employment, education, leisure and social services as well as<br />
being able to participate in their local communities.<br />
><br />
><br />
><br />
><br />
><br />
><br />
><br />
Ensuring integrated land use and transport<br />
The phasing and planning of infrastructure and service<br />
improvements needs to be integrated with growth centres and<br />
corridors. The <strong>Regional</strong> Growth Strategy (RGS) aims to do this,<br />
and transport systems must be designed to support the RGS.<br />
Encouraging and facilitating economic development<br />
The transport system needs to support economic development<br />
opportunities in the region, and contribute to the accessibility<br />
and efficiency of business activities and employment.<br />
Providing a transport system that is safe to use<br />
Safety and security for people using the transport system is a<br />
critical baseline issue. Current trends in crash statistics indicate<br />
that <strong>Auckland</strong> will not meet the targets set in the Government’s<br />
Road Safety to <strong>2010</strong> strategy. Also of concern is ensuring that any<br />
personal security concerns around the use of the public transport<br />
system and walking and cycling options are addressed.<br />
Promoting environmental sustainability<br />
The transport system uses increasing volumes of non-renewable<br />
resources such as land, aggregates and fuel for construction,<br />
which means that, if not managed appropriately, it will become<br />
increasingly unsustainable. Equally, the development and use of<br />
the transport system impacts on the surrounding environment<br />
through emissions as well as through issues such as community<br />
connectivity and/or severance.<br />
Promoting public health outcomes<br />
Air quality is a regional issue and, as vehicles are the largest<br />
contributors to air pollution in the <strong>Auckland</strong> region, it is important<br />
to ensure that this negative aspect of the transport system is<br />
appropriately addressed. Increasing use of active travel modes<br />
for short trips instead of relying on private cars will lead to better<br />
health outcomes.<br />
Rugby World Cup<br />
<strong>Auckland</strong> will be hosting 12 matches as part of the Rugby World<br />
Cup 2011 (RWC 2011). Paramount to the success of RWC 2011<br />
will be the successful delivery of the transport and traffic<br />
operation. ARTA chairs the RWC 2011 <strong>Regional</strong> <strong>Transport</strong> and<br />
Traffic Work stream. There are a number of transport projects<br />
which are essential for the delivery of patrons to/from RWC 2011<br />
matches, these include an integrated ticketing system to speed<br />
up loading times on public transport modes, improvements to<br />
Kingsland rail station to maximise train patronage, realignment<br />
of Sandringham Road and installation of Link Lane (Cricket Ave<br />
extension) to diversify patron movements around Eden Park, and<br />
improving walking routes (lighting and footpaths) leading to<br />
Eden Park.<br />
Change in <strong>Auckland</strong> governance<br />
The Government has introduced legislation to replace the ARC<br />
and territorial authorities and their council-controlled organisations<br />
with a unitary authority – the <strong>Auckland</strong> Council. The <strong>Auckland</strong><br />
Council will come into being in November <strong>2010</strong>, which will be<br />
half-way through the term of this RLTP. An early decision to be<br />
made by the new <strong>Auckland</strong> Council will be whether or not to<br />
complete the projects put forward in this RLTP.<br />
12
4 STATEMENT OF PRIORITIES<br />
Strategic Focus Areas<br />
ARTA is required to be consistent with the <strong>2009</strong> Government Policy<br />
Statement (GPS) and to give effect to the <strong>Regional</strong> <strong>Land</strong> <strong>Transport</strong><br />
Strategy (RLTS) when developing the RLTP. The manner in which<br />
ARTA meets these requirements is set out in the <strong>Auckland</strong> <strong>Transport</strong><br />
Plan (ATP). The <strong>Regional</strong> Strategic Focus Areas (SFAs) identified in the<br />
<strong>2009</strong> ATP are therefore based on the desired impacts as expressed in<br />
the <strong>2009</strong> GPS and the results expected in the RLTS (2005) and reflect<br />
both the desired national impacts as well as those outcomes that are<br />
of special interest to the region as a whole. Five regional Strategic<br />
Focus Areas were identified in the ATP and endorsed by the <strong>Regional</strong><br />
<strong>Transport</strong> Committee. They are:<br />
1. Greater focus on the regional arterials<br />
Linking national routes to local routes is important to ensure a<br />
high level of connectivity and thus access to markets, as well as<br />
to alleviate congestion and improve the reliability of journey<br />
times. Economic and population growth in the region will lead to<br />
increases in freight and vehicle movements, thus a greater<br />
planning focus is required on the region’s arterial roads, as<br />
defined in the <strong>Regional</strong> Arterial Road Plan (RARP) and the desired<br />
impacts of the GPS (<strong>2009</strong>) and the RLTS (2005). Importantly,<br />
improvements to the arterial network will also alleviate<br />
congestion, improve journey times, support achievement of the<br />
region’s strategic passenger transport plan and, by providing for<br />
the right traffic in the right corridor, ensure that the regional<br />
arterials will be supportive of providing for the active modes.<br />
New Lynn <strong>Transport</strong> Hub<br />
13
Achievement of the expected increase in bus passenger boardings<br />
for example, is forecasted to come from the QTN, which is<br />
located primarily on the regional arterials, which in turn will<br />
contribute to the desired impact targets to improve travel times<br />
on regional critical routes.<br />
Contribution to:<br />
GPS (<strong>2009</strong>)<br />
impacts<br />
> Improvements in the provision of<br />
infrastructure and services that enhance<br />
transport efficiency and lower the cost<br />
of transportation through:<br />
> Improvements in journey<br />
time reliability.<br />
><br />
><br />
Easing of severe congestion.<br />
More efficient freight<br />
supply chains.<br />
> Better use of existing<br />
transport capacity.<br />
> Better access to markets,<br />
employment and areas that contribute<br />
to economic growth.<br />
> A secure and resilient<br />
transport network.<br />
2. Greater focus on safety engineering for streets and roads<br />
ARTA’s <strong>Regional</strong> Road Safety Plan highlights the need for specific<br />
road safety engineering. While all transport projects must<br />
consider and include safety, there is a need to increase the<br />
number of road safety engineering projects on urban and rural<br />
arterials to keep track with the RLTS (2005) targets and to deliver<br />
the regional crash reduction for <strong>2010</strong>. It is critical that road safety<br />
engineering solutions include positive urban design elements,<br />
bearing in mind that positive urban design outcomes for streets<br />
and corridors will contribute to improving safety for all users.<br />
Addressing road safety engineering, along with education and<br />
enforcement, will not only contribute to the GPS impact<br />
associated with decreased fatalities and hospitalisations but also<br />
increase use of the transport environment by vulnerable users,<br />
such as pedestrians and cyclists.<br />
Contribution to:<br />
GPS (<strong>2009</strong>) > Reductions in deaths and serious<br />
impacts<br />
injuries as a result of road crashes.<br />
RLTS (2005) > Crashes, deaths and injuries especially<br />
expected<br />
to pedestrians and cyclists to decrease.<br />
results<br />
> Promote the use of alternative transport<br />
modes (walking and cycling).<br />
RLTS (2005)<br />
expected<br />
results<br />
><br />
><br />
><br />
><br />
><br />
More transport choices, particularly for<br />
those with limited access to a car where<br />
appropriate.<br />
Substantial progress is expected in the<br />
planning and completion of key links in<br />
the strategic road network.<br />
Inter-peak travel speeds on the region’s<br />
roads for freight and general traffic are<br />
expected to decrease by only 5.6% in<br />
spite of traffic volumes between key<br />
business centres increasing by 45%.<br />
The transport system is expected to<br />
significantly improve access<br />
opportunities through improvements to<br />
all aspects of passenger transport<br />
journeys including the quality of the<br />
interchange environment, functionality<br />
and frequency and quality of service.<br />
Increase walking and cycling and other<br />
active modes.<br />
14
3. Optimise the use of the existing transport system to move<br />
people and freight<br />
The current and planned transport system in the <strong>Auckland</strong> region<br />
is a significant asset with a value in excess of $15 billion, and it is<br />
critical that the use of the system is optimised. Shifting the<br />
emphasis from the movement of automobiles to the movement<br />
of people and freight will contribute to achieving the expected<br />
results at both national and regional level. Initiating methods<br />
that allocate road space to preferential traffic will not only ensure<br />
improvements in system efficiency but also in easing severe<br />
congestion. This can be assisted by moving non-essential trips<br />
from cars to passenger transport as far as possible, which will<br />
free road space for commercial and freight movements, and thus<br />
reducing congestion and improving travel times and reliability on<br />
critical routes.<br />
Contribution to:<br />
GPS (<strong>2009</strong>) ><br />
impacts<br />
><br />
><br />
><br />
RLTS (2005) ><br />
expected<br />
results<br />
><br />
><br />
><br />
Improvements in the provision of<br />
infrastructure and services that enhance<br />
transport efficiency and lower the cost<br />
of transportation through:<br />
> Improvements in journey<br />
time reliability.<br />
> Easing of severe congestion.<br />
> More efficient freight supply chains.<br />
> Better use of existing<br />
transport capacity.<br />
Better access to markets,<br />
employment and areas that<br />
contribute to economic growth.<br />
A secure and resilient<br />
transport network.<br />
More transport choices, particularly for<br />
those with limited access to a car where<br />
appropriate.<br />
Inter-peak travel speeds for freight and<br />
general traffic are expected to decrease<br />
by only 5.6% in spite of traffic volumes<br />
between key business centres increasing<br />
by 45%.<br />
Travel speeds for freight and general<br />
traffic to be less variable than in 2005.<br />
Improve the reliability of public<br />
transport services.<br />
Improve the use of alternative transport<br />
modes (walking and cycling).<br />
4. Strong focus on transport investments that are supportive<br />
of the <strong>Regional</strong> Growth Strategy<br />
It will be critical for transport investments to be supportive of,<br />
and integrated with, the <strong>Regional</strong> Growth Strategy and land use<br />
planning if a number of the GPS (<strong>2009</strong>) and RLTS (2005)<br />
outcomes are to be achieved. The GPS (<strong>2009</strong>) mentions specific<br />
focus to be given to improving transport in areas having growth<br />
and improving access to markets, while the RLTS (2005) focuses<br />
on integrating transport with land use that shows growth<br />
potential. Although national emphasis seems to focus on<br />
economic growth, regional focus is aimed at both economic and<br />
population growth.<br />
Contribution to:<br />
GPS (<strong>2009</strong>) > Improvements in the provision of<br />
impacts<br />
infrastructure and services that enhance<br />
transport efficiency and lower the cost<br />
of transportation through:<br />
> Improvements in journey<br />
time reliability.<br />
> Better access to markets,<br />
employment and areas that contribute<br />
to economic growth.<br />
> More transport choices, particularly for<br />
those with limited access to a car where<br />
appropriate.<br />
> Reductions in adverse environmental<br />
effects from land transport.<br />
> Contributions to positive<br />
health impacts.<br />
RLTS (2005)<br />
expected<br />
results<br />
><br />
><br />
><br />
><br />
><br />
People will have a greater choice of<br />
travel modes and it will be easier to<br />
change between modes.<br />
Travel speeds for freight and general<br />
traffic to be less variable than in 2005.<br />
Inter-peak travel speeds for freight and<br />
general traffic are expected to decrease<br />
by only 5.6% in spite of traffic volumes<br />
between key business centres increasing<br />
by 45%.<br />
Move commuter trips wherever possible<br />
to public transport.<br />
On average 65,000 more households<br />
are expected to be within 30 minutes’<br />
travel by car from employment<br />
opportunities; 37,000 more households<br />
within 30 minutes’ travel by public<br />
transport from employment<br />
opportunities by 2015.<br />
><br />
><br />
Improve the reliability of public<br />
transport services.<br />
13% of the urban population should be<br />
living in the regional growth zones.<br />
15
16<br />
5. Completion of key links in the region’s strategic roading,<br />
passenger transport and cycling networks<br />
To maximise the full benefits from the transport system it is<br />
critical that complete networks are available for use, such as the<br />
State highway, Rapid Transit, and walking and cycling networks.<br />
It is critical that projects or packages of projects that come<br />
forward to meet this focus area are fully justified in terms of the<br />
GPS impacts as well as all their benefits and costs, rather than<br />
just ‘completing a network’.<br />
The strategic roading network should prioritise both routes of<br />
national and regional significance if the economic potential of<br />
the region and its immediate neighbours is to be realised. The<br />
GPS (<strong>2009</strong>) has identified seven routes of national significance of<br />
which four are of importance to <strong>Auckland</strong> namely:<br />
> State Highway 1 from Puhoi to Wellsford (linking <strong>Auckland</strong><br />
to Northland).<br />
> Western Ring Route (Waterview connection is seen as the<br />
highest priority to complete).<br />
><br />
><br />
Victoria Park Tunnel (to overcome severe congestion on SH1).<br />
Waikato Expressway (enables improved linkages between<br />
<strong>Auckland</strong> and its major regional trading partners Waikato<br />
and the Bay of Plenty).<br />
The completion of the Rapid Transit Network (RTN) and the<br />
regional cycle network will allow users more choice, and will<br />
improve the effectiveness of implementing both travel supply and<br />
demand management. The completion of the RTN is essential for<br />
the delivery of fast and efficient passenger transport services.<br />
Contribution to:<br />
GPS (<strong>2009</strong>) > Improvements in the provision of<br />
impacts<br />
infrastructure and services that enhance<br />
transport efficiency and lower the cost<br />
of transportation through:<br />
> Improvements in journey<br />
time reliability.<br />
><br />
><br />
Easing of severe congestion.<br />
More efficient freight<br />
supply chains.<br />
> Better use of existing<br />
transport capacity.<br />
> Better access to markets,<br />
employment and areas that contribute<br />
to economic growth.<br />
> A secure and resilient transport<br />
network.<br />
> More transport choices, particularly for<br />
those with limited access to a car<br />
where appropriate.<br />
> Reductions in adverse environmental<br />
effects from land transport.<br />
> Contributions to positive<br />
health impacts.<br />
Contribution to:<br />
RLTS (2005)<br />
expected<br />
results<br />
><br />
><br />
><br />
><br />
><br />
><br />
Inter-peak travel speeds for freight<br />
and general traffic are expected to<br />
decrease by only 5.6% in spite of traffic<br />
volumes between key business centres<br />
increasing by 45%.<br />
Substantial progress is expected in the<br />
planning and completion of key links in<br />
the strategic road network.<br />
Travel speeds for freight and<br />
general traffic on motorways and major<br />
arterials to be less variable than in 2005.<br />
On average 65,000 more households<br />
are expected to be within 30 minutes’<br />
travel by car from employment<br />
opportunities; 37,000 more households<br />
within 30 minutes’ travel by public<br />
transport from employment<br />
opportunities by 2015.<br />
Rapid transit services linking regional<br />
growth centres on the RTN will not be<br />
more than 10 minutes apart at<br />
morning peak.<br />
People have a greater choice of travel<br />
modes and it will be easier to change<br />
between different modes.<br />
In addition to the Strategic Focus Areas, to ensure that funds are<br />
directed towards projects that best meet the region’s objectives,<br />
the evaluation and prioritisation of projects within these broad<br />
priorities is based on identifying serious issues for the region and<br />
then ensuring that effective solutions are provided which give<br />
value for money.<br />
Priority 1: Make best use of the existing transport system<br />
Activities that are necessary to ensure the safe, efficient and<br />
effective performance of the existing transport system should<br />
have the ’first call‘ on funds, ahead of any additional improvements<br />
to the network. These activities include maintenance and renewal<br />
of the road and public transport systems, maintenance of existing<br />
public transport service levels, traffic management to improve the<br />
operational efficiency of the strategic and regional arterial<br />
network, and targeted investments to improve the safety<br />
performance of the existing network.<br />
Priority 2: Manage travel demand<br />
The next priority for funding is for activities that are focused on<br />
travel demand management, with a particular focus on activities<br />
that encourage a reduction in the use of single occupancy vehicles<br />
in situations where alternatives are available. A number of these<br />
activities are included in ARTA’s Sustainable <strong>Transport</strong> Plan, and<br />
include travel planning, walking and cycling activities.<br />
Priority 3: Increase the capacity of the transport system<br />
The third area of priority is for investments in infrastructure and<br />
services that increase the capacity of the transport system. This<br />
includes upgrading and expanding the region’s public transport<br />
infrastructure and rolling stock and improving public transport<br />
service levels, upgrading and providing additional road<br />
infrastructure, and improvements and extensions to the region’s<br />
walking and cycling infrastructure.
Region-wide and Sub-regional Priorities<br />
Arising from this, Table 4.1 summarises ARTA’s land transport priorities as developed through the ATP, for the region as a whole (in alphabetical order),<br />
and also lists specific priorities for each sub-region.<br />
Table 4.1: ARTA’s region-wide and sub-regional priorities<br />
Priorities for the region<br />
Additional Waitemata Harbour Crossing<br />
Corridor designation for the additional Waitemata Harbour Crossing will improve accessibility for all modes across the Waitemata Harbour.<br />
While tunnels are proposed for the new road and rail connections, these new routes will allow for the reallocation of space on the <strong>Auckland</strong><br />
Harbour Bridge for both walking and cycling across the Waitemata Harbour.<br />
AMETI – The <strong>Auckland</strong> Manukau Eastern <strong>Transport</strong> Initiative<br />
AMETI is a three-way (<strong>Auckland</strong> City, <strong>Auckland</strong> <strong>Regional</strong> <strong>Transport</strong> Authority and Manukau City) project that will deliver increased passenger<br />
transport, demand management and economic development opportunities for the south-east metropolitan <strong>Auckland</strong> region – one of the<br />
fastest growing areas in the region.<br />
CBD rail tunnel<br />
The decision to electrify the rail network has allowed work to begin on protecting and constructing the CBD rail tunnel. Once completed,<br />
the CBD rail tunnel will allow higher train frequencies across the entire rail network, as well as providing new stations in the heart of the<br />
CBD and facilitate future rail extensions, such as to the airport. Overall, this project will increase the accessibility of the CBD, New Zealand’s<br />
largest concentration of economic activity, to more than half a million people within 30 minutes’ travel time by rail, which is completely free<br />
of road congestion.<br />
Electrification of the rail network<br />
<strong>Auckland</strong>’s rail system is to be electrified and will deliver significant performance advantages over the current and even new diesel systems for<br />
urban rail operations, including better acceleration between stations and the ability to operate high-frequency trains through tunnels. In<br />
addition, electric trains will provide environmental benefits such as improved local air quality and reduced noise and air vibration, so they are<br />
compatible with the intensified development along rail corridors envisaged by the <strong>Regional</strong> Growth Strategy.<br />
Integrated fares and ticketing<br />
Throughout the region, travel by public transport will be made easier and simpler by an electronic smartcard ticket that can be used across<br />
all modes, and an easier and simpler fare system based on a small number of fare zones similar to other internationally competitive cities.<br />
The smartcard integrated ticketing system is also aimed at complementing the NZTA’s aim to achieve a national smartcard integrated<br />
ticketing system.<br />
Newmarket Viaduct improvements<br />
To reduce southbound congestion on the Southern Motorway, a fourth southbound lane on the motorway between Gillies Avenue and Greenlane<br />
will be constructed, and the Newmarket Viaduct will be replaced with a new structure. The Newmarket Viaduct is part of State Highway 1, a<br />
strategic route for the region. Structural standards and capacity in this section of State Highway 1 will be improved to co-ordinate with other<br />
developments on the network, such as Central Motorway Junction improvements and the Grafton Gully motorway upgrade.<br />
Public transport service improvements<br />
Improved public transport services will be provided, including enhancing and restructuring bus services in the south, Isthmus and Waitakere to<br />
service new growth areas and provide better connectivity to new and upgraded rail stations such as Henderson and New Lynn. A new rail<br />
service will be provided to Onehunga, and service frequencies and operating hours will be increased. A new ferry service will be provided from<br />
Hobsonville. To complement these service improvements, new and improved public transport infrastructure will be provided, such as rail<br />
stations, ferry terminals and bus priority measures.<br />
<strong>Regional</strong> arterial roading improvements<br />
<strong>Auckland</strong>’s regional arterial road network is key to the economic prosperity of the region. It comprises only 4% of the length of the regional<br />
roading network but carries almost half of all bus passenger transport trips, and 15% of all peak-hour travel, 18% of all freight and commercial<br />
journeys and 24% of road crashes are on regional arterials. Public transport, safety and capacity improvements to major arterial routes will be<br />
made. Routes proposed to be improved include Great North Road, Sandringham Road, Dominion Road, Chapel Road in Flat Bush and Albany<br />
Highway. These projects will improve conditions for all road users but will especially address increasing the goods carrying capacity, and enhance<br />
bus travel times and reliability.<br />
17
Walking and cycling initiatives<br />
Delivering on the regional cycle network will ensure that the <strong>Auckland</strong> region makes its contribution to the New Zealand <strong>Transport</strong> Strategy<br />
targets for active modes. Key walking and cycling projects to be delivered over the next three years include providing walking and cycling<br />
facilities on local roads affected by the SH20–SH1 motorway connection project, design and construction of a cycle lane adjacent to SH1<br />
between Marks Road and Sultan Road, design and construction of a cycle connection between SH1 and SH16 in the <strong>Auckland</strong> CBD, and over<br />
38 kilometres of off-road walking and cycling facilities in Flat Bush. A number of neighbourhood accessibility programmes will also be<br />
implemented to improve walking and cycling in and around town centres.<br />
Western Ring Route completion<br />
Completing the Western Ring Route (WRR) network with the implementation of the SH20–SH1 Manukau link, SH18 extension from Hobsonville<br />
to Westgate and the Waterview connection will provide a complete alternative for the movement of people and goods to State Highway 1 from<br />
Manukau through to Albany, and provides both regional and inter-regional benefits. The completion of the WRR will improve transport links<br />
for <strong>Auckland</strong>ers and businesses and provide more reliable travel time to <strong>Auckland</strong> Airport.<br />
Victoria Park Tunnel<br />
Capacity improvements will be made to the Northern Motorway between the <strong>Auckland</strong> Harbour Bridge and Wellington Street as part of<br />
the Central Motorway Improvements. This project is key to maximising the benefits of the improvements already made to the Central<br />
Motorway Junction.<br />
Sub-regional priorities<br />
Area<br />
Priority<br />
Rural – outside the metropolitan<br />
urban limit<br />
North – including North Shore City<br />
and the Hibiscus Coast<br />
West – including Waitakere City<br />
and parts of western<br />
Rodney District<br />
Isthmus<br />
South – includes urban<br />
Manukau City and<br />
Papakura District<br />
><br />
><br />
><br />
><br />
><br />
><br />
><br />
><br />
><br />
><br />
><br />
><br />
><br />
><br />
><br />
><br />
><br />
><br />
><br />
><br />
><br />
><br />
><br />
Improving the safety and efficiency of SH1 and SH2.<br />
Improving the safety and efficiency of rural arterial routes experiencing growth pressures.<br />
Improving mobility and accessibility in rural areas using innovative approaches.<br />
Increase bus frequencies utilising the Northern Busway to meet growing demand.<br />
Extending the Northern Busway between Constellation and Albany to avoid peak congestion and<br />
to protect the future extension of the busway further north to Silverdale.<br />
Improving ferry service infrastructure.<br />
Improving access to the Whangaparaoa peninsula.<br />
Improving access between the North Shore and Waitakere and providing an alternative<br />
north-south corridor to SH1 via the Western Ring Route.<br />
Improving the safety and efficiency of SH16.<br />
New Lynn rail trenching and town centre roading improvements and transport interchange.<br />
New bus services and integration with rail at key interchanges.<br />
More frequent rail services, operating over longer time periods.<br />
Improving access to the eastern suburbs and Manukau City.<br />
Enhancing access and travel options to the <strong>Auckland</strong> Central Business District to enhance its<br />
economic growth potential.<br />
Enhancing access between the <strong>Auckland</strong> Central Business District and <strong>Auckland</strong> Airport.<br />
Ensuring the transport system is able to meet the needs of the Rugby World Cup in 2011.<br />
Manukau Rail Link.<br />
Improving access between Manukau City and the eastern suburbs of <strong>Auckland</strong> City.<br />
New bus services to developing areas and network improvements.<br />
Better rail services, frequency and capacity.<br />
Improving ferry services including vehicular ferry infrastructure.<br />
Enhancing access and travel options to the Manukau City Centre including a rail link.<br />
Investigating and protecting alternatives to SH1 for north-south travel in the southern sector.<br />
18
Working towards Rugby World Cup 2011 (Kingsland Station)<br />
19
5 THE <strong>2009</strong>/12 PROGRAMME<br />
20<br />
The <strong>Auckland</strong> RLTP Preparation Process<br />
A critical part of preparing the RLTP is prioritising all proposals received<br />
from Approved Organisations (AO). This allows funding to be allocated<br />
to the highest priority activities in times when funding is limited.<br />
The funding of a programme of works is divided into three processes:<br />
> Funding prioritisation<br />
All proposals submitted to ARTA are first ranked to create a list<br />
of activities in priority order. This allows the whole programme to<br />
be ranked in order of importance, using the profiling process<br />
described below. Many of the submitters to previous LTPs<br />
commented that no single process can effectively prioritise<br />
activities from all areas of the region and across all transport<br />
modes; and concern was raised that the benefit/cost analysis<br />
used favoured roading activities at the expense of other modes<br />
of transport. The NZTA has addressed these concerns to some<br />
extent by lowering the discount rate and making changes to the<br />
value of time for public transport users. The net effect of these<br />
changes is to improve the benefit/cost ratio of expensive projects<br />
which have long-term benefits such as rail improvements and<br />
public transport projects to gain a more equal footing when<br />
compared against activities which advantage private vehicles.<br />
ARTA’s profiling process, as described below, has been designed<br />
to address these concerns. It should also be noted that when<br />
allocating funding, schemes are compared with similar types of<br />
schemes and monies distributed from distinct ‘pots‘, (called<br />
activity classes) so that for example, cycling schemes are<br />
compared with other cycling schemes and their funding comes<br />
from an allocated share of the total resources.<br />
> Project profiling process<br />
The profiling process is designed to ensure the RLTP gives effect<br />
to the RLTS and is consistent with the desired impacts of the<br />
Government Policy Statement (GPS). It has been developed in<br />
ARTA’s ATP with its longer-term view and strategy focus on<br />
integrated land use and transport development. The process is<br />
similar to the proven process used for the 2008/09 LTP and is also<br />
similar to the NZTA profiling process. The main point of difference<br />
is that ARTA has amended the Seriousness and Effectiveness<br />
criteria to ensure consistency with the guidance given in the May<br />
<strong>2009</strong> GPS while maintaining the ability of the prioritisation<br />
process to give effect to the RLTS, whereas the NZTA has replaced<br />
Seriousness and Urgency with Strategic Fit and altered the<br />
Effectiveness criteria. ARTA believes the changes we have made<br />
to the prioritisation process enable the RLTP to give effect to the<br />
RLTS, and be consistent with the GPS.<br />
The profiling process first extracts core items such as previously<br />
committed activities, maintenance and public transport service<br />
subsidies to be placed in the programme. ARTA chose to treat<br />
maintenance and public transport services as essential, and they<br />
are therefore funded before all other projects which are<br />
considered discretionary. Next, improvement activities are ranked<br />
to establish those projects to be included in the programme.<br />
><br />
Each activity is rated on:<br />
> The Seriousness of the issue being addressed.<br />
> The Effectiveness of the proposed solution in addressing the<br />
issue identified and in delivering regional/national strategic<br />
objectives.<br />
> The economic Efficiency (or benefit/cost ratio) of the<br />
proposed solution.<br />
In addition to the above factors, the urgency of a project is also<br />
considered, to rank the priority of projects with the same<br />
’Seriousness‘ rating. For instance, road works planned adjacent to<br />
the Western railway line, which is currently being duplicated, may<br />
need to be carried out before the double tracking is completed.<br />
Each project is rated High, Medium or Low (H, M or L) for each<br />
of the three factors resulting in a profile (e.g. HHM).<br />
Next, each project is considered for strategic balance. Strategic<br />
balance is a method of allocating funding to areas or types of<br />
project which may be under-represented. For example, as the<br />
transport problems in <strong>Auckland</strong> tend to be dominated by the<br />
urban areas, the rural transport problems could potentially be<br />
overlooked, but strategic balance gives the opportunity to redress<br />
the imbalance. In providing this strategic balance, the priority of<br />
each activity is still considered. Ensuring adequate transport<br />
provision for the Rugby World Cup 2011 is another example.<br />
Finally, in order to rank projects with the same profile, a points<br />
system is used which takes into account the extent to which<br />
projects align with:<br />
> The ‘Strategic Focus Areas’ stated in Chapter 4 – Statement<br />
of Priorities.<br />
> The short-term challenges as stated in Chapter 3.<br />
Appendix 2 provides a detailed description of this prioritisation<br />
process.<br />
Funding approval<br />
For the RLTP, the NZTA gives final funding approval for activities<br />
when the relevant phase of the activity is fully developed. Approval<br />
for construction funding requires that there are no impediments<br />
to construction starting, i.e. all consents must be in place prior to<br />
funding approval. Exceptions to this include ongoing maintenance<br />
and operational and administration programmes, which are often<br />
long-term contracts lasting at least three years – these are<br />
approved at the beginning of the financial year.<br />
The NZTA uses two stages when allocating funding to activities:<br />
> “N” funding is allocated first on the basis of national priority<br />
order within each activity class.<br />
> “R” funding is allocated to proposed activities that were not<br />
judged to be of sufficient national priority to be funded by N<br />
funds, but are considered important by the region.<br />
When the three-year National <strong>Land</strong> <strong>Transport</strong> <strong>Programme</strong> is<br />
released in August <strong>2009</strong>, some activities are approved for funding<br />
by the NZTA, but most are approved during the following three<br />
years, after monthly reviews with ARTA.
Major Activities in the <strong>2009</strong>/10–2011/12 <strong>Programme</strong><br />
It often takes many years for transport projects to be implemented.<br />
<strong>Land</strong> has to be acquired, feasibility reports, scheme assessments,<br />
detailed designs and public consultation have to be undertaken before<br />
any work on the ground can begin. It can also take a considerable<br />
amount of time to accumulate local funding and to agree national<br />
funding. Consequently, many schemes that were proposed in the<br />
previous programmes are only now coming to fruition.<br />
Whilst Travel Demand Measures and cycling and walking projects<br />
tend not to be ‘big ticket’ activities, accumulatively these activities<br />
are exceptionally effective in achieving important transport outcomes<br />
such as reducing congestion. There will be the opportunity for every<br />
school in the region to develop a travel plan (by 2014), and increasing<br />
support for school bus services and walking school buses.<br />
In addition there will be significant funding in the following public<br />
transport areas in the three-year time period of the RLTP:<br />
Major local roading and State highway projects which are scheduled<br />
to be constructed in the <strong>2009</strong>/10–2011/12 programme are (see<br />
Figure 5.1):<br />
> The Central Connector.<br />
> SH1 Newmarket Viaduct.<br />
> SH18 Hobsonville Deviation.<br />
> New roading connections and improvements associated with the<br />
New Lynn rail trenching and transport interchange.<br />
> Major roading projects in new development areas, especially<br />
Flat Bush, East Tamaki and Pukekohe.<br />
> Bus priority programmes.<br />
> Major pavement reconstruction.<br />
Major schemes proposed for study, investigation and design stage<br />
include:<br />
> CBD Rail Tunnel.<br />
> Crash reduction studies in <strong>Auckland</strong> City, Waitakere and Franklin.<br />
> Freight Transhipment studies on the State highway network.<br />
> Designation of Constellation to Albany busway extension.<br />
> Albany Highway Corridor upgrade.<br />
> CBD Waterfront access.<br />
><br />
><br />
><br />
><br />
Integrated fares and ticketing and the completion of the real<br />
time public information system.<br />
Trains<br />
Significant rail station upgrades will take place during the RLTP<br />
period, including major new transport interchanges at<br />
Newmarket, New Lynn and Manukau. KiwiRail will continue its<br />
programme of signalling upgrades and double tracking. The<br />
Western Line double tracking is expected to be completed by<br />
June <strong>2010</strong>.<br />
Electrification will build on the momentum achieved in <strong>Auckland</strong><br />
rail over the past five years in which patronage has grown from<br />
just over 2 million to over 7 million passenger trips per year. Seat<br />
capacity will be increased by at least 12.5 % over the three-year<br />
period as a result of additional and longer trains in service as<br />
more refurbished carriages are brought into operation. The<br />
Government has given its commitment to electrifying <strong>Auckland</strong>’s<br />
rail network and is working with the region on the mechanisms<br />
to deliver an electrified rail network.<br />
Buses<br />
Service improvements will be implemented on the Isthmus,<br />
Waitakere, North West Rodney, Manukau and Papakura including<br />
better connections to rail stations.<br />
Ferries<br />
> Half Moon Bay ferry terminal upgrade.<br />
> Hobsonville ferry terminal in conjunction with new<br />
housing development.<br />
> Bayswater ferry terminal design.<br />
> Birkenhead – installation of hydraulic ramp.<br />
Improving safety for all users of the transport system is inherently<br />
part of these projects and they would not proceed if they did not<br />
contribute to the enhancement of safety on the network.<br />
Many of the projects listed above, whether they are road-widening<br />
projects to allow bus lanes or rail improvements that will lead to<br />
greater efficiency and capacity, are delivering RLTS objectives. This<br />
will ultimately increase the person and goods carrying capacity of<br />
<strong>Auckland</strong>’s transport system.<br />
Traffic management improvements<br />
21
22<br />
Figure 5.1: Map of major construction schemes
Table 5.1 below compares the requested funding from the NZTA for the <strong>2009</strong>/12 RLTP with previous years’ LTPs by groups of similar types of<br />
projects called activity classes.<br />
Table 5.1: Summary of 2007/08 and 2008/09 LTPs and <strong>2009</strong>/10–2011/12 RLTP by GPS activity class (including commitments)<br />
Activity classes 2007/08<br />
Final LTP<br />
2008/09<br />
Final LTP<br />
<strong>2009</strong>–2012 Final RLTP<br />
<strong>2009</strong>/10 <strong>2010</strong>/11 2011/12<br />
Final RLTP Final RLTP Final RLTP<br />
($000) ($000) ($000) ($000) ($000)<br />
<strong>Transport</strong> Planning 4,699 3,690 17,215 13,193 13,450<br />
Demand Management and Community <strong>Programme</strong>s 12,332 15,408 13,496 14,481 15,245<br />
Walking and Cycling 27,939 29,270 27,807 28,731 35,611<br />
Public <strong>Transport</strong> Services 184,317 191,546 212,750 240,464 260,367<br />
Public <strong>Transport</strong> Infrastructure 17,466 57,034 141,063 132,159 85,297<br />
Maintenance Local Roads 80,978 84,042 87,224 90,216 93,111<br />
Maintenance State Highways 38,958 42,062 59,923 60,397 61,727<br />
Renewal of Local Roads 86,310 93,513 117,132 118,459 121,398<br />
Renewal of State Highways 28,309 27,427 36,043 38,928 40,086<br />
Infrastructure for Local Roads 237,073 245,007 230,346 275,400 220,785<br />
Infrastructure for State Highways 308,420 382,042 486,806 532,113 443,299<br />
Totals 1,026,801 1,171,042 1,429,805 1,544,542 1,390,375<br />
Note: The activity classes used in the GPS are not the same as used previously by NZTA or those used in the 2005 RLTS. In order to make the comparisons in Table 5.1<br />
we have used the best available information to map the previous activity classifications into the new activity classes, however, the mapping does not ‘fit’ completely,<br />
and should be taken into consideration when analysing the results.<br />
From Table 5.1 the following conclusions can be drawn comparing<br />
the 2007/08 and 2008/09 LTPs with the <strong>2009</strong>/10–2011/12 RLTP:<br />
> There has been a considerable increase in requests for funding<br />
for transport planning. This is in response to the NZTA signalling<br />
its desire for transport planning to be aligned with its refined<br />
funding processes. To support this, the NZTA has increased the<br />
Financial Assistance Rate (FAR) from 53% in the 2008/09 LTP to<br />
75% in the <strong>2009</strong>/10–2011/12 RLTP.<br />
> There is a large increase in funding requested for walking and<br />
cycling projects between 2008/09 LTP and the current RLTP.<br />
NZTA HNO have created a relatively large walking and cycling<br />
programme for the RLTP. This has offset a cut back in funding for<br />
walking and cycling projects by some local authorities. There is a<br />
danger that without local authority schemes to connect into the<br />
State highways schemes will not achieve their maximum effect.<br />
> There is a decline in funding requests for Travel Demand<br />
Management (TDM) and community programmes in the RLTP<br />
compared to previous LTPs. The reason for this is likely to be due<br />
to mapping of activity class definitions as walking and cycling<br />
projects that were previously classified as TDM activities.<br />
> Public transport services funding has increased for the RLTP<br />
period compared to previous LTPs. However, the increase is<br />
significantly less than was proposed in the draft RLTP due to both<br />
a shortage of local funding and a smaller increase in national<br />
funding through the <strong>2009</strong> GPS than was provided for in the<br />
2008 GPS. The large increase in expenditure predicted at the<br />
time of the draft RLTP was considered necessary to cater for the<br />
increase in patronage which is predicted during this period.<br />
Without the additional funding, it is unlikely that patronage will<br />
continue to rise as sharply as it has recently.<br />
><br />
><br />
><br />
><br />
><br />
Funding requests for local road maintenance have increased<br />
slightly while funding requests for renewals have increased<br />
significantly. The reason for this is that definitions of maintenance<br />
and renewals have recently changed.<br />
New local road infrastructure funding requests are similar to<br />
2007/08 levels. While territorial authorities are generally<br />
reducing their transport programmes, this has been off-set by<br />
the inclusion of Penlink which accounts for between $50m–<br />
$70m for each of the three years of the RLTP. There has been a<br />
marginal drop in funding between the draft and the final RLTP;<br />
this compares with a significant increase in previous LTPs. This is<br />
indicative of a reluctance by <strong>Auckland</strong> local authorities to invest<br />
in new or improved infrastructure due to a desire to minimise<br />
rate increases.<br />
New State highway infrastructure funding requests have<br />
increased by 55% between the draft RLTP and the final RLTP.<br />
This is in response to the large increases in this activity class<br />
provided for by GPS <strong>2009</strong> and the desire of the Government to<br />
construct roads of national significance. In the <strong>Auckland</strong> region,<br />
the increase is mainly due to funding of SH20 Waterview<br />
Connection. Although State highway funding peaks in <strong>2010</strong>/11,<br />
it remains significantly above the level of 2008/09.<br />
Passenger transport infrastructure has increased due to the<br />
inclusion of mainly rail related projects due to changes in funding<br />
arrangements as a result of not proceeding with the regional<br />
tax fuel.<br />
Compared to the previous one-year LTP planning cycle, this RLTP<br />
process requires Approved Organisations to have a detailed<br />
three-year forward plan for their transport programmes. This will<br />
improve transport planning and budgeting for the region and<br />
will require improved processes to be developed and resourced.<br />
23
GPS Funding Allocations and Requested Funds<br />
><br />
Public <strong>Transport</strong> Services and Operations<br />
The Minister of <strong>Transport</strong> issued the GPS to provide direction on the<br />
allocation of land transport funding, the GPS does this by allocating<br />
national funding to activity classes comprising:<br />
> <strong>Transport</strong> Planning<br />
> Maintenance and Operation of Local Roads<br />
> Renewal of Local Roads<br />
> Maintenance and Operation of State Highways<br />
> Renewal of State Highways<br />
> Improvement of State Highways<br />
> Improvement of Local Roads<br />
> Public <strong>Transport</strong> Infrastructure<br />
> Walking and Cycling Facilities<br />
> Demand Management and Community <strong>Programme</strong>s.<br />
The GPS has specified national funding ranges by activity class for the<br />
years <strong>2009</strong>/10 to 2014/15 and supplied forecast funding ranges from<br />
2015/16 to 2018/19. The range of available funding for each activity<br />
class has been defined by setting upper and lower funding bands.<br />
This RLTP matches these national funding ranges against the<br />
prioritised list of activities in each activity class.<br />
The comparison between current funding levels funding (as allocated<br />
in 2008/09 NLTP), funding that was proposed to be allocated in 2008<br />
GPS and funding allocated in the <strong>2009</strong> GPS is shown in Table 5.2.<br />
Table 5.2: Comparison between past and future funding allocations<br />
Activity class<br />
Estimated current Indicative 2008 Indicative <strong>2009</strong><br />
funding levels * allocation ** allocation **<br />
three-year GPS funding GPS funding<br />
Difference<br />
between <strong>2009</strong><br />
GPS and<br />
estimated current<br />
funding levels<br />
(1) (2) (3) (3–1)<br />
($M) ($M) ($M) ($M)<br />
New and Improved State Highways 2,592 1,830 3,055 463<br />
Maintenance of State Highways 837 930 885 48<br />
New and Improved Local Roads 693 550 550 -143<br />
Renewal of Local Roads 648 720 685 37<br />
Maintenance and Operation of Local Roads 711 795 755 44<br />
Public <strong>Transport</strong> Services 573 670 635 62<br />
Public <strong>Transport</strong> Infrastructure 432 400 135 -297<br />
Demand Management/Community <strong>Programme</strong>s 165 180 145 -20<br />
Walking and Cycling Facilities 54 70 50 -4<br />
Domestic Sea Freight Development 18 30 3 -15<br />
<strong>Transport</strong> Planning 117 110 105 -12<br />
* To estimate current three-year funding levels, the NLTP 2008/09 has been multiplied by 3.<br />
** Values are the indicative funding level as defined by MOT/NZTA.<br />
Source: Data supplied by MOT and NZTA.<br />
Table 5.2 compares the proposed allocation in the three-year 2008 GPS with the funding allocation in the three-year <strong>2009</strong> GPS and the 2008/09<br />
funding approved in the NLTP. In order to give a fair three-year comparison with current funding levels, the 2008/09 figures have been multiplied<br />
by 3 to give a three-year equivalent current funding estimate – this is shown in the column titled (1).<br />
24
The following conclusions can be drawn from the changes in funding<br />
allocations:<br />
> When comparing the <strong>2009</strong> GPS allocation (column (3)) with<br />
current funding levels (column titled (1)), there has been a large<br />
increase in funding for new and improved State highways, this<br />
reflects the Government’s philosophy to invest heavily in this area<br />
and contrasts markedly with the 2008 GPS allocation which<br />
proposed to reduce funding on State highways.<br />
> Maintenance and renewals of local roads and State highways,<br />
and public transport services have seen reductions in funding<br />
allocations in the <strong>2009</strong> GPS (column (3)) compared with 2008<br />
GPS (column (2)), but an increase compared to current funding<br />
levels (column (1)).<br />
> New and improved local roads are allocated the same funding in<br />
the <strong>2009</strong> GPS as in the 2008 GPS, but lower than current levels.<br />
> The funding allocated to public transport infrastructure has<br />
reduced in the <strong>2009</strong> GPS when compared to current levels and<br />
the 2008 GPS. A significant proportion of the reduction relates to<br />
Wellington rail commitments which will be funded outside the<br />
National <strong>Land</strong> <strong>Transport</strong> Fund (NLTF). The Government has<br />
requested that <strong>Auckland</strong> rail station funding is sought through<br />
the NTLF, however, it appears that insufficient allowance has been<br />
made for the additional call on funding in this activity class.<br />
> The funding allocated to demand management and walking/<br />
cycling facilities in the <strong>2009</strong> GPS has reduced when compared to<br />
both 2008 GPS and current levels, and therefore must be<br />
considered a contraction in real terms. However, the NZTA has<br />
indicated that there will also be cycling and walking benefits<br />
from additional investment in State highways.<br />
Table 5.3 compares the funding for transport proposed by this RLTP<br />
with the <strong>2009</strong> GPS transport funding allocations.<br />
Table 5.3: Comparison of funding requested through the RLTP and the <strong>2009</strong> GPS funding allocations<br />
Activity class Final RLTP Midpoint of<br />
Local share <strong>Regional</strong> Region total<br />
<strong>2009</strong> GPS<br />
NZTA share<br />
% <strong>Regional</strong><br />
NZTA share of<br />
the <strong>2009</strong> GPS<br />
(1) (2) (3) (4) (2)/(4)<br />
($M) ($M) ($M) ($M)<br />
<strong>Transport</strong> Planning 10 34 44 105 32%<br />
Demand Management and Community <strong>Programme</strong>s 11 32 43 143 23%<br />
Walking and Cycling Facilities 32 60 92 53 114%<br />
Public <strong>Transport</strong> Services 327 387 714 630 61%<br />
Public <strong>Transport</strong> Infrastructure 123 236 359 180 131%<br />
Maintenance Local Roads 150 121 271 728 17%<br />
Maintenance State Highways 0 182 182 928 20%<br />
Renewal Local Roads 198 159 357 690 23%<br />
Renewal State Highways 0 115 115 640 18%<br />
New and Improved Local Roads 328 399 727 600 67%<br />
New and Improved State Highways 0 1,462 1,462 2,963 49%<br />
Total 1,178 3,187 4,365 7,658 42%<br />
Table 5.3 shows that the total funding sought through this RLTP is over $4.36 billion of which $3.19 billion is from the NLTP and $1.18 billion is<br />
through local share. Overall, approximately 42% of national funds for transport are expected to be spent in the <strong>Auckland</strong> region.<br />
25
When taking into account the population and size of previous<br />
allocations, the majority of requests for funding for the <strong>Auckland</strong><br />
region’s activity classes appear reasonable, however, the following<br />
activity classes need further discussion:<br />
> Over 60% of the national allocation for public transport services<br />
is requested for the <strong>Auckland</strong> region. <strong>Auckland</strong> is experiencing a<br />
huge growth in public transport patronage which is supporting<br />
investment in the roading system by attracting trips that would<br />
have been made on congested arterials and motorways. The<br />
public are also demanding better services after many years of<br />
under-investment. <strong>Auckland</strong> suffers from peak-hour congestion<br />
to a much greater extent than other cities in New Zealand and it<br />
is public transport which is the most efficient mode to transport<br />
commuters in congested conditions – especially the rapid transit<br />
busway and rail networks. Due to a shortfall in local share for<br />
public transport services, ARTA has reduced the request for<br />
national share by $51 million between the draft and the final<br />
RLTP. Any further reduction in public transport service funding<br />
would put at risk the increases in patronage recently experienced<br />
and would threaten the GPS impact of improved national<br />
economic growth and productivity by increasing congestion on<br />
arterial roads and motorways.<br />
> The <strong>Auckland</strong> region over-subscribes the national allocation for<br />
walking and cycling facilities, consequently it is likely the NZTA<br />
will only fund higher-priority activities. Around a quarter of all<br />
walking and cycling projects are NZTA HNO projects. Often,<br />
walking and cycling schemes associated with motorways are<br />
necessary to mitigate the barrier effects to movement on<br />
pedestrians and cyclists created by the building of the motorway.<br />
In these cases, where the purpose of the scheme is to mitigate<br />
the negative effects of the motorway, whether the motorway is<br />
existing or proposed, the costs of these schemes should be borne<br />
by the New and Improved Infrastructure for State Highway<br />
activity class as opposed to the Walking and Cycling activity class.<br />
This would reduce the over-subscription in walking and cycling<br />
facilities. ‘R’ funds would be an appropriate funding source to<br />
support projects in this activity class, as walking and cycling are<br />
the most effective mode for decongesting roads for short trips.<br />
> The Public <strong>Transport</strong> Infrastructure activity class is substantially<br />
over-subscribed. This is due to the reduction in allocation from<br />
the 2008 GPS to the <strong>2009</strong> GPS and the decision not to proceed<br />
with the regional fuel tax. The <strong>Auckland</strong> region’s request for<br />
funding, at the invitation of the Government, includes rail<br />
stations, which had not previously been expected to be funded<br />
through this activity class. This infrastructure is essential for<br />
<strong>Auckland</strong> transport network and funds must be made available,<br />
especially as many of the projects are necessary for the Rugby<br />
World Cup 2011. Discussions are currently underway between<br />
regional and government funding agencies to resolve the funding<br />
of <strong>Auckland</strong>’s rail upgrade.<br />
These issues are discussed more fully in the following section which<br />
summarises the RLTP by activity class.<br />
Summary of the RLTP by Activity Class<br />
The full list of prioritised projects for this RLTP is contained in<br />
Chapter 10. The following section summarises the key aspects of the<br />
RLTP by activity class including:<br />
> Key projects.<br />
> Important issues affecting the successful implementation of<br />
projects.<br />
> Recommendations on the allocation of funding across activity<br />
classes.<br />
Newmarket development<br />
26
Table 5.4: Summary of the RLTP by Activity Class<br />
<strong>Transport</strong> Planning<br />
Demand Management and Community <strong>Programme</strong>s<br />
Key planned<br />
projects<br />
><br />
><br />
><br />
Crash reduction planning by the NZTA and TAs.<br />
Freight strategies and plans by the NZTA, ARC and TAs.<br />
Corridor designation for the additional Waitemata Harbour<br />
Crossing to improve accessibility for all modes from and to<br />
the North of the Isthmus.<br />
><br />
><br />
><br />
Continued school and work travel planning by ARTA and<br />
the TAs to achieve the target of a 9% reduction in car trips<br />
to school and a reduction in car trips to participating work<br />
places by 2016.<br />
Community road safety projects such as child restraint<br />
clinics, drink driving and driver speed education will<br />
contribute to achieving 400 or fewer fatal and serious<br />
crashes by 2012.<br />
Trialling new and innovative tools and techniques such as<br />
personalised journey planning, carpooling and area-wide<br />
travel planning to increase travel choices.<br />
Value<br />
National GPS<br />
lower and<br />
upper bands<br />
Total = $43.9m<br />
NZTA share = $34.0m<br />
Local share = $9.8m<br />
Proportion of midpoint national share = 32%<br />
Lower = $96m<br />
Upper = $114m<br />
Total = $43.2m<br />
NZTA share = $32.5m<br />
Local share = $10.8m<br />
Proportion of midpoint national share = 23%<br />
Lower = $120m<br />
Upper = $165m<br />
Issues<br />
Effect<br />
required on<br />
GPS impacts<br />
> Sufficient funds are available within the GPS funding > Sufficient funds are available within the GPS funding<br />
allocation.<br />
allocation.<br />
> Anticipated future growth and GPS impacts require step<br />
changes in the way people and goods are moved<br />
compared to current patterns. Good quality transport<br />
planning is essential to achieve these changes.<br />
><br />
><br />
Establishing innovative and effective demand management<br />
techniques and increasing school and workplace travel<br />
plans, offers wider travel choices, which reduces reliance<br />
on travel by private car, which in turn decongests local<br />
roads.<br />
Community road safety programmes significantly<br />
contribute to reducing road deaths and serious injuries on<br />
<strong>Auckland</strong>’s road network.<br />
Walking and Cycling Facilities<br />
Public <strong>Transport</strong> Services<br />
Key planned<br />
projects<br />
><br />
><br />
><br />
><br />
Providing walking and cycling facilities on local roads<br />
affected by the SH20 – SH1 motorway connection.<br />
Improvements to the Northwestern cycleway.<br />
Designing and constructing a cycle connection between<br />
SH1 and SH16 in the central Isthmus.<br />
Constructing over 38 kilometres of off-road walking and<br />
cycling facilities in Flat Bush.<br />
><br />
><br />
><br />
><br />
Improved connectivity into rail stations plus further<br />
development of high-quality, high-frequency services.<br />
Bus service improvements on Isthmus, Waitakere, NW<br />
Rodney, Manukau and Papakura.<br />
Provision of a new ferry service to Hobsonville.<br />
Increasing train services towards 10 minutes peak and 15<br />
minutes off-peak and extending operating hours.<br />
Value<br />
National GPS<br />
lower and<br />
upper bands<br />
Total = $92.2m<br />
NZTA share = $59.9m<br />
Local share = $32.2m<br />
Proportion of midpoint national share = 114%<br />
Lower = $30m<br />
Upper = $75m<br />
Total = $713.6m<br />
NZTA share = $386.7m<br />
Local share = $326.8m<br />
Proportion of midpoint national share = 61%<br />
Lower = $585m<br />
Upper = $675m<br />
Issues<br />
><br />
><br />
The NZTA share required for the <strong>Auckland</strong> region exceeds<br />
the midpoint of the national GPS band by $7 million or<br />
14% and would require 80% of the national upper band.<br />
Walking and cycling schemes associated with motorways<br />
are sometimes necessary to mitigate the barrier effects to<br />
movement on pedestrians and cyclists created by the<br />
building of the motorway. In these cases, where the<br />
purpose of the scheme is to mitigate the negative effects<br />
of the motorway, whether the motorway is existing or<br />
proposed, the costs of these schemes could be borne by<br />
the New and Improved Infrastructure for State Highway<br />
activity class as opposed to the Walking and Cycling activity<br />
class. This would reduce the over-subscription in walking<br />
and cycling facilities.<br />
><br />
><br />
><br />
Sufficient funding is available within the national GPS<br />
allocation. Proposed improvements are limited by the<br />
availability of funds. At this level of funding, some<br />
reductions in bus services will be necessary.<br />
Bus service improvements require integrated ticketing and<br />
fares, and bus priority measures on local roads and State<br />
highways to optimise patronage growth.<br />
Rail service improvements and electrification are dependent<br />
on KiwiRail’s infrastructure programme and timetable.<br />
27
Table 5.4: Summary of the RLTP by Activity Class (Continued)<br />
Issues<br />
(continued)<br />
><br />
><br />
><br />
The upper GPS band could be increased by transferring R<br />
funds from New Infrastructure State Highways. This would<br />
enable this shortfall to be met and still allow the full State<br />
Highway New Infrastructure programme to be carried out.<br />
There is a significant increase in the planned provision for<br />
walking and cycling facilities on the State highway network<br />
compared to previous years.<br />
Initial indications are that there is a reduction in TA<br />
programmes for walking and cycling.<br />
><br />
><br />
><br />
Sufficient funding is available within the national GPS<br />
allocation. Proposed improvements are limited by the<br />
availability of funds. At this level of funding, some<br />
reductions in bus services will be necessary.<br />
Bus service improvements require integrated ticketing and<br />
fares, and bus priority measures on local roads and State<br />
highways to optimise patronage growth.<br />
Rail service improvements and electrification are dependent<br />
on KiwiRail’s infrastructure programme and timetable.<br />
Effect<br />
required on<br />
GPS impacts<br />
> For short trips – less than 5 kilometres – walking and<br />
cycling are the most efficient and often the quickest<br />
modes. Many trips in the urban conurbation in the<br />
<strong>Auckland</strong> region are relatively short and fit into this<br />
category. Increasing walking and cycling rates has<br />
the effect of decongesting urban roads, which will improve<br />
the efficiency of the transport network.<br />
> The GPS requires transport investment that supports<br />
economic and productivity growth. Public transport trips<br />
decongest urban arterials allowing them to become<br />
available for freight and economically important trips.<br />
Public <strong>Transport</strong> Infrastructure<br />
Maintenance of Local Roads<br />
Key planned<br />
projects<br />
><br />
><br />
Electrification of the <strong>Auckland</strong> rail network. **<br />
Implementing integrated public transport fares and<br />
providing an electronic smartcard ticket for use on all<br />
public transport modes.<br />
><br />
Ongoing programmes of maintaining the region’s local<br />
road network up to an acceptable standard. Maintenance<br />
includes roads, bridges and drain maintenance.<br />
><br />
Route designation for the CBD Rail Tunnel to support<br />
future growth of the CBD and region, and optimise the<br />
capacity of the existing network.<br />
><br />
Provision of new ferry infrastructure in the inner harbour<br />
and upgrading the Half Moon Bay vehicular and<br />
passenger terminal.<br />
><br />
Constructing new rail stations and transport interchanges<br />
at Newmarket, New Lynn and Manukau.<br />
><br />
Completion of the Western Line double tracking. **<br />
><br />
Completion of the Central Transit Corridor between<br />
Newmarket and Britomart.<br />
><br />
Construction of a Park and Ride facility at Silverdale.<br />
Value<br />
GPS lower<br />
and upper<br />
bands<br />
Total = $358.5m<br />
NZTA share = $235.9m<br />
Local share = $122.6m<br />
Proportion of midpoint national share = 131%<br />
Lower = $60m<br />
Upper = $300m<br />
Total = $270.6m<br />
NZTA share = $120.6m<br />
Local share = $150m<br />
Proportion of midpoint national share = 17%<br />
Lower = $630m<br />
Upper = $825m<br />
Issues<br />
Effect<br />
required on<br />
GPS impacts<br />
> The NZTA share requested exceeds the national mid-point<br />
of the GPS band by $56m or 31%, but is still below the<br />
upper band of $300m. ARTA’s view is that funding should<br />
be transferred from other areas if necessary, given the<br />
significant benefits to all transport users generated by<br />
public transport infrastructure investment.<br />
> Sufficient funds are available. Surplus funding in<br />
maintenance should be redistributed to local road renewals<br />
which are a related activity.<br />
> The GPS requires transport investment that supports<br />
economic and productivity growth. Public transport trips<br />
decongest urban arterials which then become available for<br />
freight and economically important trips.<br />
> Improving the riding surface of roads has a dramatic effect<br />
on fuel use and vehicle efficiency. Well-maintained roads<br />
require less emergency treatment and therefore have more<br />
reliable journey times, which will contribute to GPS targets.<br />
28
Table 5.4: Summary of the RLTP by Activity Class (Continued)<br />
Maintenance of State Highways<br />
Local Road Renewals<br />
Key planned<br />
projects<br />
> Ongoing programmes of maintaining the region’s local<br />
road network up to an acceptable standard. Maintenance<br />
includes roads, bridges and drain maintenance.<br />
> Ongoing programmes of renewal of local roads, which<br />
includes re-metalling unsealed roads, resurfacing sealed<br />
roads, replacing drainage and traffic signals and<br />
reconstructing damaged road structures.<br />
Value Total = $182m<br />
NZTA share = $182m<br />
Proportion of midpoint national share = 20%<br />
Total = $357m<br />
NZTA share = $158.9m<br />
Local share = $198.1m<br />
Proportion of midpoint national share = 23%<br />
GPS lower<br />
and upper<br />
bands<br />
Lower = $830m<br />
Upper = $1,025m<br />
Lower = $630m<br />
Upper = $750m<br />
Issues<br />
> The <strong>Auckland</strong> region has the highest proportion of<br />
motorways in the country. The length of motorway has<br />
increased recently with the completion of Alpurt B2 and a<br />
further section of SH20, which will increase maintenance<br />
costs. The costs of carrying out maintenance in the<br />
<strong>Auckland</strong> region is considerably higher than in the rest of<br />
the country due congestion and high occupation of the<br />
network. If necessary, due to the importance and priority of<br />
maintenance, additional funds should be transferred from<br />
lower priority new infrastructure projects.<br />
> There are likely to be sufficient funds available for this<br />
activity class. There has been a reduction in the requests for<br />
funding in this activity class between the draft and final<br />
RLTP.<br />
Effect<br />
required on<br />
GPS impacts<br />
><br />
GPS impacts require a reduction in fatalities and<br />
hospitalisation from road crashes. Well-maintained roads<br />
are safer to drive. This is particularly true of State highways<br />
where speeds are higher.<br />
><br />
GPS impacts require a reduction in fatalities and<br />
hospitalisation from road crashes. Well-maintained roads<br />
are safer to drive. This is particularly true of State highways<br />
where speeds are higher.<br />
><br />
Improving the riding surface of roads has a dramatic effect<br />
on fuel use and vehicle efficiency. Well-maintained roads<br />
require less emergency treatment and therefore have more<br />
reliable journey times which will contribute to GPS impacts.<br />
><br />
Improving the riding surface of roads has a dramatic effect<br />
on fuel use and vehicle efficiency. Well-maintained roads<br />
require less emergency treatment and therefore have more<br />
reliable journey times, which will contribute to GPS<br />
impacts.<br />
State Highway Renewals<br />
New Local Road Infrastructure<br />
Key Planned<br />
Projects<br />
> Ongoing programme of renewal of State highways, which<br />
includes re-surfacing sealed roads, replacing drainage and<br />
traffic signals and reconstructing damaged road structures.<br />
><br />
><br />
><br />
><br />
><br />
New Lynn local road improvements to integrate the<br />
surrounding network with the passenger transport<br />
interchange and underground of New Lynn rail station.<br />
Mill Road route protection.<br />
Designation for the AMETI multi-modal corridor.<br />
Upgrading of Albany Highway.<br />
Construction of the Whangaparaoa Peninsula<br />
Link Road (Penlink).<br />
Value<br />
GPS lower<br />
and upper<br />
bands<br />
Total = $115.1m<br />
NZTA share = $115.1m<br />
Proportion of midpoint national share = 18%<br />
Lower = $580m<br />
Upper = $700m<br />
Total = $726.5m<br />
NZTA share = $398.8m<br />
Local share = $327.7m<br />
Proportion of midpoint national share = 66%<br />
Lower = $450m<br />
Upper = $750m<br />
Issues<br />
> The <strong>Auckland</strong> region has the highest proportion of<br />
motorways in the country. The length of motorway has<br />
increased recently with the completion of Alpurt B2 and a<br />
further section of SH20, which will increase maintenance<br />
costs. The costs of carrying out maintenance in the <strong>Auckland</strong><br />
region is considerably higher than in the rest of the country<br />
due to congestion and high occupation of the network. If<br />
necessary, due to the importance and priority of<br />
maintenance, additional funds should be transferred from<br />
lower priority work categories.<br />
> The <strong>Auckland</strong> region’s bid for national funding is 66% of<br />
the national GPS midpoint and 53% of national GPS upper<br />
band for this activity class. Therefore it is likely NZTA will<br />
not be able to fund low priority activities.<br />
29
Table 5.4: Summary of the RLTP by Activity Class (Continued)<br />
Effect<br />
required on<br />
GPS impacts<br />
><br />
><br />
GPS impacts require a reduction in fatalities and serious<br />
injuries from road crashes. Well-maintained roads are safer<br />
to drive. This is particularly true of State highways where<br />
speeds are higher.<br />
Improving the riding surface of roads has a dramatic effect<br />
on fuel use and vehicle efficiency. Well maintained roads<br />
require less emergency treatment and therefore have more<br />
reliable journey times, which will contribute to GPS targets.<br />
><br />
GPS impacts require improvements in journey time<br />
reliability and an easing of severe congestion. New and<br />
improved local roads will help to meet these impacts.<br />
New State Highway Infrastructure<br />
Key Planned<br />
Projects<br />
><br />
><br />
Completing the Western Ring Route with the<br />
implementation of the SH20–SH1 Manukau link, SH18<br />
extension from Hobsonville to Westgate and the Waterview<br />
connection will provide a complete alternative for the<br />
movement of people and goods to State Highway 1 from<br />
Manukau through to Albany, providing both regional and<br />
inter-regional benefits.<br />
To reduce southbound congestion on the Southern<br />
Motorway, a fourth southbound lane on the motorway<br />
between Gillies Avenue and Greenlane will be constructed,<br />
and the Newmarket Viaduct will be replaced with a new<br />
structure.<br />
Value<br />
GPS lower<br />
and upper<br />
bands<br />
Total = $1,462.2m<br />
NZTA share = $1,462.2m<br />
Proportion of midpoint national share = 49.4%<br />
Lower = $2,475m<br />
Upper = $3,450m<br />
Issues<br />
Effect<br />
required on<br />
GPS impacts<br />
><br />
><br />
Sufficient funds are available within the GPS funding<br />
allocation. NZTA highways and Network Operations have<br />
increased their bid for funding by $509m since the draft<br />
RLTP – this is a very significant increase.<br />
GPS impacts require improvements in journey time<br />
reliability and an easing of severe congestion. New and<br />
improved State highways will help to meet these impacts.<br />
**<br />
Note: While projects such as electrification of the rail network and the purchase of electric trains will be funded from sources other than the <strong>Regional</strong> <strong>Land</strong> <strong>Transport</strong><br />
<strong>Programme</strong>, they are key components of the <strong>Auckland</strong> transport system.<br />
***<br />
Note: ARTA’s administration and professional services costs are not included in the above table or the detailed funding requests, but are included in LTP Online.<br />
30
6 FUNDING PLAN<br />
Ten-year Funding Forecast<br />
The anticipated total spending forecast for ARTA, territorial authorities<br />
and State highways for the next ten years that will be delivered<br />
through the RLTP process is shown in Figure 6.1. It can be seen that<br />
total anticipated funding for these activities is reducing over time.<br />
Figure 6.1: Ten-year funding forecast for activities funded through the RLTP<br />
1,800<br />
1,600<br />
1,400<br />
1,200<br />
Funding ($m)<br />
1,000<br />
800<br />
600<br />
400<br />
New Infrastructure State Highways<br />
Maintenance and Renewals State Highways<br />
New Infrastructure Local Roads<br />
Maintenance and Renewals Local Roads<br />
PT Infrastructure<br />
PT Services<br />
TDM and Walking and Cycling<br />
<strong>Transport</strong> Planning<br />
200<br />
0<br />
<strong>2009</strong>/10 <strong>2010</strong>/11 2011/12 2012/13 2013/14 2014/15 2015/16 2016/17 2017/18 2018/2019<br />
The main points emerging from Figure 6.1 are:<br />
> Planned expenditure on State highway new and improved<br />
infrastructure projects is anticipated to increase markedly until<br />
<strong>2010</strong>/11, peaking at over $532 million then declining steadily to<br />
about $225 million in 2018/19. This is largely due to many major<br />
works to the <strong>Auckland</strong> network being constructed or completed<br />
in the early years of the programme.<br />
> There is an increase in maintenance and renewals for local roads<br />
from $204 million in <strong>2009</strong>/10 to about $297 million in 2018/19,<br />
indicating not only a larger local roading network as growth<br />
occurs, but also an ageing network requiring more significant<br />
maintenance and renewal work.<br />
><br />
There is a significant decrease in expenditure on passenger<br />
transport infrastructure from $141 million in <strong>2009</strong>/10 to about<br />
$8 million in 2018/19. This includes rail-related infrastructure but<br />
not electrification or electric trains. It represents a potentially<br />
worrying trend as the expenditure on public transport services is<br />
forecast to increase. A declining expenditure on passenger<br />
transport infrastructure such as bus priority measures will<br />
significantly reduce the benefits from, and increase the costs of,<br />
providing improved public transport services.<br />
31
R and C Funding<br />
It is estimated that the entire R and C funds that will be (and have<br />
been) available are approximately $1,060 million, the exact amount<br />
will depend on the tax accrued from fuel levies in the region. Of<br />
these $1,060 million the region has spent (including spending to the<br />
end of 2008/09) $174 million. The region has made further allowance<br />
for future spending of $181 million, mainly on State highway new<br />
infrastructure, leaving $705 million available.<br />
The vast majority of R and C funds spent and allocated to date are for<br />
State highway projects. To ensure sufficient funding is available for<br />
other transport projects and modes, ARTA recommended to the<br />
NZTA that a cap of $661 million be applied to the amount that could<br />
be spent on State highway projects. This was supported by the<br />
<strong>Regional</strong> <strong>Transport</strong> Committee. The cap equates to 62% of the total<br />
R and C funds available, which is the proportion indicated in the RLTS<br />
for all roading projects. This leaves the remaining funding to be spent<br />
on TDM and passenger transport infrastructure, again in proportion<br />
to allocations indicated in the RLTS. This RLTP retains this position on<br />
the allocation of R and C funds. Figure 6.2 shows how R and C funds<br />
have been spent to date and future spending indicated in the GPS<br />
funding allocations. Committed R and C funding expenditure consists<br />
mainly of State highway but also includes public transport<br />
infrastructure such as bus priorities on arterial roads, as well as<br />
walking and cycling projects, such as the Orewa West cycleway.<br />
It should be noted that the above funding allocations for R and C<br />
funding make no allowance for road reconstruction or seal extension<br />
projects, which may make calls upon R and C funding if there are<br />
insufficient N funds available for these activity classes.<br />
Figure 6.2: R and C funds spent, committed and available against RLTS activity classes<br />
1,200,000,000<br />
R and C – Funds available<br />
1,000,000,000<br />
R and C – Funds committed<br />
R and C – Funds spent<br />
800,000,000<br />
600,000,000<br />
400,000,000<br />
200,000,000<br />
0<br />
Roading<br />
TDM and walking<br />
and cycling<br />
PT infrastructure<br />
<strong>Auckland</strong> R and C funds<br />
32
Unsubsidised Schemes<br />
In preparing the <strong>Auckland</strong> RLTP, ARTA is required to include all<br />
significant expenditure from sources other than NZTA. Table 6.1<br />
shows the planned unsubsidised expenditure by territorial authorities<br />
and ARTA.<br />
Table 6.1: Unsubsidised funding<br />
Territorial<br />
authority<br />
<strong>2009</strong>/10 <strong>2010</strong>/11 2011/12 2012/13 2013/14 2014/15 2015/16 2016/17 2017/18 2018/19<br />
($000) ($000) ($000) ($000) ($000) ($000) ($000) ($000) ($000) ($000)<br />
<strong>Auckland</strong> City 51,943 64,537 46,765 30,262 31,748 30,820 31,145 29,050 29,050 29,050<br />
Manukau City 10,592 10,661 11,128 11,128 11,128 11,128 11,128 11,128 11,128 11,128<br />
North Shore City 6,027 6,373 6,724 7,094 7,487 7,884 8,299 8,739 9,200 9,691<br />
Waitakere City 16,167 41,145 33,848 25,114 22,711 20,807 20,982 8,238 8,266 8,287<br />
Papakura District 2,481 3,578 2,972 4,467 5,373 3,294 1,717 1,551 2,780 1,533<br />
Rodney District 10,537 6,989 15,606 10,750 3,624 3,560 2,310 2,410 2,410 1,410<br />
Franklin District 15,844 17,793 16,959 17,732 19,818 18,805 18,136 23,821 24,544 18,234<br />
ARTA 47,481 24,809 23,078 12,006 7,883 6,789 6,730 6,872 7,016 7,160<br />
Total 161,072 175,885 157,078 118,553 109,771 103,087 100,447 91,809 94,395 86,493<br />
For the territorial authorities, unsubsidised funding includes a variety<br />
of activities such as footpath maintenance, construction material<br />
considered important for heritage or urban design purposes, which<br />
tend to be more expensive than standard materials, and seal<br />
extensions in rural areas which have a low benefit/cost ratio. For<br />
ARTA this includes rolling stock and stabling facilities.<br />
33
7 ROAD POLICING ACTIVITIES<br />
Road policing in the <strong>Auckland</strong> region includes road safety education<br />
and enforcement activities funded by the NZTA and delivered by the<br />
New Zealand Police. These activities make up the majority of road<br />
safety funding in the <strong>Auckland</strong> region, at $71 million in 2008/09.<br />
Police activities cover both State highways and local roads and<br />
include:<br />
> Speed enforcement.<br />
> Drinking and/or drugged driver control.<br />
> Restraint device (safety belt) control.<br />
> General visible road safety enforcement.<br />
> Commercial vehicle investigation and road user charges<br />
enforcement.<br />
> Crash attendance and investigation, and prosecutions.<br />
> Community service and school road safety education.<br />
> Traffic management.<br />
These activities target road safety risk areas identified by local road<br />
safety action plans. These plans are informed by Local Road Safety<br />
Strategies, the <strong>Regional</strong> Road Safety Plan and, at a higher level, the<br />
Road Safety to <strong>2010</strong> Strategy, Road Policing to <strong>2010</strong> Strategy and<br />
New Zealand <strong>Transport</strong> Strategy. The activities are delivered by traffic<br />
police and general duties staff across the three police districts of<br />
Waitemata (North Shore City, Rodney District and Waitakere City),<br />
<strong>Auckland</strong> (<strong>Auckland</strong> City), and Counties Manukau (Manukau City,<br />
Papakura District and Franklin District).<br />
Funding for road policing activities in the region has increased over<br />
the last three years, mostly in the areas of traffic camera operations,<br />
crash attendance, compulsory breath testing operations, and<br />
motorway traffic management, with beneficial results. New Zealand<br />
Police provide a valuable service to the region in terms of road safety.<br />
ARTA has sought the advice of road safety professionals via the<br />
RoadSafe <strong>Auckland</strong> working group and the New Zealand Police<br />
themselves. In general, there is strong support in the region for<br />
increased speed enforcement on local urban and rural roads,<br />
including the introduction of more speed cameras, increased mobile<br />
and compulsory breath testing operations, and improved delivery of<br />
school road safety education.<br />
Road policing district performance is measured in terms of key<br />
indicators including:<br />
> Fatal and serious crash reduction.<br />
> Number of compulsory breath tests.<br />
> Mean average speeds and restraint use.<br />
> Visible enforcement and school road safety delivery.<br />
> Road safety action planning.<br />
> Attitude change from respondents in the annual Ministry of<br />
<strong>Transport</strong>’s (MOT) Public Attitudes to Road Safety survey.<br />
Results for 2007/08 for the <strong>Auckland</strong> region indicate that good<br />
progress has been made in reducing fatal crashes in the <strong>Auckland</strong><br />
and Waitemata police districts, however, the Counties Manukau<br />
Police District reported an increase in fatal crashes beyond the target<br />
figures for 2007/08.<br />
Although driver alcohol breath tests have also been on target across<br />
all three districts, the percentage of driver fatalities with excess<br />
alcohol was twice the national target of 21%, at 41%. The MOT<br />
survey shows that on average 81% of drivers still exceed the urban<br />
speed limit of 50 km/h in built-up environments, and only 50% of<br />
<strong>Auckland</strong> drivers believe there is a high probability of the detection of<br />
speeding by New Zealand Police. Mean urban speeds in the <strong>Auckland</strong><br />
region are the highest in the country at 55.3 km/h, and the 85th<br />
percentile open road speed in the region is also the highest in the<br />
country at 109 km/h. The MOT survey also indicates that the<br />
percentage of children properly restrained in vehicles was below the<br />
target of 98% for 2007/08, by 8% across the region. The region as<br />
a whole has a long-standing issue of under-delivery by New Zealand<br />
Police of road safety education in primary schools.<br />
ARTA, in collaboration with RoadSafe <strong>Auckland</strong> and New Zealand<br />
Police, recommends via the <strong>Regional</strong> <strong>Land</strong> <strong>Transport</strong> <strong>Programme</strong> that<br />
the NZTA resource an increase in speed enforcement on urban and<br />
rural local roads, and non-motorway State highways, and increased<br />
use of speed camera technology. Also recommended are increased<br />
mobile and compulsory breath testing, and the improved delivery of<br />
road safety education in schools by New Zealand Police. ARTA and<br />
RoadSafe <strong>Auckland</strong> recommend that the NZTA’s State Highways<br />
Division investigate resourcing its own traffic management operations<br />
to allow the New Zealand Police to focus on road safety enforcement<br />
activities on the growing motorway network.<br />
The benefits of funding police road safety enforcement have been<br />
established as significant, particularly for speed, drink/driving and<br />
safety belt enforcement. Internationally, the benefit/cost ratio for<br />
fully implemented best practice police enforcement of these areas<br />
has been demonstrated as between 5:1 and 10:1. Apart from the<br />
physical cost of crashes it should be remembered that the social cost<br />
of crashes in the <strong>Auckland</strong> region amounts to approximately $1 billion<br />
per annum.<br />
Road policing in the <strong>Auckland</strong> region has been funded consistently at<br />
26.1% of the national road policing budget for the last three years.<br />
National road policing funding for the three-year period from<br />
2006/07 to 2008/09 was $757 million, and the regional <strong>Auckland</strong><br />
share of this was $197.5 million (26.1%).<br />
Road policing staff as a whole for the <strong>Auckland</strong> region has increased<br />
by 33 FTE’s (full-time equivalents) in the three-year period from<br />
2006/07 to 2008/09. This represents an equivalent overall staff<br />
increase of 7.8%.<br />
The <strong>Auckland</strong> region’s population for the next three years, from<br />
<strong>2009</strong>/10 to 2011/12, is estimated to grow by 5% to a total of<br />
1,482,950 in 2011/12, along with increasing vehicle ownership,<br />
34
vehicle kilometres travelled, and the kilometre length of the road<br />
network being serviced by Police. The average annual social cost of<br />
crashes in the region for 2005 to 2007 was 27% of the national<br />
social cost.<br />
In light of the above, ARTA and RoadSafe <strong>Auckland</strong> recommend<br />
a three-year regional road policing budget of $243 million<br />
($78.3 million in <strong>2009</strong>/10, $81 million in <strong>2010</strong>/11, 83.7 million in<br />
2011/12). This represents 27% of the annual national road policing<br />
budget and is an equivalent increase of 29.8 FTE’s between <strong>2009</strong>/10<br />
and 2011/12, targeting local urban and rural speed, non-motorway<br />
State highway speed, speed camera technology, red light camera<br />
enforcement, drink driving, and improved structural co-ordination<br />
of road safety education in schools. This increase reflects the<br />
proposed middle band of the GPS allocation of national road policing<br />
from <strong>2009</strong>/10 to 2011/12.<br />
Continual refinement of road policing delivery according to crash risk<br />
via risk targeted patrol plans, road safety action plans, and road<br />
policing tactical assessments are also encouraged.<br />
Police activities<br />
35
8 MONITORING<br />
Implementing the <strong>Regional</strong> <strong>Land</strong> <strong>Transport</strong> Strategy<br />
The <strong>Auckland</strong> RLTS<br />
The <strong>Regional</strong> <strong>Land</strong> <strong>Transport</strong> <strong>Programme</strong> is the mechanism through<br />
which the 2005 <strong>Auckland</strong> <strong>Regional</strong> <strong>Land</strong> <strong>Transport</strong> Strategy (RLTS) is<br />
implemented. Table 8.1 shows the general allocation of funding<br />
required by the 2005 RLTS to be taken into account when preparing<br />
the <strong>Regional</strong> <strong>Land</strong> <strong>Transport</strong> <strong>Programme</strong>.<br />
Table 8.1: RLTS funding allocation<br />
> Travel Demand Management<br />
4%<br />
> Public <strong>Transport</strong><br />
34%<br />
> Infrastructure<br />
18%<br />
Assessment Against the 2005 RLTS Funding Categories<br />
This <strong>2009</strong>/10–2011/12 <strong>Auckland</strong> RLTP was assessed against the RLTS<br />
funding targets and the overall results of the assessment are shown<br />
in Table 8.2 and Figures 8.1 and 8.2. In order to provide a complete<br />
picture of transport funding in relation to the RLTS funding categories,<br />
the estimated cost of each activity was analysed from the information<br />
provided by the submissions from Approved Organisations as well as<br />
information from KiwiRail, and then apportioned appropriately to<br />
one or more of the RLTS funding categories.<br />
Comparison of the <strong>2009</strong>/10–2011/12 RLTP with Previous LTPs<br />
Table 8.2 compares the programmed expenditure of previous final<br />
LTPs (2006/07, 2007/08 and 2008/09) with the current RLTP by RLTS<br />
category in dollar terms and as a percentage of the total LTP request.<br />
> Services<br />
16%<br />
> Roads<br />
62%<br />
> Infrastructure<br />
30%<br />
> Safety Measures<br />
4%<br />
> Traffic Management<br />
2%<br />
> Maintenance and Renewals<br />
26%<br />
Table 8.2: Planned expenditure by RLTS work category (2006/09 to <strong>2009</strong>/012)<br />
Threeyear<br />
period<br />
Total<br />
expenditure<br />
($000)<br />
Road<br />
Maintenance<br />
Expenditure against RLTS category ($000)<br />
Traffic Safety Road Public<br />
Management<br />
Infrastructure <strong>Transport</strong><br />
Services<br />
Public<br />
<strong>Transport</strong><br />
Infrastructure<br />
TDM<br />
2006–<strong>2009</strong> 4,149,748 858,192 75,957 227,716 1,352,866 522,763 991,503 120,751<br />
<strong>2009</strong>–2012 5,142,751 1,027,875 91,082 162,571 1,783,563 797,926 1,116,646 163,088<br />
2006–<strong>2009</strong> 100.0% 20.7% 1.8% 5.5% 32.6% 12.6% 23.9% 2.9%<br />
<strong>2009</strong>–2012 100.0% 20.0% 1.8% 3.2% 34.7% 15.5% 21.7% 3.2%<br />
RLTS 10 year % target 26% 2% 4% 30% 16% 18% 4%<br />
36
Figure 8.1: LTP programme assessment for the three-year period 2006/07–2008/09 and the RLTP <strong>2009</strong>/10–2011/12<br />
35<br />
30<br />
30%<br />
RLTS 10-year % target<br />
2006-<strong>2009</strong> (LTPs)<br />
<strong>2009</strong>-2012 (RLTP)<br />
26%<br />
25<br />
% Planned three-year expenditure<br />
20<br />
15<br />
10<br />
16%<br />
18%<br />
5<br />
2%<br />
4%<br />
4%<br />
0<br />
Road Maintenance<br />
Traffic Management Safety Road Infrastructure PT Services PT Infrastructure TDM<br />
Note: It is important to consider that proportions of a programme are being presented, therefore direct comparisons on the trend cannot be made. For example the<br />
total 2006-09 funding requested was $4.1 billion whereas <strong>2009</strong>-12 funding requested is $5.3 billion. Public transport Infrastructure includes $396 million of expenditure<br />
on electric trains, ownership of these trains has yet to be finalised.<br />
The following general trends can be seen from the analysis:<br />
> The expenditure on road maintenance (and renewals) continues<br />
to increase year on year, this is likely to be due to an increase in<br />
the level of service that is by sought by road-controlling authorities<br />
and requested by the public. However, the proportion of funding<br />
applied for by road-controlling authorities in the RLTP is still less<br />
than the percentage set out in the 2005 RLTS and a slight<br />
decrease as a proportion of total spend than in the 2006–<strong>2009</strong><br />
period. This may indicate that the funding proposed in the RLTS<br />
for maintenance was over-estimated. This is supported by ARTA’s<br />
annual review of the region’s maintenance requirements and<br />
roading asset management plans.<br />
><br />
safety-specific projects. This suggests that there is a need to<br />
increase safety projects, especially if the impacts that the<br />
Government wishes to achieve in the GPS are to be met.<br />
There has been an increase in the funding being requested on<br />
road infrastructure (as a proportion and in absolute real terms) in<br />
this RLTP compared to previous LTPs. A general fall in local<br />
roading expenditure is being masked by Penlink, which is an<br />
expensive single project, and by a very large increase in State<br />
highway expenditure. This is likely to be due to territorial<br />
authorities wishing to keep rates increases to acceptable levels<br />
and the Government wishing to accelerate the construction of<br />
roads of national significance.<br />
><br />
><br />
The proportion of funding requested in the RLTP for traffic<br />
management is slightly less than the proportion of funding<br />
requested in the past LTPs and below the 2% target figure in the<br />
2005 RLTS. In absolute terms, funding is increasing by $5 million,<br />
which in a $4.9 billion programme is not significant. Good traffic<br />
management is essential to ensure that the existing road network<br />
can be used to its full potential. Under-funding in this area may<br />
lead to unnecessary congestion and a poorly performing network.<br />
A good example of traffic management is traffic signal<br />
optimisation, which has shown that there are significant benefits<br />
to be gained from a relatively minor investment in improving the<br />
co-ordination of traffic signals on arterial roads.<br />
In this RLTP there has been a significant drop in the proportion of<br />
funding requested (as a proportion and in real terms) for the<br />
implementation of safety projects. As many projects offer a<br />
variety of benefits, the majority of the funding for safety is from<br />
projects whose main purpose is not reducing safety risks.<br />
However, the RLTS target is derived from the need to carry out<br />
><br />
><br />
Public transport services funding in the RLTP is greater than<br />
previous LTPs, in absolute terms and as a percentage, however, it<br />
is still less than the proportion of transport funding required to be<br />
spent on public transport services in the 2005 RLTS. This suggests<br />
that funding on services needs to be increased further if the full<br />
decongestion benefits of public transport are to be realised.<br />
Expenditure on public transport infrastructure as a proportion has<br />
reduced, when compared to the previous LTPs, but is at a greater<br />
level than was indicated in the 2005 RLTS. A large proportion of<br />
this expenditure is being incurred by KiwiRail. The full extent of<br />
the cost of twin tracking the Western Line was not known at the<br />
time of the completion of the 2005 RLTS, consequently it is likely<br />
that the proportion of funding required for public transport<br />
infrastructure was under-estimated. In addition, $396 million<br />
have been included in the current RLTP for the purchase of electric<br />
trains, which the Government has committed to, although the<br />
funding of this is still being resolved.<br />
37
The proportion of funding proposed to be spent on TDM has<br />
increased over previous LTPs, however, remains below the RLTS<br />
percentage target. It appears that the funding requested on<br />
TDM has been increased by a large NZTA State highways<br />
programme on walking and cycling schemes, and this has<br />
masked to some degree a large cutback in funding requests from<br />
the local authorities.<br />
In general terms, the chart indicates that traffic management, safety,<br />
public transport services, and TDM are being spent at roughly the<br />
proportion indicated in the RLTS, although in all cases they are being<br />
slightly under-funded compared to the RLTS target. Road maintenance<br />
is being considerably under-funded in proportion to the total spend.<br />
The main reason for all these proportional underfunds is the large<br />
increase in funding for road infrastructure and in public transport<br />
Figure 8.2 shows how planned expenditure in the <strong>2009</strong>/10–2011/12<br />
RLTP, plus major transport-related expenditure outside the RLTP,<br />
compares with the RLTS targets. The planned expenditure is broken<br />
down by the main transport providers.<br />
infrastructure. The increase in road infrastructure expenditure is due<br />
to the increase in State highway funding, which dwarfs funding<br />
proposed on the local road network. The majority of the public<br />
transport infrastructure expenditure relates to rail funding and<br />
includes both rolling stock, and electrification upgrades to existing<br />
lines and new lines.<br />
Figure 8.2: Planned RLTP expenditure compared to RLTS targets<br />
40.0%<br />
RLTS Targets<br />
Government/KiwiRail<br />
NZTA<br />
35.0%<br />
Local Authority + ARTA<br />
30%<br />
30.0%<br />
26%<br />
34.7%<br />
21.7%<br />
% Total expenditure<br />
25.0%<br />
20.0%<br />
15.0%<br />
20.0%<br />
15.5%<br />
16%<br />
18%<br />
10.0%<br />
5.0%<br />
1.8%<br />
2%<br />
3.2%<br />
4%<br />
3.2% 4%<br />
0.0%<br />
Maintenance Traffic Management Safety Road Infrastructure<br />
PT Services PT Infrastructure TDM<br />
38
Figure 8.3: Comparison of actual expenditure versus planned expenditure for the 2007/08 <strong>Land</strong> <strong>Transport</strong> <strong>Programme</strong><br />
$250<br />
Planned expenditure (2007/08)<br />
Actual (Spend) (2007/08)<br />
$200<br />
$150<br />
$ Million<br />
$100<br />
$50<br />
$0<br />
Road Maintenance<br />
and Renewals<br />
Road Infrastructure PT Services PT Infrastructure TDM and Walking<br />
and Cycling<br />
GPS work category<br />
Figure 8.3 shows the difference between the final 2007/08 planned<br />
expenditure and the actual expenditure. The following conclusions<br />
can be drawn from the chart.<br />
Apart from Public <strong>Transport</strong> Services all work categories were underspent<br />
in comparison with planned expenditure:<br />
> The Road Maintenance and Renewals categories were underspent<br />
by 12%. It is usual for local roading authorities to request more<br />
funding than is eventually agreed to after negotiations with the<br />
NZTA and ARTA. The final agreed figure was spent in its entirety.<br />
> Road Infrastructure, Public <strong>Transport</strong> Infrastructure, TDM and<br />
Walking and Cycling schemes are all underspent. The main<br />
reason for this is that territorial authorities tend to put forward<br />
more schemes than they have local share funding to implement.<br />
They do this as it is likely that some schemes will be delayed and<br />
will not be progressed in the forth-coming year. These unforeseen<br />
delays are often attributed to consent-related requirements and<br />
a shortage in professional service skills for design and evaluation<br />
analysis. Due to the downturn in the economy and the reduction<br />
in spending by local authorities, it expected that there will not be<br />
the shortage of professional services during this RLTP period as<br />
there was in the past. Further, as councils have put forward fewer<br />
projects for funding, the projects which are proposed should<br />
have a greater opportunity of being completed than in previous<br />
years. For these reasons, it is anticipated that there will be a<br />
closer match between planned expenditure and actual spend in<br />
this RLTP period than in previous years.<br />
Further Monitoring<br />
The monitoring carried out in the section above considers the amount<br />
proposed to be spent on transport in the <strong>Auckland</strong> region against the<br />
proportion proposed for each mode to achieve the desire strategic<br />
outcomes as indicated in the RLTS. However, this does not indicate<br />
whether the funding is actually achieving the outcomes and impacts<br />
set in the GPS and RLTS. ARTA is developing a series of key<br />
performance indicators (KPIs), which will measure changes in<br />
transport as a result of the investment considered above. Further<br />
information on how these KPIs will be monitored and interpreted<br />
once developed can be found in the <strong>Auckland</strong> <strong>Transport</strong> Plan and it<br />
is intended that results of ARTA’s monitoring of transport performance<br />
indicators will be published annually.<br />
39
9 SIGNIFICANCE POLICY<br />
Legislation<br />
Section 106 of the <strong>Land</strong> <strong>Transport</strong> Management Act 2003 (LTMA)<br />
states that ARTA must adopt a policy that determines significance in<br />
respect of variations made to the <strong>Auckland</strong> regional land transport<br />
programme (RLTP).<br />
ARTA will consult on the RLTP on a three-yearly basis, commencing in<br />
early <strong>2009</strong> with the draft <strong>2009</strong>/10–2011/12 <strong>Auckland</strong> RLTP. After the<br />
RLTP has been formally adopted, any variations will be assessed to<br />
determine if they are a significant variation to the RLTP or not.<br />
All variations will be of some significance, ranging from insignificance<br />
to high significance, and may require consultation. Variations of a<br />
lesser significance will require a less rigorous decision-making process<br />
and a lesser level of consultation. There will be a threshold above<br />
which a variation is deemed to be significant and, as a result, requires<br />
the special consultative procedure in the Local Government Act 2002<br />
(LGA 2002).<br />
Any variation that is deemed to be not significant may still be<br />
consulted on at the discretion of ARTA, using the consultation<br />
principles contained in the LGA 2002.<br />
Policy<br />
When considering the significance of a variation, ARTA shall give<br />
consideration to the following criteria:<br />
> The extent to which ARTA has responsibility for the relevant<br />
activity or project which is subject to the variation.<br />
> Any relevant consultation under the LTMA or the LGA, variation<br />
which has already been consulted on under the LTMA or the LGA<br />
may not be considered significant.<br />
> The extent to which there is, or is likely to be, a change in the<br />
capacity of ARTA to deliver its statutory objective, including giving<br />
effect to the RLTS (subject to specified legislative exceptions).<br />
> Alignment with ARTA’s plans and programme and the Government<br />
Policy Statement.<br />
> The costs and benefits of the consultation process.<br />
Procedures<br />
> Where possible, and if it is not contrary to the consultation principles<br />
of LGA, consultation will be carried out on an annual basis.<br />
Thresholds<br />
In deciding whether or not a proposed variation is significant or not,<br />
ARTA will assess, as a guideline, whether or not the proposed<br />
variation meets the following thresholds:<br />
> The inclusion of a construction phase for a new State highway<br />
project with a total activity or project cost greater than 10% of<br />
the activity class ‘New and Improved Infrastructure for State<br />
Highways’ in the <strong>Auckland</strong> RLTP.<br />
> Changes to the scope of an activity or project that increase<br />
expenditure in the relevant activity class in the <strong>Auckland</strong> RLTP by<br />
more than 10% (but at least $10 million)<br />
><br />
><br />
><br />
><br />
Final decisions on significance shall be made by ARTA.<br />
ARTA will consider requests for variations promptly at its regular<br />
meetings and communicate its decision in writing to the applicant<br />
and the NZTA.<br />
If there is benefit in consulting on a variation that is not significant<br />
then ARTA may still consult and will determine the appropriate<br />
level of consultation.<br />
ARTA will consider asking an applicant of a significant variation<br />
to contribute to the cost of the special consultative procedure.<br />
><br />
Changes to this Significance Policy.<br />
The following variations are examples of proposed variations which<br />
do not meet the threshold and therefore may be considered not<br />
significant:<br />
><br />
><br />
><br />
Deletion of an activity or project which is undertaken by, or the<br />
responsibility of, an Approved Organisation other than ARTA.<br />
Replacement of an activity or project within a group of related<br />
activities or projects by another activity or project of the same or<br />
substantially similar type.<br />
Cost changes that do not affect the scope of an activity or<br />
project.<br />
40
10 DETAILED <strong>2009</strong>/12 FUNDING REQUESTS<br />
The following tables show the funding requests submitted to ARTA<br />
for inclusion in the final <strong>2009</strong>/10–2011/12 <strong>Auckland</strong> <strong>Regional</strong> <strong>Land</strong><br />
<strong>Transport</strong> <strong>Programme</strong>. These items are subsidised by the NZTA and<br />
reflect a portion of the total land transport programme for the region.<br />
The remainder of the programme is funded from other sources and<br />
is discussed in sections 2 and 6. The following activities were provided<br />
by ARTA; NZTA Highways, Network and Operations (for State<br />
highways) and the <strong>Auckland</strong> local authorities to be profiled and<br />
prioritised for inclusion in the RLTP. It should be noted that the<br />
programme has been created before councils have finalised their<br />
Long Term Council Community Plans. The coding in this programme<br />
reflects the information given to ARTA.<br />
There are some activities or projects which have benefits which are<br />
difficult to compare with the majority of transport projects but are a<br />
necessary part of the transport system, for example the value of<br />
advertising in community programmes or of maintenance regimes<br />
may depend on the culture of the audience or age of the existing<br />
asset. Other activities are necessary to provide a minimum acceptable<br />
level of mobility in the region, such as public transport services. These<br />
activities or projects have been ranked by necessity before profiled<br />
activities in the following order:<br />
> Passenger <strong>Transport</strong> Services.<br />
The table below is a quick page reference to specific activity classes<br />
and the associated activities.<br />
Activities:<br />
Activities Table Page<br />
<strong>Transport</strong> Planning 10.1 43<br />
Demand Management and<br />
10.2 49<br />
Community <strong>Programme</strong>s<br />
Walking and Cycling Facilities 10.3 51<br />
Public <strong>Transport</strong> Services 10.4 55<br />
Public <strong>Transport</strong> Infrastructure 10.5 56<br />
Maintenance Operations and Renewal 10.6 60<br />
<strong>Programme</strong>s for Local Roads<br />
Maintenance Operations and Renewal 10.7 61<br />
<strong>Programme</strong>s for State Highways<br />
New Local Road Infrastructure 10.8 63<br />
New State Highway Infrastructure 10.9 73<br />
><br />
><br />
><br />
Committed Projects.<br />
State Highway Maintenance, Operations and Renewals.<br />
Local Road Maintenance, Operations and Renewals.<br />
Where the efficiency (benefit/cost ratio) of a project has not been<br />
progressed or included in the application a default symbol of – has<br />
been included in the table. When further knowledge becomes<br />
available it is likely that the profile and therefore regional priority of<br />
the project will change.<br />
41
With respect to the tables (and headings) on the following pages, we<br />
have used the following nomenclature:<br />
Approved Organisations<br />
<strong>Auckland</strong> <strong>Regional</strong> <strong>Transport</strong> Authority – ARTA<br />
<strong>Auckland</strong> <strong>Regional</strong> Council – ARC<br />
NZTA Network and Highways Operations – HNO<br />
<strong>Auckland</strong> City Council – ACC<br />
Franklin District Council – FDC<br />
Manukau City Council – MCC<br />
North Shore City Council – NSCC<br />
Papakura District Council – PDC<br />
Rodney District Council – RDC<br />
Waitakere City Council – WCC<br />
Phase: refers to the stage of development (study, investigation,<br />
design, construction/implementation, etc).<br />
Work category: refers to the NZTA work category designation<br />
(refer to page F1-3 in the NZTA’s Planning, Programming and<br />
Funding Manual).<br />
Objectives: the main contribution this project will have towards the<br />
objectives of the New Zealand <strong>Transport</strong> Strategy, these being to:<br />
><br />
><br />
><br />
><br />
><br />
Assist economic development.<br />
Assist safety and personal security.<br />
Improve access and mobility.<br />
Protect and promote public health.<br />
Ensure environmental sustainability.<br />
Total cost ($): This is the amount of money the activity has been<br />
estimated to cost based on the accumulated cost information in<br />
LTP online.<br />
<strong>2009</strong>/10, <strong>2010</strong>/11, 2011/12 cost ($): This is the amount of money<br />
being requested for the identified activity and phase for that particular<br />
year in the RLTP. In the instances where the cell is blank or contains a<br />
dash, no amount of money was indicated.<br />
Seriousness and Urgency, Effectiveness and Efficiency: The<br />
prioritisation profile assigned to the activity based on ARTA’s<br />
prioritisation process (refer to Appendix 2). In some instances, the cell<br />
may contain a dash “–“ or NA.<br />
If a cell contains a dash “–“ (under efficiency) then the efficiency of<br />
the activity has not been determined, that is the project is at too early<br />
a stage for the BCR to have yet been calculated. In these cases<br />
schemes are profiled as if the BCR was Low until it is proved otherwise.<br />
This is used to differentiate between an activity that has a calculated<br />
Low efficiency (the benefit/cost ratio (BCR) is greater or equal to 1<br />
but less than 2), in which case L is used to indicate Low efficiency.<br />
Where NA is entered in a cell, then that particular activity does not<br />
require an assessment of the efficiency, generally (this is Studies and<br />
strategies, the Community <strong>Programme</strong>s and Administration).<br />
When further information about a project becomes known, for<br />
example when the BCR has been calculated or when the effectiveness<br />
of the proposed solution is reassessed because further information<br />
becomes available, it is likely that the prioritisation profile of the<br />
project will change.<br />
42
Table 10.1: Activity Class 1, <strong>Transport</strong> Planning<br />
Approved<br />
Organisation<br />
Project name Phase Work<br />
category<br />
Objectives<br />
Total cost<br />
($)<br />
<strong>2009</strong>/10 cost<br />
($)<br />
<strong>2010</strong>/11 cost<br />
($)<br />
2011/12 cost<br />
($)<br />
Seriousness<br />
& Urgency<br />
Effectiveness<br />
Efficiency<br />
ACC CBD PT Integration Study<br />
(Committed)<br />
Road studies Integration 485,000 285,000 – –<br />
ACC<br />
Ellerslie Panmure Highway<br />
Corridor Study<br />
Study<br />
(Committed)<br />
Road studies<br />
Access and<br />
mobility<br />
200,000 197,525 – –<br />
ACC<br />
Great North Road<br />
Corridor Study<br />
Study<br />
(Committed)<br />
Road studies<br />
Access and<br />
mobility<br />
150,000 65,504 – –<br />
ACC Onehunga Town Centre Study Study<br />
(Committed)<br />
Road studies<br />
Access and<br />
mobility<br />
100,000 39,000 – –<br />
ACC Selwyn Street Corridor Study Study<br />
(Committed)<br />
Road studies<br />
Access and<br />
mobility<br />
200,000 49,000 – –<br />
NSCC NSCC Freight Study 08-09 Study<br />
(Committed)<br />
Road studies<br />
Economic<br />
development<br />
100,000 70,000 – –<br />
NSCC New: Strategy Studies 2004/05 Study<br />
(Committed)<br />
System use<br />
studies<br />
Access and<br />
mobility<br />
47,488 47,488 – –<br />
NSCC Strategic Corridor Study 08-09 Study<br />
(Committed)<br />
System use<br />
studies<br />
Access and<br />
mobility<br />
265,000 145,000 – –<br />
RDC HBC Traffic Corridor Study Study<br />
(Committed)<br />
Road studies<br />
Access and<br />
mobility<br />
550,000 248,879 – –<br />
WCC<br />
Waitakere Central City<br />
Traffic Modelling<br />
Investigation<br />
(Committed)<br />
Road studies Integration 275,000 70,000 – –<br />
PDC Papakura <strong>Transport</strong> Strategy Study Studies and<br />
strategies<br />
ACC AMETI – PPP (ACC/MCC) Study Studies and<br />
strategies<br />
Integration 385,000 290,000 95,000 – H H NA<br />
Integration 100,000 – – 100,000 H H NA<br />
ACC<br />
AMETI – Bridge widening<br />
study (ACC/MCC)<br />
Study<br />
Studies and<br />
strategies<br />
Integration 300,000 200,000 100,000 – H H NA<br />
ACC<br />
<strong>2009</strong>-12 POA Rail<br />
Freight Study<br />
Study<br />
Studies and<br />
strategies<br />
Economic<br />
development<br />
65,000 65,000 – – H H NA<br />
ARTA RPTP – PT Strategy and Policy Study Studies and<br />
strategies<br />
Access and<br />
mobility<br />
1,370,255 504,277 452,989 412,989 H H NA<br />
MCC<br />
Study – Park and Ride Bus/<br />
Rail Interchange<br />
Implementation Plan<br />
Study<br />
Studies and<br />
strategies<br />
Integration 50,000 – 50,000 – H H NA<br />
MCC<br />
Study – Passenger <strong>Transport</strong><br />
Accessibility Study<br />
Study<br />
Studies and<br />
strategies<br />
Integration 50,000 – – 50,000 H H NA<br />
43
44<br />
Table 10.1: Activity Class 1, <strong>Transport</strong> Planning (Continued)<br />
Approved<br />
Organisation<br />
Project name Phase Work<br />
category<br />
Objectives<br />
Total cost<br />
($)<br />
<strong>2009</strong>/10 cost<br />
($)<br />
<strong>2010</strong>/11 cost<br />
($)<br />
2011/12 cost<br />
($)<br />
Seriousness<br />
& Urgency<br />
Effectiveness<br />
Efficiency<br />
ARTA<br />
<strong>Regional</strong> Arterial Road<br />
Plan review<br />
Study<br />
Studies and<br />
strategies<br />
Integration 638,523 227,841 182,841 227,841 H H NA<br />
MCC Mill Rd/Redoubt Rd Stage 2 –<br />
Investigation and Reporting<br />
Study<br />
Studies and<br />
strategies<br />
Economic<br />
development<br />
2,557,000 850,000 623,000 533,000 H H NA<br />
ARTA<br />
<strong>Auckland</strong> <strong>Transport</strong><br />
Plan review<br />
Study<br />
Studies and<br />
strategies<br />
Integration 1,312,313 423,281 444,516 444,516 H H NA<br />
NSCC<br />
<strong>2009</strong>/12 Bracken/Burns/<br />
Auburn/Killarney<br />
Study<br />
Studies and<br />
strategies<br />
Responsiveness 120,000 – – 120,000 H H NA<br />
ARTA Corridor and Sector Studies Study Studies and<br />
strategies<br />
ARTA <strong>Land</strong> Use <strong>Transport</strong> Planning Study Studies and<br />
strategies<br />
ARTA Other Strategies and Plans Study Studies and<br />
strategies<br />
Integration 2,990,178 982,752 966,213 1,041,213 H H NA<br />
Integration 1,002,895 411,531 295,682 295,682 H H NA<br />
Integration 264,843 94,797 85,023 85,023 H H NA<br />
ARTA<br />
Sustainable <strong>Transport</strong><br />
Plan review<br />
Study<br />
Studies and<br />
strategies<br />
Access and<br />
mobility<br />
717,036 239,012 239,012 239,012 H H NA<br />
PDC Great South Rd Corridor Study Study Studies and<br />
strategies<br />
Integration 250,000 – 250,000 – H H NA<br />
ARC<br />
Corridor Development<br />
Guidelines Investigation<br />
Study<br />
Studies and<br />
strategies<br />
Integration 90,000 90,000 – – H H NA<br />
PDC Hingaia Rd Corridor Strategy Study Studies and<br />
strategies<br />
Integration 30,000 30,000 – – H H NA<br />
WCC<br />
Local Area Freight<br />
Management Plan<br />
Study<br />
Studies and<br />
strategies<br />
Economic<br />
development<br />
30,870 – 30,870 – H H NA<br />
MCC<br />
Study – Bus Priority – Whole<br />
Route Implementation Plans<br />
Study<br />
Studies and<br />
strategies<br />
Integration 240,000 80,000 80,000 80,000 H H NA<br />
MCC<br />
Study – Town Centre<br />
Parking Strategy<br />
Study<br />
Studies and<br />
strategies<br />
Economic<br />
development<br />
140,000 140,000 – – H H NA<br />
ACC<br />
<strong>2009</strong>-12 CBD Fringe Parking<br />
Management Study<br />
Study<br />
Studies and<br />
strategies<br />
Responsiveness 50,000 50,000 – – H H NA<br />
FDC<br />
Franklin District<br />
<strong>Transport</strong> Strategy<br />
Study<br />
Studies and<br />
strategies<br />
Integration 100,000 100,000 – – H H NA<br />
ARC Inter-regional Freight Study Studies and<br />
strategies<br />
Sustainability 76,875 – 76,875 – H H NA
Table 10.1: Activity Class 1, <strong>Transport</strong> Planning (Continued)<br />
Approved<br />
Organisation<br />
Project name Phase Work<br />
category<br />
Objectives<br />
Total cost<br />
($)<br />
<strong>2009</strong>/10 cost<br />
($)<br />
<strong>2010</strong>/11 cost<br />
($)<br />
2011/12 cost<br />
($)<br />
Seriousness<br />
& Urgency<br />
Effectiveness<br />
Efficiency<br />
ARC<br />
Local Area Freight<br />
Management Plan Guidelines<br />
Study<br />
Studies and<br />
strategies<br />
Economic<br />
development<br />
50,000 50,000 – – H H NA<br />
ARC Research into Parking Levies Study Studies and<br />
strategies<br />
Economic<br />
development<br />
60,000 60,000 – – H H NA<br />
ARC<br />
Review of <strong>Auckland</strong> <strong>Regional</strong><br />
<strong>Transport</strong> Trends<br />
Study<br />
Studies and<br />
strategies<br />
Responsiveness 60,000 60,000 – – H H NA<br />
ARC <strong>Transport</strong> Modelling Study Studies and<br />
strategies<br />
Access and<br />
mobility<br />
4,481,351 400,000 410,000 420,250 H H NA<br />
ACC<br />
<strong>2009</strong>-12 CBD Parking<br />
Management Study<br />
Study<br />
Studies and<br />
strategies<br />
Responsiveness 100,000 100,000 – – H H NA<br />
WCC<br />
Waitakere City <strong>Transport</strong><br />
Strategy Update<br />
Study<br />
Studies and<br />
strategies<br />
Sustainability 70,290 60,000 10,290 – H H NA<br />
ACC <strong>2009</strong>-12 <strong>Transport</strong> Model Study Studies and<br />
strategies<br />
Integration 200,000 100,000 100,000 – H H NA<br />
WCC<br />
Town Centre Parking<br />
Management Plan<br />
Study<br />
Studies and<br />
strategies<br />
Economic<br />
development<br />
41,177 20,000 – 21,177 H H NA<br />
MCC<br />
Study – Cycle and Walking<br />
Strategy Interim Review<br />
Study<br />
Studies and<br />
strategies<br />
Access and<br />
mobility<br />
50,000 50,000 – – H H NA<br />
HNO<br />
Mt Wellington to CMJ<br />
Dynamic Traffic<br />
Management Study<br />
Study Road studies Safety and<br />
security<br />
313,635 154,500 159,135 – H H NA<br />
HNO Ports Access Study Study Road studies Safety and<br />
security<br />
135,000 35,000 50,000 50,000 H H NA<br />
HNO<br />
State Highway/<strong>Land</strong> Use<br />
Integration Studies<br />
Study Road studies Integration 636,725 206,000 212,180 218,545 H H NA<br />
HNO<br />
State Highway<br />
Optimisation Strategies<br />
Study Road studies Economic<br />
development<br />
1,170,450 309,000 424,360 437,090 H H NA<br />
PDC<br />
Papakura East West<br />
Corridor Studies<br />
Study<br />
Studies and<br />
strategies<br />
Access and<br />
mobility<br />
300,000 – – 300,000 H H NA<br />
ACC<br />
<strong>2009</strong>-12 Bus Priority<br />
Framework<br />
Study<br />
Studies and<br />
strategies<br />
Access and<br />
mobility<br />
100,000 100,000 – – H H NA<br />
NSCC<br />
<strong>2009</strong>/12 NSCC Asset<br />
Management Plan<br />
Study<br />
Activity<br />
management<br />
plans<br />
Sustainability 720,000 232,000 240,000 248,000 H H NA<br />
45
46<br />
Table 10.1: Activity Class 1, <strong>Transport</strong> Planning (Continued)<br />
Approved<br />
Organisation<br />
Project name Phase Work<br />
category<br />
Objectives<br />
Total cost<br />
($)<br />
<strong>2009</strong>/10 cost<br />
($)<br />
<strong>2010</strong>/11 cost<br />
($)<br />
2011/12 cost<br />
($)<br />
Seriousness<br />
& Urgency<br />
Effectiveness<br />
Efficiency<br />
MCC<br />
Activity Management Plans<br />
<strong>2009</strong>/12<br />
Study<br />
Activity<br />
management<br />
plans<br />
Sustainability 2,550,000 850,000 850,000 850,000 H H NA<br />
PDC Activity Management Plan Study Activity<br />
management<br />
plans<br />
Responsiveness 750,000 195,000 260,000 295,000 H H NA<br />
RDC<br />
Activity Management Plan<br />
– Ongoing<br />
Study<br />
Activity<br />
management<br />
plans<br />
Integration 450,000 150,000 150,000 150,000 H H NA<br />
RDC<br />
Asset Condition Analysis and<br />
Renewals Planning<br />
Study<br />
Activity<br />
management<br />
plans<br />
Integration 270,000 90,000 90,000 90,000 H H NA<br />
RDC<br />
Asset Inventory – Retaining<br />
Walls and Culverts<br />
Study<br />
Activity<br />
management<br />
plans<br />
Integration 60,000 60,000 – – H H NA<br />
RDC Asset Valuation Study Activity<br />
management<br />
plans<br />
Integration 50,000 50,000 – – H H NA<br />
ACC<br />
Activity Management Plans<br />
<strong>2009</strong>/12<br />
Study<br />
Activity<br />
management<br />
plans<br />
Sustainability 2,190,000 730,000 730,000 730,000 H H NA<br />
ARC<br />
Improving <strong>Transport</strong><br />
Sustainability of Business Areas<br />
Study<br />
Studies and<br />
strategies<br />
Sustainability 60,000 60,000 – – H H NA<br />
ARC<br />
Improving <strong>Transport</strong><br />
Sustainability of<br />
Existing Suburbs<br />
Study<br />
Studies and<br />
strategies<br />
Sustainability 60,000 60,000 – – H H NA<br />
ARTA<br />
ARTA Activity<br />
Management Plan<br />
Study<br />
Activity<br />
management<br />
plans<br />
Sustainability 472,263 157,421 157,421 157,421 H H NA<br />
WCC<br />
Activity Management<br />
Planning<br />
Study<br />
Activity<br />
management<br />
plans<br />
Responsiveness 321,131 104,000 107,016 110,115 H H NA<br />
FDC<br />
Asset Management Plan<br />
Review/Update<br />
Study<br />
Activity<br />
management<br />
plans<br />
Responsiveness 1,102,400 105,000 106,100 107,250 H H NA<br />
FDC Crash Reduction Studies Study Studies and<br />
strategies<br />
Safety and<br />
security<br />
200,000 20,000 20,000 20,000 H H NA
Table 10.1: Activity Class 1, <strong>Transport</strong> Planning (Continued)<br />
Approved<br />
Organisation<br />
Project name Phase Work<br />
category<br />
Objectives<br />
Total cost<br />
($)<br />
<strong>2009</strong>/10 cost<br />
($)<br />
<strong>2010</strong>/11 cost<br />
($)<br />
2011/12 cost<br />
($)<br />
Seriousness<br />
& Urgency<br />
Effectiveness<br />
Efficiency<br />
ACC<br />
<strong>2009</strong>-12 Crash Reduction<br />
Studies<br />
Study<br />
Studies and<br />
strategies<br />
Safety and<br />
security<br />
1,005,000 335,000 335,000 335,000 H H NA<br />
HNO<br />
<strong>Auckland</strong> KiwiRAP Black<br />
Route study<br />
Study Road studies Safety and<br />
security<br />
100,000 34,000 33,000 33,000 H H NA<br />
HNO<br />
Demand Management<br />
Strategies<br />
Study Road studies Sustainability 750,000 250,000 250,000 250,000 H H NA<br />
HNO Freight Priority Strategy Study Road studies Safety and<br />
security<br />
200,000 100,000 50,000 50,000 H H NA<br />
MCC<br />
Manukau Road Safety Plan<br />
2012-15<br />
Study<br />
Studies and<br />
strategies<br />
Safety and<br />
security<br />
40,000 – – 40,000 H H NA<br />
WCC<br />
AIS (Crash Reduction Study)<br />
2011/12<br />
Study<br />
Studies and<br />
strategies<br />
Safety and<br />
security<br />
169,408 – – 169,408 H H NA<br />
NSCC<br />
<strong>2009</strong>/12 Safety Improvement<br />
Studies<br />
Study<br />
Studies and<br />
strategies<br />
Safety and<br />
security<br />
100,000 50,000 50,000 – H H NA<br />
HNO<br />
Freight Transhipment<br />
Access Study<br />
Study Road studies Safety and<br />
security<br />
106,090 – – 106,090 H H NA<br />
RDC<br />
Crash Reduction Study<br />
<strong>2009</strong>-2012<br />
Study<br />
Studies and<br />
strategies<br />
Safety and<br />
security<br />
150,000 50,000 50,000 50,000 H H NA<br />
HNO<br />
Passing and Overtaking<br />
Strategic Study<br />
Study<br />
Studies and<br />
strategies<br />
Sustainability 50,000 – 50,000 – H H NA<br />
ARC<br />
Benchmarking <strong>Auckland</strong><br />
<strong>Transport</strong><br />
Study<br />
Studies and<br />
strategies<br />
Sustainability 50,000 50,000 – – H H NA<br />
PDC<br />
Manuroa Rd and Airfield Rd<br />
Corridor Study<br />
Study<br />
Studies and<br />
strategies<br />
Integration 250,000 250,000 – – H H NA<br />
WCC Waitakere City Walking Study Study Studies and<br />
strategies<br />
Sustainability 55,290 45,000 10,290 – H H NA<br />
HNO<br />
SH Pedestrian<br />
Connectivity Study<br />
Study Road studies Safety and<br />
security<br />
200,000 200,000 – – H H NA<br />
WCC<br />
Waitakere City Cycleways<br />
Feasibility Study<br />
Study<br />
Studies and<br />
strategies<br />
Access and<br />
mobility<br />
51,450 – 51,450 – H H NA<br />
PDC<br />
Porchester Rd Corridor<br />
Management Plan<br />
Study<br />
Studies and<br />
strategies<br />
Responsiveness 100,000 100,000 – – H H NA<br />
HNO<br />
Wellsford Town Centre<br />
<strong>Transport</strong>ation Study<br />
Study Road studies Safety and<br />
security<br />
300,000 300,000 – – H H NA<br />
47
48<br />
Table 10.1: Activity Class 1, <strong>Transport</strong> Planning (Continued)<br />
Approved<br />
Organisation<br />
Project name Phase Work<br />
category<br />
Objectives<br />
Total cost<br />
($)<br />
<strong>2009</strong>/10 cost<br />
($)<br />
<strong>2010</strong>/11 cost<br />
($)<br />
2011/12 cost<br />
($)<br />
Seriousness<br />
& Urgency<br />
Effectiveness<br />
Efficiency<br />
HNO<br />
Helensville Town Centre<br />
<strong>Transport</strong>ation Study<br />
Study Road studies Safety and<br />
security<br />
350,000 – – 350,000 H H NA<br />
HNO<br />
Kumeu Huapai<br />
<strong>Transport</strong>ation Study<br />
Study<br />
Studies and<br />
strategies<br />
Safety and<br />
security<br />
150,000 150,000 – – H H NA<br />
HNO<br />
Manukau to Pokeno<br />
Strategic Study<br />
Study<br />
Studies and<br />
strategies<br />
Safety and<br />
security<br />
150,000 150,000 – – H H NA<br />
ACC<br />
<strong>2009</strong>-12 Strategic<br />
transport studies<br />
Study<br />
Studies and<br />
strategies<br />
Integration 900,000 300,000 300,000 300,000 H H NA<br />
RDC<br />
Strategy Study – Major Rural<br />
Arterial Routes<br />
Study<br />
Studies and<br />
strategies<br />
Safety and<br />
security<br />
50,000 50,000 – – H H NA<br />
NSCC<br />
<strong>2009</strong>/12 Wharf management<br />
resolution Study<br />
Study<br />
Studies and<br />
strategies<br />
Responsiveness 100,000 100,000 – – H M NA<br />
MCC<br />
Study – Papatoetoe<br />
Rail Crossing<br />
Study<br />
Studies and<br />
strategies<br />
Integration 60,000 60,000 – – M H NA<br />
NSCC<br />
<strong>2009</strong>/12 Strategic<br />
<strong>Transport</strong> Studies<br />
Study<br />
Studies and<br />
strategies<br />
Integration 1,200,000 400,000 400,000 400,000 M H NA<br />
WCC Waitakere Rural <strong>Transport</strong> Plan Study Studies and<br />
strategies<br />
Economic<br />
development<br />
42,354 – – 42,354 M H NA<br />
MCC<br />
Study – Sustainable Travel<br />
Social Marketing<br />
Study<br />
Studies and<br />
strategies<br />
Integration 80,000 – 80,000 – M M NA<br />
ACC<br />
<strong>2009</strong>-12 On-street<br />
Parking Pricing and<br />
Management Study<br />
Study<br />
Studies and<br />
strategies<br />
Responsiveness 200,000 100,000 50,000 50,000 M M NA<br />
ACC<br />
<strong>2009</strong>-12 State Highway<br />
Related Studies<br />
Study<br />
Studies and<br />
strategies<br />
Integration 450,000 150,000 150,000 150,000 M M NA<br />
ARC<br />
<strong>Regional</strong> Authority<br />
Administration <strong>2009</strong>/12<br />
Administration<br />
<strong>Regional</strong><br />
land<br />
transport<br />
planning<br />
management<br />
7,213,125 2,530,000 2,388,125 2,295,000<br />
ARTA<br />
<strong>Regional</strong> Authority<br />
Administration <strong>2009</strong>/12<br />
Administration<br />
<strong>Regional</strong><br />
land<br />
transport<br />
planning<br />
management<br />
2,788,565 896,855 896,855 994,855<br />
49,738,980 17,214,663 13,193,243 13,449,831
Table 10.2: Activity Class 2, Demand Management and Community <strong>Programme</strong>s<br />
Approved<br />
Organisation<br />
Project name Phase Work<br />
category<br />
Objectives<br />
Total cost<br />
($)<br />
<strong>2009</strong>/10 cost<br />
($)<br />
2011/12 cost<br />
($)<br />
2011/12 cost<br />
($)<br />
Seriousness<br />
& Urgency<br />
Effectiveness<br />
Efficiency<br />
PDC<br />
Papakura Work Place<br />
Travel Plan<br />
Group<br />
allocation<br />
Community<br />
programmes<br />
Sustainability 56,360 8,000 23,360 25,000 H H H<br />
ARTA<br />
Workplace Travel Plans<br />
<strong>2009</strong>-2012 – ARTA<br />
Group<br />
allocation<br />
Community<br />
programmes<br />
Sustainability 3,084,617 975,982 1,052,033 1,056,601 H H H<br />
ACC<br />
<strong>2009</strong>-12 Workplace Travel<br />
Planning – <strong>Auckland</strong> City<br />
Group<br />
allocation<br />
Community<br />
programmes<br />
Sustainability 495,000 165,000 165,000 165,000 H H H<br />
MCC<br />
Manukau City Workplace<br />
Travel Planning Project<br />
<strong>2009</strong>/2012<br />
Group<br />
allocation<br />
Community<br />
programmes<br />
Sustainability 1,130,000 320,000 380,000 430,000 H H H<br />
RDC Work Place Travel Plan CFA –<br />
Rodney <strong>2009</strong>/12<br />
Group<br />
allocation<br />
Community<br />
programmes<br />
Access and<br />
mobility<br />
134,093 43,200 44,712 46,181 H H H<br />
WCC<br />
<strong>2009</strong>/12 WCC STARS<br />
Workplace Travel Plan<br />
<strong>Programme</strong><br />
Group<br />
allocation<br />
Community<br />
programmes<br />
Sustainability 211,612 68,512 70,500 72,600 H H H<br />
NSCC<br />
<strong>2009</strong>/12 Workplace Travel<br />
Plans – North Shore City<br />
Group<br />
allocation<br />
Community<br />
programmes<br />
Sustainability 2,040,000 680,000 680,000 680,000 H H H<br />
RDC School Travel Plans CFA –<br />
Rodney <strong>2009</strong>/12<br />
Group<br />
allocation<br />
Community<br />
programmes<br />
Access and<br />
mobility<br />
376,204 121,200 125,442 129,563 H H M<br />
FDC School Travel Plan <strong>2009</strong>-2012 Group<br />
allocation<br />
Community<br />
programmes<br />
Sustainability 114,629 10,000 10,300 10,609 H H M<br />
PDC<br />
Papakura District School<br />
Travel Plan<br />
Group<br />
allocation<br />
Community<br />
programmes<br />
Sustainability 97,860 30,000 33,360 34,500 H H M<br />
MCC<br />
Manukau City School Travel<br />
Planning Project <strong>2009</strong>-2012<br />
Group<br />
allocation<br />
Community<br />
programmes<br />
Sustainability 841,500 187,500 299,500 354,500 H H M<br />
WCC<br />
<strong>2009</strong>/12 WCC STARS School<br />
Travel Plan <strong>Programme</strong><br />
Group<br />
allocation<br />
Community<br />
programmes<br />
Sustainability 269,280 87,120 89,760 92,400 H H M<br />
ACC<br />
<strong>2009</strong>-12 School Travel<br />
Planning – <strong>Auckland</strong> City<br />
Group<br />
allocation<br />
Community<br />
programmes<br />
Sustainability 1,122,477 374,159 374,159 374,159 H H M<br />
NSCC<br />
<strong>2009</strong>/12 School Travel<br />
Planning – North Shore City<br />
Group<br />
allocation<br />
Community<br />
programmes<br />
Sustainability 1,995,000 665,000 665,000 665,000 H H M<br />
ARTA<br />
School Travel Plans<br />
<strong>2009</strong>-2012 – ARTA<br />
Group<br />
allocation<br />
Community<br />
programmes<br />
Sustainability 10,664,094 3,127,570 3,581,687 3,954,837 H H M<br />
ARTA<br />
Walking and Cycling<br />
<strong>Programme</strong><br />
Group<br />
allocation<br />
Community<br />
programmes<br />
Access and<br />
mobility<br />
1,176,854 380,600 395,568 400,686 M H NA<br />
49
50<br />
Table 10.2: Activity Class 2, Demand Management and Community <strong>Programme</strong>s (Continued)<br />
Approved<br />
Organisation<br />
Project name Phase Work<br />
category<br />
Objectives<br />
Total cost<br />
($)<br />
<strong>2009</strong>/10 cost<br />
($)<br />
2011/12 cost<br />
($)<br />
2011/12 cost<br />
($)<br />
Seriousness<br />
& Urgency<br />
Effectiveness<br />
Efficiency<br />
MCC<br />
Community Road Safety<br />
<strong>Programme</strong> <strong>2009</strong>/12<br />
Group<br />
allocation<br />
Community<br />
programmes<br />
Safety and<br />
security<br />
3,174,245 1,044,195 1,059,858 1,070,190 M H NA<br />
PDC<br />
Papakura Three-year<br />
Community Safety<br />
<strong>Programme</strong><br />
Group<br />
allocation<br />
Community<br />
programmes<br />
Safety and<br />
security<br />
864,075 289,500 266,975 307,600 M H NA<br />
ARTA<br />
AMETI Travel Behaviour<br />
Change <strong>Programme</strong><br />
Group<br />
allocation<br />
Community<br />
programmes<br />
Sustainability 555,135 185,045 185,045 185,045 M H NA<br />
ARTA<br />
Road Safety and Community<br />
Funding Coordination 09/12<br />
Group<br />
allocation<br />
Community<br />
programmes<br />
Safety and<br />
security<br />
1,771,784 416,132 589,771 604,389 M H NA<br />
ARTA<br />
Road Safety and Community<br />
Funding Coordination 09/12<br />
NAPs<br />
Community<br />
programmes<br />
Safety and<br />
security<br />
161,492 161,492 – – M H NA<br />
MCC<br />
MCC Accessibility and<br />
Active Travel<br />
Group<br />
allocation<br />
Community<br />
programmes<br />
Integration 1,646,141 218,191 367,775 457,437 M H NA<br />
ACC<br />
<strong>2009</strong>-12 Community<br />
<strong>Programme</strong> – <strong>Auckland</strong> City<br />
Group<br />
allocation<br />
Community<br />
programmes<br />
Safety and<br />
security<br />
2,749,869 916,623 916,623 916,623 M H NA<br />
FDC<br />
Franklin District Community<br />
<strong>Programme</strong> <strong>2009</strong>-12<br />
Group<br />
allocation<br />
Community<br />
programmes<br />
Safety and<br />
security<br />
596,228 188,316 193,965 213,947 M H NA<br />
NSCC<br />
<strong>2009</strong>/12 Community<br />
<strong>Programme</strong> – North Shore City<br />
Group<br />
allocation<br />
Community<br />
programmes<br />
Safety and<br />
security<br />
4,190,000 1,350,000 1,400,000 1,440,000 M H NA<br />
RDC Road Safety CFA –<br />
Rodney District<br />
Group<br />
allocation<br />
Community<br />
programmes<br />
Safety and<br />
security<br />
2,013,254 648,600 671,301 693,353 M H NA<br />
WCC<br />
WCC 09/12 STARS<br />
Community <strong>Programme</strong>s<br />
Group<br />
allocation<br />
Community<br />
programmes<br />
Safety and<br />
security<br />
2,200,208 644,208 766,500 789,500 M H NA<br />
WCC NAP – Massey East and Ranui Investigation Community<br />
programmes<br />
Access and<br />
mobility<br />
150,000 120,000 – – M H NA<br />
HNO<br />
Community Advertising<br />
<strong>2009</strong>/12 – <strong>Auckland</strong><br />
Group<br />
allocation<br />
Community<br />
programmes<br />
Safety and<br />
security<br />
218,000 70,000 73,000 75,000 M H NA<br />
43,056,608 13,496,145 14,481,194 15,244,720
Table 10.3: Activity Class 3, Walking and Cycling Facilities<br />
Approved<br />
Organisation<br />
Project name Phase Work<br />
category<br />
Objectives<br />
Total cost<br />
($)<br />
<strong>2009</strong>/10 cost<br />
($)<br />
2011/12 cost<br />
($)<br />
2011/12 cost<br />
($)<br />
Seriousness<br />
& Urgency<br />
Effectiveness<br />
Efficiency<br />
ACC<br />
<strong>2009</strong>-12 Waikaraka Cycleway<br />
and Onehunga Cycling<br />
Improvements<br />
Construction<br />
(Committed)<br />
Cycle facilities<br />
Access and<br />
mobility<br />
1,540,000 340,000 – –<br />
ACC<br />
Cycling & Walking<br />
Implementation (2008/09)<br />
Construction<br />
(Committed)<br />
Pedestrian<br />
facilities<br />
Sustainability 846,000 376,000 – –<br />
RDC<br />
Orewa West Walkway/<br />
Cycleway<br />
Construction<br />
(Committed)<br />
Cycle facilities Sustainability 3,847,000 482,000 506,000 1,815,000<br />
MCC Cycle Routes 2008/09<br />
(Te Irirangi Drive – Boundary<br />
to Belinda)<br />
Construction<br />
(Committed)<br />
Cycle facilities<br />
Access and<br />
mobility<br />
448,149 398,149 – –<br />
MCC Cycle Routes 2008/09<br />
(GSR: Regent St to Reagan Rd)<br />
Construction<br />
(Committed)<br />
Cycle facilities<br />
Access and<br />
mobility<br />
228,261 148,261 – –<br />
NSCC<br />
2008/09 East Coast Road<br />
Shared Pedestrian/Cycle Path<br />
Construction<br />
(Committed)<br />
Cycle facilities Sustainability 1,200,000 900,000 – –<br />
NSCC<br />
TravelWise to School<br />
<strong>Programme</strong> 05/06<br />
Kristin School<br />
Construction<br />
(Committed)<br />
Pedestrian<br />
facilities<br />
Sustainability 120,000 103,044 – –<br />
MCC SH20 Extension –<br />
Cycleways Stage 1<br />
Construction<br />
(Committed)<br />
Cycle facilities Sustainability 5,550,000 1,550,000 – –<br />
ACC Oceanview Road Cycleway Construction<br />
(Committed)<br />
Cycle facilities Sustainability 566,000 466,000 – –<br />
NSCC<br />
<strong>2009</strong>/12 TravelWise to<br />
School <strong>Programme</strong><br />
Construction<br />
Pedestrian<br />
facilities<br />
Sustainability 1,978,000 682,000 718,000 578,000 H M M<br />
HNO<br />
SH16 Central <strong>Auckland</strong><br />
Connection (CMJ)<br />
Investigation Cycle facilities Access and<br />
mobility<br />
200,000 150,000 – – H M M<br />
HNO<br />
SH16 Central <strong>Auckland</strong><br />
Connection (CMJ)<br />
Design Cycle facilities Access and<br />
mobility<br />
265,000 – 265,000 – H M M<br />
HNO<br />
SH16 Central <strong>Auckland</strong><br />
Connection (CMJ)<br />
Construction Cycle facilities Access and<br />
mobility<br />
6,010,000 – – 6,010,000 H M M<br />
ACC<br />
<strong>2009</strong>-12 School Travel Plan<br />
Infrastructure – <strong>Auckland</strong> City<br />
Group<br />
allocation<br />
Pedestrian<br />
facilities<br />
Sustainability 10,500,000 3,500,000 3,500,000 3,500,000 H M M<br />
FDC<br />
School Travel Plan<br />
Infrastructure<br />
Construction<br />
Pedestrian<br />
facilities<br />
Access and<br />
mobility<br />
1,150,000 100,000 100,000 100,000 H M M<br />
PDC<br />
School Travel Plan<br />
Infrastructure <strong>2009</strong>/2012<br />
Group<br />
allocation<br />
Pedestrian<br />
facilities<br />
Safety and<br />
security<br />
1,500,000 150,000 150,000 150,000 H M M<br />
51
52<br />
Table 10.3: Activity Class 3, Walking and Cycling Facilities (Continued)<br />
Approved<br />
Organisation<br />
Project name Phase Work<br />
category<br />
Objectives<br />
Total cost<br />
($)<br />
<strong>2009</strong>/10 cost<br />
($)<br />
2011/12 cost<br />
($)<br />
2011/12 cost<br />
($)<br />
Seriousness<br />
& Urgency<br />
Effectiveness<br />
Efficiency<br />
WCC<br />
School Travel Plans<br />
(Physical Works)<br />
Group<br />
allocation<br />
Pedestrian<br />
facilities<br />
Sustainability 1,976,192 640,000 658,560 677,632 H M M<br />
MCC<br />
School Travel Plan<br />
Engineering Works<br />
Construction<br />
New traffic<br />
management<br />
facilities<br />
Access and<br />
mobility<br />
1,900,000 300,000 600,000 1,000,000 H M M<br />
RDC School Travel Infrastructure Group<br />
allocation<br />
Pedestrian<br />
facilities<br />
Access and<br />
mobility<br />
1,890,000 630,000 630,000 630,000 H M M<br />
HNO SH16 Rodney North Design Cycle facilities Access and<br />
mobility<br />
HNO SH16 Rodney North Construction Cycle facilities Access and<br />
mobility<br />
75,000 75,000 – – H M M<br />
1,081,500 1,081,500 – – H M M<br />
HNO SH16 Westgate Crossing Investigation Pedestrian<br />
facilities<br />
HNO SH16 Westgate Crossing Design Pedestrian<br />
facilities<br />
HNO SH16 Westgate Crossing Construction Pedestrian<br />
facilities<br />
Safety and<br />
security<br />
Safety and<br />
security<br />
Safety and<br />
security<br />
103,000 103,000 – – H M M<br />
156,810 77,250 79,560 – H M M<br />
3,824,545 – – 3,824,545 H M M<br />
HNO<br />
SH1 Rodney East Silverdale to<br />
Orewa Walking and Cycling<br />
Design Cycle facilities Access and<br />
mobility<br />
51,500 51,500 – – H M M<br />
HNO<br />
SH1 Rodney East Silverdale to<br />
Orewa Walking and Cycling<br />
Construction Cycle facilities Access and<br />
mobility<br />
710,272 – – 710,272 H M M<br />
WCC<br />
Westgate Pedestrian and<br />
Cycle Bridge<br />
Construction<br />
Pedestrian<br />
facilities<br />
Safety and<br />
security<br />
1,852,200 – 1,852,200 – H M –<br />
HNO SH16 Kingsland Cycleway Design Cycle facilities Access and<br />
mobility<br />
HNO SH16 Kingsland Cycleway Construction Cycle facilities Access and<br />
mobility<br />
103,000 103,000 – – H M L<br />
2,636,800 515,000 2,121,800 – H M L<br />
ACC<br />
<strong>2009</strong>-12 Cycle and Walking<br />
<strong>Programme</strong><br />
Group<br />
allocation<br />
Cycle facilities Sustainability 5,375,000 1,164,000 2,058,000 2,153,000 H M –<br />
ACC<br />
<strong>2009</strong>-12 Waikaraka Cycleway<br />
and Onehunga Cycling<br />
Improvements<br />
Construction Cycle facilities Access and<br />
mobility<br />
1,000,000 1,000,000 – – H M L<br />
NSCC<br />
<strong>2009</strong>/12 Pedestrian<br />
Improvement <strong>Programme</strong><br />
Group<br />
allocation<br />
Pedestrian<br />
facilities<br />
Access and<br />
mobility<br />
662,000 210,000 221,000 231,000 H M –
Table 10.3: Activity Class 3, Walking and Cycling Facilities (Continued)<br />
Approved<br />
Organisation<br />
Project name Phase Work<br />
category<br />
Objectives<br />
Total cost<br />
($)<br />
<strong>2009</strong>/10 cost<br />
($)<br />
2011/12 cost<br />
($)<br />
2011/12 cost<br />
($)<br />
Seriousness<br />
& Urgency<br />
Effectiveness<br />
Efficiency<br />
PDC<br />
Walking and cycling<br />
implementation<br />
Group<br />
allocation<br />
Cycle facilities<br />
Access and<br />
mobility<br />
2,916,000 655,000 931,000 1,330,000 H M –<br />
NSCC <strong>2009</strong>/12 Cycle programme Group<br />
allocation<br />
Cycle facilities Sustainability 4,102,000 350,000 3,059,000 693,000 H M L<br />
HNO SH20B Puhinui Road cycle lane Design Cycle facilities Access and<br />
mobility<br />
HNO SH20B Puhinui Road cycle lane Construction Cycle facilities Access and<br />
mobility<br />
30,900 30,900 – – H M L<br />
206,000 206,000 – – H M L<br />
FDC<br />
Pedestrian Facilities<br />
(<strong>2009</strong>-2012)<br />
Construction<br />
Pedestrian<br />
facilities<br />
Sustainability 300,000 100,000 100,000 100,000 H M –<br />
MCC<br />
Strategic Cycleway Network<br />
Routes <strong>2009</strong>/10–2011/12<br />
Group<br />
allocation<br />
Cycle facilities<br />
Access and<br />
mobility<br />
7,438,000 3,037,000 2,164,000 2,237,000 H M –<br />
WCC<br />
Cycle Strategy Works<br />
<strong>2009</strong>/10–2011/12<br />
Group<br />
allocation<br />
Cycle facilities<br />
Access and<br />
mobility<br />
6,066,324 3,100,000 1,769,880 1,196,444 H M –<br />
WCC<br />
Pioneer Street to West Wave<br />
(Walkway and Cycleway<br />
Connection)<br />
Construction Cycle facilities Access and<br />
mobility<br />
629,320 – 205,800 423,520 H M –<br />
HNO<br />
SH Northwestern<br />
Cycle Improvements<br />
Investigation Cycle facilities Access and<br />
mobility<br />
218,545 – – 218,545 H M –<br />
HNO<br />
SH Northwestern<br />
Cycle Improvements<br />
Design Cycle facilities Access and<br />
mobility<br />
218,545 – – 218,545 H M –<br />
HNO<br />
SH1 Northern Cycleway<br />
Stage 2 Onewa Rd to<br />
Esmonde<br />
Investigation Cycle facilities Safety and<br />
security<br />
54,636 – – 54,636 H M –<br />
HNO<br />
SH1 Northern Cycleway<br />
Stage 1 Northcote Road<br />
to Constellation<br />
Investigation Cycle facilities Access and<br />
mobility<br />
109,000 – – 109,000 H M –<br />
HNO<br />
SH1 Southern Cycleway<br />
Stage 1 Marks Rd to Sultan Rd<br />
Investigation Cycle facilities Safety and<br />
security<br />
103,000 103,000 – – H M –<br />
HNO<br />
SH1 Southern Cycleway<br />
Stage 1 Marks Rd to Sultan Rd<br />
Design Cycle facilities Safety and<br />
security<br />
212,000 – 212,000 – H M –<br />
HNO<br />
SH1 Southern Cycleway<br />
Stage 1 Marks Rd to Sultan Rd<br />
Construction Cycle facilities Safety and<br />
security<br />
2,185,000 – – 2,185,000 H M –<br />
HNO<br />
SH1 Southern Cycleway<br />
Stage 2<br />
Investigation Cycle facilities Access and<br />
mobility<br />
109,000 – – 109,000 H M –<br />
53
54<br />
Table 10.3: Activity Class 3, Walking and Cycling Facilities (Continued)<br />
Approved<br />
Organisation<br />
Project name Phase Work<br />
category<br />
Objectives<br />
Total cost<br />
($)<br />
<strong>2009</strong>/10 cost<br />
($)<br />
2011/12 cost<br />
($)<br />
2011/12 cost<br />
($)<br />
Seriousness<br />
& Urgency<br />
Effectiveness<br />
Efficiency<br />
HNO SH1 Warkworth WC Design Cycle facilities Access and<br />
mobility<br />
HNO SH1 Warkworth WC Construction Cycle facilities Access and<br />
mobility<br />
103,000 103,000 – – H M L<br />
803,000 – 530,000 273,000 H M L<br />
HNO<br />
SH16 Hobsonville Rd to<br />
Kennedy’s Rd<br />
Design Cycle facilities Safety and<br />
security<br />
20,000 20,000 – – H M L<br />
HNO<br />
SH16 Hobsonville Rd to<br />
Kennedy’s Rd<br />
Construction Cycle facilities Safety and<br />
security<br />
175,100 175,100 – – H M L<br />
HNO SH16 Rodney District –<br />
Southern: Huapai to Kumeu<br />
Investigation Cycle facilities Access and<br />
mobility<br />
100,000 – – 100,000 H M L<br />
HNO<br />
SH16 Rodney District West:<br />
Parakai to Commercial Road<br />
Design Cycle facilities Access and<br />
mobility<br />
30,000 30,000 – – H M L<br />
HNO<br />
SH16 Rodney District West:<br />
Parakai to Commercial Road<br />
Construction Cycle facilities Access and<br />
mobility<br />
625,000 – 625,000 – H M L<br />
HNO<br />
SH17–SH1 Connection<br />
(Greville Interchange)<br />
Design Cycle facilities Safety and<br />
security<br />
103,000 103,000 – – H M L<br />
HNO<br />
SH17–SH1 Connection<br />
(Greville Interchange)<br />
Construction Cycle facilities Safety and<br />
security<br />
2,121,800 – 2,121,800 – H M L<br />
HNO<br />
Northern Busway Access<br />
to Stations<br />
Investigation Cycle facilities Access and<br />
mobility<br />
100,000 – – 100,000 H M –<br />
HNO<br />
Northern Busway Access<br />
to Stations<br />
Design Cycle facilities Access and<br />
mobility<br />
109,270 – – 109,270 H M –<br />
MCC<br />
Flat Bush Active Modes<br />
– Pathways<br />
Construction Cycle facilities Access and<br />
mobility<br />
29,133,793 3,393,426 1,423,450 1,992,225 H M L<br />
NSCC<br />
<strong>2009</strong>/12 NSCC Travel<br />
Behaviour Change<br />
Infrastructure<br />
Group<br />
allocation<br />
Cycle facilities<br />
Safety and<br />
security<br />
502,000 105,000 166,000 231,000 M H<br />
MCC<br />
Neighbourhood Accessibility<br />
Plans – Physical Works<br />
Construction<br />
Pedestrian<br />
facilities<br />
Access and<br />
mobility<br />
1,923,443 – 213,203 551,129 M M L<br />
MCC<br />
Walkway Routes<br />
(Parks Linked)<br />
Group<br />
allocation<br />
Pedestrian<br />
facilities<br />
Access and<br />
mobility<br />
9,500,000 500,000 1,000,000 1,000,000 M M –<br />
MCC<br />
Walkway Routes<br />
(Roading Linked)<br />
Group<br />
allocation<br />
Pedestrian<br />
facilities<br />
Access and<br />
mobility<br />
9,250,000 500,000 750,000 1,000,000 M M –<br />
141,318,905 27,807,130 28,731,253 35,610,763
Table 10.4: Activity Class 4, Public <strong>Transport</strong> Services<br />
Approved<br />
Organisation<br />
Project name Phase Work<br />
category<br />
Objectives<br />
Total cost<br />
($)<br />
<strong>2009</strong>/10 cost<br />
($)<br />
2011/12 cost<br />
($)<br />
2011/12 cost<br />
($)<br />
Seriousness<br />
& Urgency<br />
Effectiveness<br />
Efficiency<br />
ARTA<br />
Public <strong>Transport</strong><br />
<strong>Programme</strong> <strong>2009</strong>/12<br />
Operations Bus services Access and<br />
mobility<br />
270,248,187 87,433,494 90,056,499 92,758,194 H H –<br />
ARTA<br />
Public <strong>Transport</strong><br />
<strong>Programme</strong> <strong>2009</strong>/12<br />
Operations<br />
Passenger<br />
ferry services<br />
Access and<br />
mobility<br />
20,329,769 6,020,342 7,048,979 7,260,448 H H –<br />
ARTA<br />
Public <strong>Transport</strong><br />
<strong>Programme</strong> <strong>2009</strong>/12<br />
Operations<br />
Bus and<br />
passenger<br />
ferry<br />
concession<br />
fares<br />
Access and<br />
mobility<br />
53,188,085 21,132,490 15,726,497 16,329,098 H H –<br />
ARTA<br />
Public <strong>Transport</strong><br />
<strong>Programme</strong> <strong>2009</strong>/12<br />
Operations<br />
Passenger<br />
transport<br />
facilities<br />
operations<br />
and<br />
maintenance<br />
Access and<br />
mobility<br />
173,127,871 45,801,907 45,854,141 56,570,713 H H –<br />
ARTA<br />
Public <strong>Transport</strong><br />
<strong>Programme</strong> <strong>2009</strong>/12<br />
Operations<br />
Passenger rail<br />
services<br />
Access and<br />
mobility<br />
110,708,128 31,668,937 38,645,720 40,393,471 H H –<br />
ARTA<br />
Public <strong>Transport</strong><br />
<strong>Programme</strong> <strong>2009</strong>/12<br />
Operations<br />
Total mobility<br />
operations<br />
Access and<br />
mobility<br />
15,796,745 4,690,281 5,419,459 5,687,005 H H –<br />
ARTA<br />
Public <strong>Transport</strong><br />
<strong>Programme</strong> <strong>2009</strong>/12<br />
Operations<br />
Wheelchair<br />
hoists<br />
Access and<br />
mobility<br />
300,000 100,000 100,000 100,000 H H –<br />
ARTA<br />
Public <strong>Transport</strong><br />
<strong>Programme</strong> <strong>2009</strong>/12<br />
Operations<br />
Total mobility<br />
flat rate<br />
payments<br />
Access and<br />
mobility<br />
– 444,500 444,500 444,500 H H –<br />
ARTA<br />
Public <strong>Transport</strong><br />
<strong>Programme</strong> <strong>2009</strong>/12<br />
Operations<br />
Super Gold<br />
card<br />
Access and<br />
mobility<br />
– 11,709,646 11,709,646 11,709,646 H H –<br />
ARTA<br />
Public <strong>Transport</strong><br />
<strong>Programme</strong> <strong>2009</strong>/12<br />
Operations<br />
Super Gold<br />
card<br />
administration<br />
Access and<br />
mobility<br />
359,226 119,742 119,742 119,742 H H –<br />
ARTA<br />
Public <strong>Transport</strong> Service<br />
Improvements <strong>2009</strong><br />
Implementation<br />
Passenger<br />
transport<br />
facilities<br />
operations<br />
and<br />
maintenance<br />
Access and<br />
mobility<br />
28,010,000 3,435,000 10,360,000 14,215,000 H H –<br />
ARTA<br />
Public <strong>Transport</strong> Service<br />
Improvements <strong>2009</strong><br />
Implementation Bus services Access and<br />
mobility<br />
29,374,519 – 14,781,997 14,592,522 H H –<br />
ARTA<br />
<strong>Regional</strong> Authority<br />
Administration <strong>2009</strong>/12<br />
Administration<br />
Total mobility<br />
administration<br />
Access and<br />
mobility<br />
578,048 194,016 197,016 187,016<br />
702,020,578 212,750,355 240,464,196 260,367,355<br />
55
56<br />
Table 10.5: Activity Class 5, Public <strong>Transport</strong> Infrastructure<br />
Approved<br />
Organisation<br />
Project name Phase Work<br />
category<br />
Objectives<br />
Total cost<br />
($)<br />
<strong>2009</strong>/10 cost<br />
($)<br />
2011/12 cost<br />
($)<br />
2011/12 cost<br />
($)<br />
Seriousness<br />
& Urgency<br />
Effectiveness<br />
Efficiency<br />
ACC<br />
<strong>2009</strong>-12 Sandringham Rd<br />
Corridor project<br />
Design<br />
(Committed)<br />
Passenger<br />
transport road<br />
improvements<br />
Integration 593,000 93,000 0 0<br />
HNO North Shore Busway (MPP) Construction<br />
(Committed)<br />
Passenger<br />
transport road<br />
improvements<br />
Access and<br />
mobility<br />
196,257,000 5,650,000 0 0<br />
ACC<br />
Central Transit Corridor<br />
(Construction)<br />
Construction<br />
(Committed)<br />
Passenger<br />
transport road<br />
improvements<br />
Access and<br />
mobility<br />
45,770,000 17,415,000 0 0<br />
ARTA Ferry Terminal Upgrades –<br />
Birkenhead New Outer Berth<br />
Construction<br />
(Committed)<br />
Bus and ferry<br />
infrastructure<br />
Access and<br />
mobility<br />
2,140,600 640,600 0 0<br />
ARTA Ferry Terminal Upgrades –<br />
Downtown Remedial Works<br />
Construction<br />
(Committed)<br />
Bus and ferry<br />
infrastructure<br />
Access and<br />
mobility<br />
5,603,000 2,357,000 0 0<br />
ARTA<br />
Multi Modal Passenger<br />
Information System (MMPIS)<br />
Construction<br />
(Committed)<br />
Bus and ferry<br />
infrastructure<br />
Integration 4,864,000 1,907,000 2,530,000 0<br />
ARTA<br />
Route Scheduling<br />
Upgrade Project<br />
Construction<br />
(Committed)<br />
Bus and ferry<br />
infrastructure<br />
Access and<br />
mobility<br />
1,990,000 1,000,000 0 0<br />
NSCC<br />
Carlisle Road BPM<br />
(East Coast Rd to Browns Bay)<br />
Construction<br />
(Committed)<br />
Passenger<br />
transport road<br />
improvements<br />
Access and<br />
mobility<br />
860,000 430,000 0 0<br />
ARTA<br />
Newmarket Rail Station<br />
<strong>2009</strong>/12<br />
Construction<br />
(Committed)<br />
Bus and ferry<br />
infrastructure<br />
Access and<br />
mobility<br />
15,274,000 15,274,000 0 0<br />
MCC Manukau Interchange Design Bus and ferry<br />
infrastructure<br />
MCC Manukau Interchange Construction Bus and ferry<br />
infrastructure<br />
Integration 800,000 800,000 0 0 H H M<br />
Integration 7,200,000 3,200,000 4,000,000 0 H H M<br />
ARTA<br />
<strong>Auckland</strong> Integrated Fare<br />
Solution (AIFS) <strong>Programme</strong><br />
Construction<br />
Bus and ferry<br />
infrastructure<br />
Integration 70,000,000 15,000,000 35,000,000 20,000,000 H H M<br />
ARTA Ferry Terminal Upgrades –<br />
Beach Haven <strong>2009</strong>/12<br />
Construction<br />
Bus and ferry<br />
infrastructure<br />
Access and<br />
mobility<br />
2,832,000 100,000 2,732,000 0 H H M<br />
ARTA Ferry Terminal Upgrades –<br />
Hobsonville <strong>2009</strong>/12<br />
Construction<br />
Bus and ferry<br />
infrastructure<br />
Access and<br />
mobility<br />
1,012,000 0 1,012,000 0 H H M<br />
ARTA Grafton Rail Station Construction Bus and ferry<br />
infrastructure<br />
Access and<br />
mobility<br />
4,621,000 4,621,000 0 0 H H M
Table 10.5: Activity Class 5, Public <strong>Transport</strong> Infrastructure (Continued)<br />
Approved<br />
Organisation<br />
Project name Phase Work<br />
category<br />
Objectives<br />
Total cost<br />
($)<br />
<strong>2009</strong>/10 cost<br />
($)<br />
2011/12 cost<br />
($)<br />
2011/12 cost<br />
($)<br />
Seriousness<br />
& Urgency<br />
Effectiveness<br />
Efficiency<br />
ARTA New Lynn Rail Station Construction Bus and ferry<br />
infrastructure<br />
Access and<br />
mobility<br />
13,858,000 9,000,000 4,858,000 0 H H M<br />
ARTA<br />
Onehunga Branch stations<br />
(DART 19)<br />
Construction<br />
Bus and ferry<br />
infrastructure<br />
Access and<br />
mobility<br />
3,690,000 3,690,000 0 0 H H M<br />
ACC AMETI – Sylvia Park Investigation Passenger<br />
transport road<br />
improvements<br />
ACC AMETI – Sylvia Park Design Passenger<br />
transport road<br />
improvements<br />
ACC AMETI – Sylvia Park Construction Passenger<br />
transport road<br />
improvements<br />
Integration 300,000 300,000 0 0 H H L<br />
Integration 700,000 300,000 400,000 0 H H L<br />
Integration 10,830,000 2,830,000 4,000,000 4,000,000 H H L<br />
NSCC<br />
<strong>2009</strong>/12 Taharoto/<br />
Wairau Corridor (2005/06)<br />
Construction<br />
Passenger<br />
transport road<br />
improvements<br />
Economic<br />
development<br />
12,445,000 805,000 1,933,000 4,192,000 H H L<br />
ARTA CBD Rail Tunnel Investigation Bus and ferry<br />
infrastructure<br />
Access and<br />
mobility<br />
3,629,051 1,549,227 1,026,728 1,053,096 H H L<br />
HNO<br />
Constellation to Albany Bus<br />
Priority Lanes<br />
Investigation<br />
Passenger<br />
transport road<br />
improvements<br />
Access and<br />
mobility<br />
515,000 515,000 0 0 H H L<br />
HNO<br />
Constellation to Albany Bus<br />
Priority Lanes<br />
Design<br />
Passenger<br />
transport road<br />
improvements<br />
Access and<br />
mobility<br />
1,045,450 515,000 530,450 0 H H L<br />
HNO<br />
Constellation to Albany Bus<br />
Priority Lanes<br />
Construction<br />
Passenger<br />
transport road<br />
improvements<br />
Access and<br />
mobility<br />
32,304,405 0 15,913,500 16,390,905 H H L<br />
HNO<br />
Constellation to Orewa<br />
Busway Extension<br />
(Designation Only)<br />
Investigation<br />
Passenger<br />
transport road<br />
improvements<br />
Access and<br />
mobility<br />
73,737,000 1,000,000 6,180,000 5,305,000 H H L<br />
WCC<br />
New Lynn TOD Passenger<br />
<strong>Transport</strong> Interchange<br />
Construction<br />
Bus and ferry<br />
infrastructure<br />
Integration 33,029,952 17,340,725 15,689,227 0 H H L<br />
NSCC <strong>2009</strong>/12 Bus priority measures Group<br />
allocation<br />
Passenger<br />
transport road<br />
improvements<br />
Integration 5,424,000 1,206,000 2,002,000 1,916,000 H H L<br />
57
58<br />
Table 10.5: Activity Class 5, Public <strong>Transport</strong> Infrastructure (Continued)<br />
Approved<br />
Organisation<br />
Project name Phase Work<br />
category<br />
Objectives<br />
Total cost<br />
($)<br />
<strong>2009</strong>/10 cost<br />
($)<br />
2011/12 cost<br />
($)<br />
2011/12 cost<br />
($)<br />
Seriousness<br />
& Urgency<br />
Effectiveness<br />
Efficiency<br />
RDC Park and Ride Station –<br />
Silverdale<br />
Design<br />
Bus and ferry<br />
infrastructure<br />
Sustainability 250,000 250,000 0 0 H H L<br />
RDC Park and Ride Station –<br />
Silverdale<br />
Construction<br />
Bus and ferry<br />
infrastructure<br />
Sustainability 5,000,000 2,380,000 2,620,000 0 H H L<br />
ACC <strong>2009</strong>-12 Dominion Rd PT Design Passenger<br />
transport road<br />
improvements<br />
ACC <strong>2009</strong>-12 Dominion Rd PT Construction Passenger<br />
transport road<br />
improvements<br />
Access and<br />
mobility<br />
Access and<br />
mobility<br />
700,000 0 700,000 0 H H L<br />
34,500,000 0 0 6,500,000 H H L<br />
NSCC <strong>2009</strong>/12 Bus station upgrades Group<br />
allocation<br />
Passenger<br />
transport road<br />
improvements<br />
Access and<br />
mobility<br />
3,963,000 160,000 3,738,000 65,000 H H L<br />
NSCC<br />
<strong>2009</strong>/12 College Road<br />
HOV Lanes<br />
Construction<br />
Passenger<br />
transport road<br />
improvements<br />
Sustainability 1,104,000 0 1,104,000 0 H H L<br />
NSCC<br />
<strong>2009</strong>/12 College Road<br />
HOV Lanes<br />
Design<br />
Passenger<br />
transport road<br />
improvements<br />
Sustainability 420,000 420,000 0 0 H H L<br />
ARTA CCTV Network Development Construction Bus and ferry<br />
infrastructure<br />
Safety and<br />
security<br />
1,016,000 0 506,000 510,000 H H L<br />
ARTA<br />
Existing Ferry Terminal<br />
Infrastructure Upgrades<br />
<strong>2009</strong>/12<br />
Group<br />
allocation<br />
Bus and ferry<br />
infrastructure<br />
Access and<br />
mobility<br />
865,000 325,000 231,014 331,725 H H L<br />
ARTA Ferry Terminal Upgrades –<br />
Bayswater <strong>2009</strong>/12<br />
Construction<br />
Bus and ferry<br />
infrastructure<br />
Access and<br />
mobility<br />
6,608,000 500,000 1,012,000 5,096,000 H H L<br />
ARTA Avondale Rail Station Construction Bus and ferry<br />
infrastructure<br />
Access and<br />
mobility<br />
1,520,000 1,520,000 0 0 H H L<br />
ARTA Ferry Terminal Upgrades –<br />
Downtown<br />
Group<br />
allocation<br />
Bus and ferry<br />
infrastructure<br />
Access and<br />
mobility<br />
4,050,000 3,750,000 300,000 0 H H L<br />
ARTA Ferry Terminal Upgrades –<br />
Half Moon Bay <strong>2009</strong>/12<br />
Construction<br />
Bus and ferry<br />
infrastructure<br />
Access and<br />
mobility<br />
8,836,000 100,000 4,333,000 4,403,000 H H L<br />
ARTA<br />
Kingsland Station<br />
Enhancements for RWC<br />
Construction<br />
Bus and ferry<br />
infrastructure<br />
Access and<br />
mobility<br />
6,018,000 4,500,000 1,518,000 0 H H L
Table 10.5: Activity Class 5, Public <strong>Transport</strong> Infrastructure (Continued)<br />
Approved<br />
Organisation<br />
Project name Phase Work<br />
category<br />
Objectives<br />
Total cost<br />
($)<br />
<strong>2009</strong>/10 cost<br />
($)<br />
2011/12 cost<br />
($)<br />
2011/12 cost<br />
($)<br />
Seriousness<br />
& Urgency<br />
Effectiveness<br />
Efficiency<br />
ARTA Manukau City Rail Link – ARTA Design Bus and ferry<br />
infrastructure<br />
ARTA Manukau City Rail Link – ARTA Construction Bus and ferry<br />
infrastructure<br />
Access and<br />
mobility<br />
Access and<br />
mobility<br />
1,400,000 1,400,000 0 0 H H L<br />
13,400,000 10,364,000 3,036,000 0 H H L<br />
ARTA<br />
Newmarket Rail Station<br />
<strong>2009</strong>/12<br />
Construction<br />
Bus and ferry<br />
infrastructure<br />
Access and<br />
mobility<br />
1,012,000 0 1,012,000 0 H H L<br />
ARTA Parnell Station Design Bus and ferry<br />
infrastructure<br />
ARTA Rail Investigations <strong>2009</strong>/12 Investigation Bus and ferry<br />
infrastructure<br />
Access and<br />
mobility<br />
Access and<br />
mobility<br />
1,500,000 0 0 1,500,000 H H L<br />
3,673,062 945,000 888,120 868,804 H H L<br />
ARTA Station Upgrades (non DART) Group<br />
allocation<br />
Bus and ferry<br />
infrastructure<br />
Access and<br />
mobility<br />
40,283,000 3,510,000 9,533,000 9,600,000 H H L<br />
MCC Otahuhu Bus/Rail Interchange Construction Bus and ferry<br />
infrastructure<br />
Access and<br />
mobility<br />
600,000 600,000 0 0 H H L<br />
MCC<br />
Park and Ride and<br />
Interchange Improvements<br />
Group<br />
allocation<br />
Bus and ferry<br />
infrastructure<br />
Access and<br />
mobility<br />
2,500,000 2,250,000 250,000 0 H H L<br />
MCC Puhinui Bus/Rail Interchange Construction Bus and ferry<br />
infrastructure<br />
Integration 400,000 30,000 370,000 0 H H L<br />
NSCC<br />
<strong>2009</strong>/12 Ferries and Wharves<br />
<strong>Programme</strong><br />
Group<br />
allocation<br />
Bus and ferry<br />
infrastructure<br />
Integration 4,820,700 0 2,565,000 1,850,000 H H L<br />
MCC<br />
Major Passenger <strong>Transport</strong><br />
Projects<br />
Group<br />
allocation<br />
Bus and ferry<br />
infrastructure<br />
Access and<br />
mobility<br />
27,664,000 520,000 533,000 551,000 H H L<br />
WCC<br />
Park and Ride Facilities<br />
<strong>2009</strong>/10–2011/12<br />
Group<br />
allocation<br />
Bus and ferry<br />
infrastructure<br />
Access and<br />
mobility<br />
3,435,981 102,900 1,164,680 H M L<br />
844,946,295 141,062,552 132,158,939 85,297,210<br />
59
60<br />
Table 10.6: Activity Class 8 and 10, Maintenance Operations and Renewal <strong>Programme</strong>s of Local Roads<br />
Approved<br />
Organisation<br />
Project name Phase Work<br />
category<br />
Objectives<br />
Total cost<br />
($)<br />
<strong>2009</strong>/10 cost<br />
($)<br />
2011/12 cost<br />
($)<br />
2011/12 cost<br />
($)<br />
Seriousness<br />
& Urgency<br />
Effectiveness<br />
Efficiency<br />
ACC<br />
Maintenance, Operations and<br />
Renewals <strong>Programme</strong><br />
<strong>2009</strong>/12<br />
Local Roads<br />
Sealed<br />
pavement<br />
maintenance<br />
Economic<br />
development<br />
191,774,590 64,254,330 64,132,130 63,388,130 H H –<br />
FDC<br />
Maintenance, Operations and<br />
Renewals <strong>Programme</strong><br />
<strong>2009</strong>/12<br />
Local Roads<br />
Sealed<br />
pavement<br />
maintenance<br />
Economic<br />
development<br />
55,909,840 18,278,783 18,461,907 19,169,150 H H –<br />
MCC<br />
Maintenance, Operations and<br />
Renewals <strong>Programme</strong><br />
<strong>2009</strong>/12<br />
Local Roads<br />
Sealed<br />
pavement<br />
maintenance<br />
Economic<br />
development<br />
113,562,400 35,775,400 37,723,000 40,064,000 H H –<br />
NSCC<br />
Maintenance, Operations and<br />
Renewals <strong>Programme</strong><br />
<strong>2009</strong>/12<br />
Local Roads<br />
Sealed<br />
pavement<br />
maintenance<br />
Economic<br />
development<br />
75,689,232 23,897,442 25,317,999 26,473,791 H H –<br />
PDC<br />
Maintenance, Operations and<br />
Renewals <strong>Programme</strong><br />
<strong>2009</strong>/12<br />
Local Roads<br />
Sealed<br />
pavement<br />
maintenance<br />
Economic<br />
development<br />
20,102,134 6,442,937 6,662,926 6,996,271 H H –<br />
RDC<br />
Maintenance, Operations and<br />
Renewals <strong>Programme</strong><br />
<strong>2009</strong>/12<br />
Local Roads<br />
Sealed<br />
pavement<br />
maintenance<br />
Economic<br />
development<br />
95,570,000 30,544,000 31,914,000 33,112,000 H H –<br />
WCC<br />
Maintenance, Operations and<br />
Renewals <strong>Programme</strong><br />
<strong>2009</strong>/12<br />
Local Roads<br />
Sealed<br />
pavement<br />
maintenance<br />
Economic<br />
development<br />
64,926,047 21,068,000 21,637,017 22,221,030 H H –<br />
MCC<br />
Preventive Maintenance<br />
Projects<br />
Construction<br />
Preventive<br />
maintenance<br />
Economic<br />
development<br />
1,287,000 416,000 320,000 551,000 M M NA<br />
PDC Preventative Maintenance Construction Preventive<br />
maintenance<br />
Economic<br />
development<br />
100,000 100,000 100,000 100,000 M M NA<br />
RDC Preventive Maintenance –<br />
Slips <strong>2009</strong>-12<br />
Construction<br />
Preventive<br />
maintenance<br />
Economic<br />
development<br />
4,365,000 1,455,000 1,455,000 1,455,000 M M NA<br />
WCC Preventative Maintenance Group<br />
allocation<br />
Preventive<br />
maintenance<br />
Economic<br />
development<br />
4,053,127 2,124,000 950,796 978,331 M M NA<br />
627,539,370 204,355,892 208,674,775 214,508,703
Table 10.7: Activity Class 9 and 11, Maintenance Operations and Renewal <strong>Programme</strong>s of State Highways<br />
Approved<br />
Organisation<br />
Project name Phase Work<br />
category<br />
Objectives<br />
Total cost<br />
($)<br />
<strong>2009</strong>/10 cost<br />
($)<br />
2011/12 cost<br />
($)<br />
2011/12 cost<br />
($)<br />
Seriousness<br />
& Urgency<br />
Effectiveness<br />
Efficiency<br />
HNO<br />
(E) Heavy Rainfall <strong>Auckland</strong><br />
North July 08<br />
Construction<br />
(Committed)<br />
Emergency<br />
reinstatement<br />
Economic<br />
development<br />
3,395,800 820,800<br />
HNO<br />
Maintenance, Operations and<br />
Renewals <strong>Programme</strong><br />
<strong>2009</strong>/12<br />
State<br />
Highways<br />
Sealed<br />
pavement<br />
maintenance<br />
Economic<br />
development<br />
37,145,118 13,749,050 12,440,402 10,955,666 H H –<br />
HNO<br />
Maintenance, Operations and<br />
Renewals <strong>Programme</strong><br />
<strong>2009</strong>/14<br />
State<br />
Highways<br />
Routine<br />
drainage<br />
maintenance<br />
Economic<br />
development<br />
4,612,041 1,459,242 1,535,043 1,617,756 H H –<br />
HNO<br />
Maintenance, Operations and<br />
Renewals <strong>Programme</strong><br />
<strong>2009</strong>/15<br />
State<br />
Highways<br />
Structures<br />
maintenance<br />
Economic<br />
development<br />
16,229,977 5,122,375 5,416,441 5,691,161 H H –<br />
HNO<br />
Maintenance, Operations and<br />
Renewals <strong>Programme</strong><br />
<strong>2009</strong>/16<br />
State<br />
Highways<br />
Environmental<br />
maintenance<br />
Economic<br />
development<br />
17,514,164 5,546,115 5,826,466 6,141,583 H H –<br />
HNO<br />
Maintenance, Operations and<br />
Renewals <strong>Programme</strong><br />
<strong>2009</strong>/17<br />
State<br />
Highways<br />
Traffic services<br />
maintenance<br />
Economic<br />
development<br />
14,757,702 4,653,315 4,915,619 5,188,768 H H –<br />
HNO<br />
Maintenance, Operations and<br />
Renewals <strong>Programme</strong><br />
<strong>2009</strong>/18<br />
State<br />
Highways<br />
Operational<br />
traffic<br />
management<br />
Economic<br />
development<br />
32,241,735 9,875,520 10,702,017 11,664,198 H H –<br />
HNO<br />
Maintenance, Operations and<br />
Renewals <strong>Programme</strong><br />
<strong>2009</strong>/19<br />
State<br />
Highways<br />
Cycle path<br />
maintenance<br />
Economic<br />
development<br />
89,665 20,660 42,147 26,858 H H –<br />
HNO<br />
Maintenance, Operations and<br />
Renewals <strong>Programme</strong><br />
<strong>2009</strong>/21<br />
State<br />
Highways<br />
Network<br />
and asset<br />
management<br />
Economic<br />
development<br />
43,035,105 13,675,854 14,318,422 15,040,829 H H –<br />
HNO<br />
Maintenance, Operations and<br />
Renewals <strong>Programme</strong><br />
<strong>2009</strong>/22<br />
State<br />
Highways<br />
Property<br />
management<br />
(State<br />
highways)<br />
Economic<br />
development<br />
15,600,000 5,000,000 5,200,000 5,400,000 H H –<br />
HNO<br />
Maintenance, Operations and<br />
Renewals <strong>Programme</strong><br />
<strong>2009</strong>/12<br />
State<br />
Highways<br />
Sealed road<br />
resurfacing<br />
Economic<br />
development<br />
48,506,900 15,890,620 16,190,109 16,426,171 H H –<br />
HNO<br />
Maintenance, Operations and<br />
Renewals <strong>Programme</strong><br />
<strong>2009</strong>/12<br />
State<br />
Highways<br />
Drainage<br />
renewals<br />
Economic<br />
development<br />
2,256,627 681,423 762,800 812,404 H H –<br />
61
62<br />
Table 10.7: Activity Class 9 and 11, Maintenance Operations and Renewal <strong>Programme</strong>s of State Highways (Continued)<br />
Approved<br />
Organisation<br />
Project name Phase Work<br />
category<br />
Objectives<br />
Total cost<br />
($)<br />
<strong>2009</strong>/10 cost<br />
($)<br />
2011/12 cost<br />
($)<br />
2011/12 cost<br />
($)<br />
Seriousness<br />
& Urgency<br />
Effectiveness<br />
Efficiency<br />
HNO<br />
Maintenance, Operations and<br />
Renewals <strong>Programme</strong><br />
<strong>2009</strong>/12<br />
State<br />
Highways<br />
Sealed road<br />
pavement<br />
rehabilitation<br />
Economic<br />
development<br />
11,169,053 6,593,849 2,262,800 2,312,404 H H –<br />
HNO<br />
Maintenance, Operations and<br />
Renewals <strong>Programme</strong><br />
<strong>2009</strong>/12<br />
State<br />
Highways<br />
Structures<br />
component<br />
replacements<br />
Economic<br />
development<br />
16,839,628 5,824,599 5,339,222 5,675,807 H H –<br />
HNO<br />
Maintenance, Operations and<br />
Renewals <strong>Programme</strong><br />
<strong>2009</strong>/12<br />
State<br />
Highways<br />
Environmental<br />
renewals<br />
Economic<br />
development<br />
13,972,234 363,950 6,731,948 6,876,336 H H –<br />
HNO<br />
Maintenance, Operations and<br />
Renewals <strong>Programme</strong><br />
<strong>2009</strong>/12<br />
State<br />
Highways<br />
Traffic services<br />
renewals<br />
Economic<br />
development<br />
5,228,131 4,500,139 356,385 371,607 H H –<br />
HNO<br />
Maintenance, Operations and<br />
Renewals <strong>Programme</strong><br />
<strong>2009</strong>/12<br />
State<br />
Highways<br />
Associated<br />
improvements<br />
Economic<br />
development<br />
11,085,526 791,425 5,029,107 5,264,994 H H –<br />
HNO<br />
<strong>Auckland</strong> Route Security and<br />
Environmental Group<br />
Preventive<br />
Maintenance<br />
<strong>2009</strong>/12<br />
Preventive<br />
maintenance<br />
Responsiveness 2,999,154 698,340 1,127,850 1,172,964 M M NA<br />
HNO<br />
Preventive Maintenance<br />
<strong>2009</strong>/12<br />
Construction<br />
Preventive<br />
maintenance<br />
Responsiveness 2,999,154 698,340 1,127,850 1,172,964 M M NA<br />
299,677,714 95,965,616 99,324,628 101,812,470
Table 10.8: Activity Class 12 , Infrastructure for Local Roads<br />
Approved<br />
Organisation<br />
Project name Phase Work<br />
category<br />
Objectives<br />
Total cost<br />
($)<br />
<strong>2009</strong>/10 cost<br />
($)<br />
2011/12 cost<br />
($)<br />
2011/12 cost<br />
($)<br />
Seriousness<br />
& Urgency<br />
Effectiveness<br />
Efficiency<br />
NSCC <strong>2009</strong>/12 Anzac Street Corridor Construction<br />
(Committed)<br />
Property<br />
purchase<br />
(local roads)<br />
Economic<br />
development<br />
2,300,000 353,968 – –<br />
NSCC<br />
<strong>2009</strong>/12 Taharoto/<br />
Wairau Corridor (2005/06)<br />
Design<br />
(Committed)<br />
Road<br />
reconstruction<br />
Economic<br />
development<br />
1,300,000 800,000 – –<br />
NSCC<br />
<strong>2009</strong>/12 Taharoto/<br />
Wairau Corridor (2005/06)<br />
Construction<br />
(Committed)<br />
Road<br />
reconstruction<br />
Economic<br />
development<br />
1,309,500 209,500 – –<br />
NSCC<br />
Albany Civic Crescent PT<br />
Measures 06/07<br />
Construction<br />
(Committed)<br />
Road<br />
reconstruction<br />
Economic<br />
development<br />
3,162,069 2,200,000 – –<br />
NSCC<br />
East Coast Rd Widening<br />
(Hastings – Rosedale)<br />
Construction<br />
(Committed)<br />
Road<br />
reconstruction<br />
Economic<br />
development<br />
7,152,000 2,603,000 3,897,654 –<br />
NSCC Esmonde Rd Widening 2004/05 Construction<br />
(Committed)<br />
Road<br />
reconstruction<br />
Economic<br />
development<br />
12,472,243 100,000 – –<br />
NSCC<br />
Glendhu Rd Upgrading<br />
and Link 05/06<br />
Design<br />
(Committed)<br />
Road<br />
reconstruction<br />
Economic<br />
development<br />
430,000 300,883 – –<br />
NSCC<br />
Glenfield Rd<br />
(Bentley-Sunset) 06/07<br />
Construction<br />
(Committed)<br />
Road<br />
reconstruction<br />
Economic<br />
development<br />
21,377,000 5,089,000 667,230 –<br />
NSCC Lake Road Widening (LP) Construction<br />
(Committed)<br />
Advance<br />
property<br />
purchase<br />
Economic<br />
development<br />
3,900,000 425,946 – –<br />
NSCC Lake Road Widening 06/07 Construction<br />
(Committed)<br />
Road<br />
reconstruction<br />
Economic<br />
development<br />
9,479,600 5,500,000 3,379,600 –<br />
WCC New Lynn TOD Project –<br />
Stage 1<br />
Construction<br />
(Committed)<br />
Road<br />
reconstruction<br />
Economic<br />
development<br />
32,750,000 14,865,000 15,485,000 0<br />
WCC New Lynn TOD Project –<br />
Stage 1<br />
Construction<br />
(Committed)<br />
New roads<br />
Economic<br />
development<br />
9,840,000 4,900,000 0 0<br />
ACC<br />
Tiverton Rd/Wolverton St<br />
Route Upgrade<br />
Construction<br />
(Committed)<br />
Road<br />
reconstruction<br />
Access and<br />
mobility<br />
13,547,000 5,690,000 4,900,000 0<br />
WCC<br />
Advanced Traffic<br />
Management 06/07<br />
Construction<br />
(Committed)<br />
New traffic<br />
management<br />
facilities<br />
Safety and<br />
security<br />
1,000,000 100,000 100,000 100,000<br />
ACC<br />
Greenlane <strong>Transport</strong><br />
Improvements – <strong>Land</strong><br />
Construction<br />
(Committed)<br />
Advance<br />
property<br />
purchase<br />
Access and<br />
mobility<br />
7,500,000 257,823 0 0<br />
63
64<br />
Table 10.8: Activity Class 12 , Infrastructure for Local Roads (Continued)<br />
Approved<br />
Organisation<br />
Project name Phase Work<br />
category<br />
Objectives<br />
Total cost<br />
($)<br />
<strong>2009</strong>/10 cost<br />
($)<br />
2011/12 cost<br />
($)<br />
2011/12 cost<br />
($)<br />
Seriousness<br />
& Urgency<br />
Effectiveness<br />
Efficiency<br />
WCC<br />
40 km/h Variable Speed Zones<br />
for School Areas<br />
Construction<br />
(Committed)<br />
New traffic<br />
management<br />
facilities<br />
Safety and<br />
security<br />
540,000 540,000 0 0<br />
RDC<br />
Warkworth SH1 Intersection<br />
Improvements<br />
Construction<br />
(Committed)<br />
Road<br />
reconstruction<br />
Economic<br />
development<br />
5,470,000 2,400,000 1,200,000 670,000<br />
ACC Aotea Seal Extension Construction<br />
(Committed)<br />
Seal extension<br />
Access and<br />
mobility<br />
3,518,000 1,300,000 918,000 0<br />
ACC Riddell Road Culvert No. 2 Construction<br />
(Committed)<br />
Replacement of<br />
bridges and<br />
other structures<br />
Safety and<br />
security<br />
450,000 360,000 0 0<br />
ACC<br />
AMETI Notice of Requirement<br />
and AEE<br />
Investigation<br />
(Committed)<br />
Road<br />
reconstruction<br />
Integration 44,100,000 18,100,000 17,600,000 5,900,000<br />
NSCC<br />
<strong>2009</strong>/12 Taharoto/<br />
Wairau Corridor (2005/06)<br />
Property<br />
Property<br />
purchase<br />
(local roads)<br />
Economic<br />
development<br />
2,999,000 2,999,000 – – H H H<br />
WCC New Lynn TOD Project –<br />
Stage 1<br />
Construction New roads Economic<br />
development<br />
34,336,424 0 0 12,250,000 H H H<br />
WCC New Lynn TOD Project –<br />
Stage 1<br />
Construction<br />
Property<br />
purchase<br />
(local roads)<br />
Economic<br />
development<br />
5,712,000 0 0 5,712,000 H H H<br />
ACC<br />
<strong>2009</strong>-12 Sandringham Rd<br />
Corridor Project (RWC)<br />
Construction<br />
Property<br />
purchase<br />
(local roads)<br />
Integration 4,163,150 2,000,000 2,163,150 0 H H M<br />
ACC<br />
<strong>2009</strong>-12 Sandringham Rd<br />
Corridor Project (RWC)<br />
Property<br />
Property<br />
purchase<br />
(local roads)<br />
Integration 3,596,200 3,596,200 0 0 H H M<br />
NSCC<br />
<strong>2009</strong>/12 Albany Highway<br />
Corridor Upgrade<br />
Investigation<br />
Road<br />
reconstruction<br />
Economic<br />
development<br />
160,000 160,000 – – H M H<br />
NSCC<br />
<strong>2009</strong>/12 Albany Highway<br />
Corridor Upgrade<br />
Property<br />
Property<br />
purchase<br />
(local roads)<br />
Economic<br />
development<br />
1,831,000 1,831,000 – – H M H<br />
NSCC<br />
<strong>2009</strong>/12 Albany Highway<br />
Corridor Upgrade<br />
Design<br />
Road<br />
reconstruction<br />
Economic<br />
development<br />
530,000 160,000 – 370,000 H M H<br />
NSCC<br />
<strong>2009</strong>/12 Albany Highway<br />
Corridor Upgrade<br />
Construction<br />
Road<br />
reconstruction<br />
Economic<br />
development<br />
32,539,000 1,680,000 3,313,000 2,311,000 H M H
Table 10.8: Activity Class 12 , Infrastructure for Local Roads (Continued)<br />
Approved<br />
Organisation<br />
Project name Phase Work<br />
category<br />
Objectives<br />
Total cost<br />
($)<br />
<strong>2009</strong>/10 cost<br />
($)<br />
2011/12 cost<br />
($)<br />
2011/12 cost<br />
($)<br />
Seriousness<br />
& Urgency<br />
Effectiveness<br />
Efficiency<br />
MCC Whitford Maraetai Rd –<br />
Jack Lachlan to Okaroro<br />
Construction<br />
Road<br />
reconstruction<br />
Safety and<br />
security<br />
2,232,000 100,000 2,132,000 0 H M H<br />
RDC Arterial Safety Upgrades –<br />
Rural and Rural Townships<br />
Group<br />
allocation<br />
Road<br />
reconstruction<br />
Safety and<br />
security<br />
2,850,000 300,000 1,300,000 1,000,000 H M H<br />
MCC<br />
Flat Bush School Road/<br />
Murphys Road Intersection<br />
Upgrade<br />
Property<br />
Property<br />
purchase<br />
(local roads)<br />
Integration 3,000,000 0 3,000,000 0 M H H<br />
MCC<br />
Flat Bush School Road/<br />
Murphys Road Intersection<br />
Upgrade<br />
Construction<br />
Road<br />
reconstruction<br />
Integration 3,020,000 100,000 2,920,000 0 M H H<br />
MCC<br />
Mahia Road/Coxhead Road<br />
Roundabout Improvements<br />
Construction<br />
New traffic<br />
management<br />
facilities<br />
Access and<br />
mobility<br />
85,000 85,000 0 0 M H H<br />
WCC<br />
Sturges Road Bridge<br />
Replacement and Widening<br />
Construction New roads Safety and<br />
security<br />
8,784,000 8,784,000 0 0 H M M<br />
ACC<br />
Oceanview Road<br />
Reconstruction – Waiheke<br />
Construction<br />
Road<br />
reconstruction<br />
Access and<br />
mobility<br />
1,920,000 1,420,000 0 0 M M H<br />
MCC AMETI – Manukau Designations Investigation Road<br />
reconstruction<br />
Integration 3,500,000 0 400,000 800,000 H H –<br />
MCC<br />
AMETI – Pakuranga Interim<br />
Improvements<br />
Investigation<br />
Road<br />
reconstruction<br />
Integration 100,000 100,000 0 0 H H –<br />
MCC<br />
AMETI – Pakuranga Interim<br />
Improvements<br />
Design<br />
Road<br />
reconstruction<br />
Integration 250,000 250,000 0 0 H H –<br />
MCC<br />
AMETI – Pakuranga Interim<br />
Improvements<br />
Construction<br />
Road<br />
reconstruction<br />
Integration 5,200,000 0 2,000,000 3,200,000 H H –<br />
MCC<br />
AMETI – Pakuranga Interim<br />
Improvements<br />
Property<br />
Property<br />
purchase<br />
(local roads)<br />
Integration 2,000,000 0 0 2,000,000 H H –<br />
MCC<br />
AMETI – Pakuranga Road<br />
Bus Lanes<br />
Investigation<br />
Road<br />
reconstruction<br />
Integration 100,000 100,000 0 0 H H –<br />
MCC<br />
AMETI – Pakuranga Road<br />
Bus Lanes<br />
Design<br />
Road<br />
reconstruction<br />
Integration 300,000 100,000 200,000 0 H H –<br />
MCC<br />
AMETI – Pakuranga Road<br />
Bus Lanes<br />
Construction<br />
Road<br />
reconstruction<br />
Integration 4,600,000 0 3,000,000 1,600,000 H H –<br />
65
66<br />
Table 10.8: Activity Class 12 , Infrastructure for Local Roads (Continued)<br />
Approved<br />
Organisation<br />
Project name Phase Work<br />
category<br />
Objectives<br />
Total cost<br />
($)<br />
<strong>2009</strong>/10 cost<br />
($)<br />
2011/12 cost<br />
($)<br />
2011/12 cost<br />
($)<br />
Seriousness<br />
& Urgency<br />
Effectiveness<br />
Efficiency<br />
MCC<br />
AMETI – Pakuranga Road<br />
Bus Lanes<br />
Property<br />
Property<br />
purchase<br />
(local roads)<br />
Integration 6,000,000 0 6,000,000 0 H H –<br />
MCC<br />
AMETI – Ti Rakau Drive<br />
Bus Lanes<br />
Property<br />
Property<br />
purchase<br />
(local roads)<br />
Integration 500,000 0 0 200,000 H H –<br />
MCC<br />
AMETI – Ti Rakau Drive at<br />
Gossamer and Trugood<br />
Construction<br />
Road<br />
reconstruction<br />
Integration 18,800,000 0 0 4,800,000 H H –<br />
MCC<br />
AMETI – Ti Rakau Drive at<br />
Gossamer and Trugood<br />
Design<br />
Road<br />
reconstruction<br />
Integration 1,300,000 400,000 900,000 0 H H –<br />
MCC<br />
AMETI – Ti Rakau Drive at<br />
Gossamer and Trugood<br />
Investigation<br />
Road<br />
reconstruction<br />
Integration 400,000 400,000 0 0 H H –<br />
MCC<br />
AMETI – Ti Rakau Drive at<br />
Gossamer and Trugood<br />
Property<br />
Property<br />
purchase<br />
(local roads)<br />
Integration 7,000,000 0 0 3,000,000 H H –<br />
ACC AMETI – Panmure (Phase 1) Investigation Road<br />
reconstruction<br />
ACC AMETI – Panmure (Phase 1) Design Road<br />
reconstruction<br />
ACC AMETI – Panmure (Phase 2) Investigation Road<br />
reconstruction<br />
Integration 1,000,000 1,000,000 0 0 H H –<br />
Integration 6,400,000 0 3,200,000 3,200,000 H H –<br />
Integration 300,000 0 100,000 0 H H –<br />
ACC<br />
AMETI – Panmure Bridge<br />
(Joint ACC/MCC)<br />
Construction<br />
Replacement of<br />
bridges and<br />
other structures<br />
Integration 2,620,000 0 1,880,000 740,000 H H –<br />
ACC<br />
AMETI – Panmure Bridge<br />
(Joint ACC/MCC)<br />
Design<br />
Replacement of<br />
bridges and<br />
other structures<br />
Integration 170,000 170,000 0 0 H H –<br />
ACC<br />
AMETI – Panmure Bridge<br />
(Joint ACC/MCC)<br />
Investigation<br />
Replacement of<br />
bridges and<br />
other structures<br />
Integration 100,000 100,000 0 0 H H –<br />
ACC AMETI – Sylvia Park Property Property<br />
purchase<br />
(local roads)<br />
Integration 3,000,000 1,000,000 2,000,000 0 H H –<br />
ACC<br />
AMETI – Traffic Modelling<br />
(ACC/MCC)<br />
Investigation<br />
Road<br />
reconstruction<br />
Integration 1,300,000 500,000 200,000 200,000 H H –
Table 10.8: Activity Class 12 , Infrastructure for Local Roads (Continued)<br />
Approved<br />
Organisation<br />
Project name Phase Work<br />
category<br />
Objectives<br />
Total cost<br />
($)<br />
<strong>2009</strong>/10 cost<br />
($)<br />
2011/12 cost<br />
($)<br />
2011/12 cost<br />
($)<br />
Seriousness<br />
& Urgency<br />
Effectiveness<br />
Efficiency<br />
ACC<br />
AMETI – Waipuna/<br />
Mt Wellington/Carbine SEART<br />
Investigation<br />
Road<br />
reconstruction<br />
Integration 4,200,000 400,000 800,000 800,000 H H –<br />
MCC Smales Road Widening Construction Road<br />
reconstruction<br />
Access and<br />
mobility<br />
6,022,000 219,000 225,000 2,756,000 H H –<br />
PDC<br />
Manuroa Road – Rail<br />
Overbridge and Approaches<br />
Property New roads Access and<br />
mobility<br />
5,000,000 0 5,000,000 0 H H –<br />
PDC<br />
Manuroa Road – Rail<br />
Overbridge and Approaches<br />
Design New roads Access and<br />
mobility<br />
480,000 480,000 0 0 H H –<br />
PDC<br />
Manuroa Road – Rail<br />
Overbridge and Approaches<br />
Construction New roads Access and<br />
mobility<br />
20,000,000 0 0 10,000,000 H H –<br />
PDC<br />
Mill Road Corridor Route<br />
Protection<br />
Investigation New roads Integration 450,000 50,000 200,000 200,000 H H NA<br />
ACC <strong>2009</strong>-12 Dominion Rd PT Investigation Road<br />
reconstruction<br />
Access and<br />
mobility<br />
700,000 700,000 0 0 H H –<br />
ACC <strong>2009</strong>-12 Dominion Rd PT Property Advance<br />
property<br />
purchase<br />
Access and<br />
mobility<br />
30,958,000 0 0 15,364,000 H H –<br />
WCC Hobsonville Interchange Construction Road<br />
reconstruction<br />
Integration 1,337,700 0 1,337,700 0 H H –<br />
MCC<br />
Flat Bush to Manukau QTN<br />
Route Upgrade<br />
Group<br />
allocation<br />
Road<br />
reconstruction<br />
Access and<br />
mobility<br />
19,687,000 519,000 746,000 551,000 H H NA<br />
NSCC<br />
<strong>2009</strong>/12 Albany Highway<br />
(Sunset to SH18)<br />
Investigation<br />
Road<br />
reconstruction<br />
Economic<br />
development<br />
469,000 130,000 166,000 173,000 H M NA<br />
NSCC<br />
<strong>2009</strong>/12 Gills Rd (Living Stream<br />
Ave to Oteha Valley Rd)<br />
Investigation New roads Access and<br />
mobility<br />
347,000 126,000 221,000 – H M NA<br />
WCC SCATS and CCTV –<br />
Optimisation<br />
(<strong>2009</strong>/10–2011/12)<br />
Construction<br />
New traffic<br />
management<br />
facilities<br />
Sustainability 185,268 60,000 61,740 63,528 H M –<br />
NSCC<br />
<strong>2009</strong>/12 East Coast/Glenvar/<br />
Lonely Track<br />
Design<br />
Road<br />
reconstruction<br />
Access and<br />
mobility<br />
58,000 – – 58,000 H M –<br />
NSCC<br />
<strong>2009</strong>/12 Lonely Track/Gills/<br />
Albany Heights<br />
Design<br />
Road<br />
reconstruction<br />
Safety and<br />
security<br />
108,000 53,000 55,000 – H M –<br />
MCC<br />
Ormiston Preston East Tamaki<br />
Intersection<br />
Construction<br />
Road<br />
reconstruction<br />
Economic<br />
development<br />
10,879,000 312,000 103,000 5,170,000 H M –<br />
67
68<br />
Table 10.8: Activity Class 12 , Infrastructure for Local Roads (Continued)<br />
Approved<br />
Organisation<br />
Project name Phase Work<br />
category<br />
Objectives<br />
Total cost<br />
($)<br />
<strong>2009</strong>/10 cost<br />
($)<br />
2011/12 cost<br />
($)<br />
2011/12 cost<br />
($)<br />
Seriousness<br />
& Urgency<br />
Effectiveness<br />
Efficiency<br />
RDC<br />
Driver Environment<br />
Modification – Snells Beach<br />
Construction<br />
Road<br />
reconstruction<br />
Safety and<br />
security<br />
1,000,000 0 500,000 500,000 H M –<br />
NSCC<br />
<strong>2009</strong>/12 Chivalry Rd/Diana Dr/<br />
Chartwell Ave Intersection<br />
Design<br />
Road<br />
reconstruction<br />
Access and<br />
mobility<br />
116,000 – – 116,000 H M –<br />
FDC<br />
Franklin Intersection<br />
Improvements <strong>2009</strong>/2012<br />
Group<br />
allocation<br />
Road<br />
reconstruction<br />
Safety and<br />
security<br />
1,508,000 67,000 815,000 620,000 H M –<br />
NSCC<br />
<strong>2009</strong>/12 Long Bay<br />
Development<br />
Design<br />
Road<br />
reconstruction<br />
Integration 1,102,000 735,000 367,000 – H M –<br />
NSCC<br />
<strong>2009</strong>/12 Long Bay<br />
Development<br />
Construction<br />
Road<br />
reconstruction<br />
Integration 3,150,000 – 1,050,000 2,100,000 H M –<br />
NSCC<br />
<strong>2009</strong>/12 Okura River Rd/<br />
Vaughans Rd<br />
Design<br />
Road<br />
reconstruction<br />
Integration 1,824,000 245,000 784,000 795,000 H M –<br />
NSCC <strong>2009</strong>/12 Glenvar Road Design Road<br />
reconstruction<br />
PDC Hingaia Rd Improvements Construction Road<br />
reconstruction<br />
Access and<br />
mobility<br />
Economic<br />
development<br />
315,000 315,000 – – H M –<br />
1,044,435 0 1,044,435 0 H M –<br />
MCC<br />
Flat Bush School Rd Bridge<br />
Replacement<br />
Property<br />
Property<br />
purchase<br />
(local roads)<br />
Safety and<br />
security<br />
1,073,000 1,073,000 0 0 H M –<br />
MCC<br />
Flat Bush School Rd Bridge<br />
Replacement<br />
Construction<br />
Replacement of<br />
bridges and<br />
other structures<br />
Safety and<br />
security<br />
8,708,000 5,708,000 3,000,000 0 H M –<br />
MCC Named Safety Projects <strong>2009</strong>/12 Design Road<br />
reconstruction<br />
Safety and<br />
security<br />
14,353,000 0 0 1,653,000 H M –<br />
MCC<br />
North Road Route<br />
Improvements<br />
Group<br />
allocation<br />
Road<br />
reconstruction<br />
Safety and<br />
security<br />
4,607,000 0 0 531,000 H M NA<br />
PDC<br />
Intersection Improvements<br />
– Safety<br />
Group<br />
allocation<br />
Road<br />
reconstruction<br />
Safety and<br />
security<br />
1,385,000 100,000 330,000 955,000 H M –<br />
NSCC <strong>2009</strong>/12 Safety <strong>Programme</strong> Group<br />
allocation<br />
Road<br />
reconstruction<br />
Safety and<br />
security<br />
1,891,000 787,000 552,000 552,000 H M –<br />
NSCC<br />
<strong>2009</strong>/12 Street Light<br />
<strong>Programme</strong><br />
Construction<br />
Road<br />
reconstruction<br />
Safety and<br />
security<br />
1,655,000 525,000 552,000 578,000 H M –<br />
MCC Speed Management Strategy Construction New traffic<br />
management<br />
facilities<br />
Safety and<br />
security<br />
1,125,000 365,000 375,000 385,000 H M NA
Table 10.8: Activity Class 12 , Infrastructure for Local Roads (Continued)<br />
Approved<br />
Organisation<br />
Project name Phase Work<br />
category<br />
Objectives<br />
Total cost<br />
($)<br />
<strong>2009</strong>/10 cost<br />
($)<br />
2011/12 cost<br />
($)<br />
2011/12 cost<br />
($)<br />
Seriousness<br />
& Urgency<br />
Effectiveness<br />
Efficiency<br />
WCC<br />
CRS Implementation Physical<br />
Works (<strong>2009</strong>/10–2011/12)<br />
Group<br />
allocation<br />
Road<br />
reconstruction<br />
Safety and<br />
security<br />
2,007,071 650,000 668,851 688,220 H M –<br />
PDC<br />
Porchester Rd Construction<br />
Walters Rd to Airfield Rd<br />
Construction<br />
Road<br />
reconstruction<br />
Economic<br />
development<br />
3,745,050 3,745,050 0 0 H M –<br />
PDC<br />
Porchester Rd Construction<br />
Walters Rd to Airfield Rd<br />
Construction<br />
Road<br />
reconstruction<br />
Economic<br />
development<br />
4,394,190 0 4,394,190 0 H M –<br />
RDC<br />
Penlink Construction<br />
(<strong>2009</strong> version)<br />
Construction New roads Economic<br />
development<br />
203,400,000 49,200,000 91,400,000 62,800,000 M M M<br />
MCC Road Reconstruction <strong>2009</strong>-12 Group<br />
allocation<br />
Road<br />
reconstruction<br />
Sustainability 14,676,000 4,888,000 4,940,000 4,848,000 L M H<br />
RDC Sealing of Unsealed Roads Group<br />
allocation<br />
Seal extension Integration 16,869,000 5,844,000 4,997,000 6,016,000 L M H<br />
MCC Heavy Vehicle Weigh Stations Construction New traffic<br />
management<br />
facilities<br />
Sustainability 316,000 156,000 160,000 0 M H NA<br />
NSCC<br />
<strong>2009</strong>/12 Tristram Ave Road<br />
Improvement<br />
Construction<br />
New traffic<br />
management<br />
facilities<br />
Safety and<br />
security<br />
495,000 495,000 – – M H –<br />
ACC <strong>2009</strong>-12 Te Wero Bridge Investigation New roads Access and<br />
mobility<br />
ACC <strong>2009</strong>-12 Te Wero Bridge Design New roads Access and<br />
mobility<br />
200,000 0 200,000 0 M H –<br />
3,500,000 0 0 1,000,000 M H –<br />
FDC<br />
Manukau Rd/Stadium Dr/<br />
East St Intersection<br />
Improvements<br />
Construction<br />
Road<br />
reconstruction<br />
Economic<br />
development<br />
1,290,000 1,290,000 0 0 M H –<br />
WCC<br />
Advance Direction Signs<br />
– Physical Works<br />
Construction<br />
New traffic<br />
management<br />
facilities<br />
Safety and<br />
security<br />
448,170 135,000 154,350 158,820 M H –<br />
ACC<br />
<strong>2009</strong>-12 Advanced<br />
Destination Signs<br />
Construction<br />
New traffic<br />
management<br />
facilities<br />
Responsiveness 1,710,000 570,000 570,000 570,000 M H –<br />
PDC District Way Finding Signs Construction New traffic<br />
management<br />
facilities<br />
Access and<br />
mobility<br />
657,670 0 324,135 333,535 M H –<br />
NSCC<br />
<strong>2009</strong>/12 PT Safety and<br />
Security <strong>Programme</strong><br />
Construction<br />
New traffic<br />
management<br />
facilities<br />
Safety and<br />
security<br />
280,000 145,000 135,000 – M H –<br />
69
70<br />
Table 10.8: Activity Class 12 , Infrastructure for Local Roads (Continued)<br />
Approved<br />
Organisation<br />
Project name Phase Work<br />
category<br />
Objectives<br />
Total cost<br />
($)<br />
<strong>2009</strong>/10 cost<br />
($)<br />
2011/12 cost<br />
($)<br />
2011/12 cost<br />
($)<br />
Seriousness<br />
& Urgency<br />
Effectiveness<br />
Efficiency<br />
PDC<br />
Clevedon Broadway Rail<br />
Over Bridge<br />
Construction<br />
Replacement of<br />
bridges and<br />
other structures<br />
Economic<br />
development<br />
2,305,500 0 1,543,500 762,000 M M –<br />
PDC<br />
Clevedon Broadway Rail<br />
Over Bridge<br />
Design<br />
Replacement of<br />
bridges and<br />
other structures<br />
Economic<br />
development<br />
280,000 280,000 0 0 M M –<br />
ACC<br />
<strong>2009</strong>-12 Street Light Renewals<br />
and OHUG <strong>Programme</strong><br />
Construction<br />
New traffic<br />
management<br />
facilities<br />
Safety and<br />
security<br />
9,800,000 980,000 980,000 980,000 M M –<br />
FDC<br />
Bridge Widening and<br />
Strengthening<br />
Group<br />
allocation<br />
Replacement of<br />
bridges and<br />
other structures<br />
Responsiveness 900,000 400,000 200,000 300,000 M M –<br />
FDC Culvert B Bridge Replacement Construction Replacement of<br />
bridges and<br />
other structures<br />
Sustainability 200,000 200,000 0 0 M M –<br />
RDC Bridge Replacements Group<br />
allocation<br />
Replacement of<br />
bridges and<br />
other structures<br />
Integration 2,355,000 850,000 755,000 200,000 M M NA<br />
ACC<br />
<strong>2009</strong>-2012 Structural<br />
Improvements and<br />
Replacements<br />
Construction<br />
Replacement of<br />
bridges and<br />
other structures<br />
Access and<br />
mobility<br />
4,981,998 1,660,666 1,660,666 1,660,666 M M NA<br />
ACC<br />
<strong>2009</strong>-12 Corridor<br />
Improvements<br />
Construction<br />
Road<br />
reconstruction<br />
Responsiveness 2,100,000 700,000 700,000 700,000 L M –<br />
PDC Railway St West Link Construction New roads Economic<br />
development<br />
1,175,000 0 1,175,000 0 L M –<br />
NSCC <strong>2009</strong>/12 Glenfield Rd/Kaipatiki Construction Road<br />
reconstruction<br />
Responsiveness 1,926,000 – 1,926,000 – L M –<br />
PDC Intersection Improvements –<br />
Route Efficiency<br />
Group<br />
allocation<br />
Road<br />
reconstruction<br />
Economic<br />
development<br />
4,080,000 2,030,000 1,800,000 250,000 L M –<br />
NSCC<br />
<strong>2009</strong>/12 Pavement<br />
Reconstruction <strong>Programme</strong><br />
Group<br />
allocation<br />
Road<br />
reconstruction<br />
Sustainability 6,857,133 2,572,352 2,394,051 1,890,730 L M –<br />
ACC Cricket Ave Extension Design New roads Access and<br />
mobility<br />
200,000 100,000 100,000 0 L M –<br />
ACC Cricket Ave Extension Property Property<br />
purchase<br />
(local roads)<br />
Access and<br />
mobility<br />
1,800,000 1,800,000 0 0 L M –
Table 10.8: Activity Class 12 , Infrastructure for Local Roads (Continued)<br />
Approved<br />
Organisation<br />
Project name Phase Work<br />
category<br />
Objectives<br />
Total cost<br />
($)<br />
<strong>2009</strong>/10 cost<br />
($)<br />
2011/12 cost<br />
($)<br />
2011/12 cost<br />
($)<br />
Seriousness<br />
& Urgency<br />
Effectiveness<br />
Efficiency<br />
NSCC<br />
<strong>2009</strong>/12 Kyle Road<br />
Reconstruction/Upgrading<br />
Investigation New roads Access and<br />
mobility<br />
436,000 210,000 111,000 115,000 L M –<br />
PDC<br />
Great South Rd – Manuroa Rd<br />
– Beaumaris Way Intersection<br />
Construction<br />
Road<br />
reconstruction<br />
Economic<br />
development<br />
525,000 0 525,000 0 L M –<br />
PDC<br />
Papakura Interchange Local<br />
Road Associated Works<br />
Construction<br />
Road<br />
reconstruction<br />
Economic<br />
development<br />
100,000 0 0 100,000 L M –<br />
MCC<br />
Lambie Drive South<br />
Improvements<br />
Construction<br />
Road<br />
reconstruction<br />
Access and<br />
mobility<br />
1,102,000 0 0 1,102,000 L M –<br />
WCC Central Park Dr Extension –<br />
(Intersection Improvements)<br />
Construction New roads Economic<br />
development<br />
1,422,593 0 1,422,593 0 L M –<br />
WCC SH18 – Buckley Interchange Construction New roads Economic<br />
development<br />
2,023,200 1,523,200 500,000 0 L M –<br />
ACC<br />
<strong>2009</strong>-12 Pavement<br />
Reconstruction <strong>Programme</strong><br />
Group<br />
allocation<br />
Road<br />
reconstruction<br />
Economic<br />
development<br />
30,000,000 10,000,000 10,000,000 10,000,000 L M –<br />
PDC Pavement Reconstruction Group<br />
allocation<br />
Road<br />
reconstruction<br />
Access and<br />
mobility<br />
3,075,624 1,000,000 1,025,000 1,050,625 L M –<br />
RDC<br />
Wainui Rd/Silverdale St<br />
Intersection Improvements<br />
(11/12)<br />
Construction<br />
Road<br />
reconstruction<br />
Integration 650,000 0 0 650,000 L M –<br />
WCC Road Reconstruction 09/12 Group<br />
allocation<br />
Road<br />
reconstruction<br />
Sustainability 6,175,600 2,000,000 2,058,000 2,117,600 L M NA<br />
RDC Mahurangi River Link –<br />
Woodcocks Road to Falls Road<br />
Construction New roads Integration 5,676,000 0 5,676,000 0 L M –<br />
WCC<br />
Street Lighting Improvements<br />
<strong>2009</strong>/10–2011/12<br />
Construction<br />
Road<br />
reconstruction<br />
Safety and<br />
security<br />
1,389,510 450,000 463,050 476,460 L M –<br />
PDC<br />
Hunua Gorge Winstone Quarry<br />
Realignment<br />
Design<br />
Road<br />
reconstruction<br />
Safety and<br />
security<br />
250,000 0 0 250,000 L M –<br />
FDC<br />
Franklin Road Reconstruction<br />
<strong>Programme</strong> <strong>2009</strong>/2012<br />
Group<br />
allocation<br />
Road<br />
reconstruction<br />
Responsiveness 3,000,000 1,000,000 1,000,000 1,000,000 L M –<br />
FDC<br />
Pukekohe Eastern Arterial<br />
Route (Stage One)<br />
Construction New roads Access and<br />
mobility<br />
600,000 0 600,000 0 L M –<br />
ACC<br />
<strong>2009</strong>-12 Seal Extension<br />
<strong>Programme</strong><br />
Group<br />
allocation<br />
Seal extension Responsiveness 4,744,680 1,915,200 1,915,200 914,280 L M –<br />
71
72<br />
Table 10.8: Activity Class 12 , Infrastructure for Local Roads (Continued)<br />
Approved<br />
Organisation<br />
Project name Phase Work<br />
category<br />
Objectives<br />
Total cost<br />
($)<br />
<strong>2009</strong>/10 cost<br />
($)<br />
2011/12 cost<br />
($)<br />
2011/12 cost<br />
($)<br />
Seriousness<br />
& Urgency<br />
Effectiveness<br />
Efficiency<br />
MCC<br />
Beachlands Maraetai Kerb<br />
and Channel<br />
Group<br />
allocation<br />
Road<br />
reconstruction<br />
Access and<br />
mobility<br />
5,905,000 525,000 538,000 557,000 L M –<br />
ACC Minor Improvements <strong>2009</strong>/12 Local Roads Minor<br />
improvements<br />
– 15,341,966 5,140,346 5,130,570 5,071,050<br />
ACC Administration Support –<br />
Roading <strong>2009</strong>/12<br />
FDC Administration Support –<br />
Roading <strong>2009</strong>/12<br />
Annual<br />
allocation<br />
Annual<br />
allocation<br />
– 9,718,068 3,579,159 3,147,266 2,991,643<br />
– 1,395,000 465,000 465,000 465,000<br />
FDC Minor Improvements <strong>2009</strong>/12 Local Roads Minor<br />
improvements<br />
PDC Minor Improvements <strong>2009</strong>/12 Local Roads Minor<br />
improvements<br />
– 3,693,000 1,231,000 1,231,000 1,231,000<br />
– 2,726,618 804,824 948,108 973,686<br />
PDC Administration Support –<br />
Roading <strong>2009</strong>/12<br />
RDC Administration Support –<br />
Roading <strong>2009</strong>/12<br />
Annual<br />
allocation<br />
Annual<br />
allocation<br />
– 1,903,350 550,525 632,125 720,700<br />
– 2,275,000 621,000 1,038,000 616,000<br />
RDC Minor Improvements <strong>2009</strong>/12 Local Roads Minor<br />
improvements<br />
– 7,391,900 2,443,500 2,465,000 2,483,400<br />
WCC Administration Support –<br />
Roading <strong>2009</strong>/12<br />
Annual<br />
allocation<br />
– 972,670 315,000 324,135 333,535<br />
WCC Minor Improvements <strong>2009</strong>/12 Local Roads Minor<br />
improvements<br />
– 4,875,637 1,579,000 1,624,791 1,671,846<br />
NSCC Administration Support –<br />
Roading <strong>2009</strong>/12<br />
Annual<br />
allocation<br />
– 4,776,000 1,550,700 1,554,200 1,671,100<br />
NSCC Minor Improvements <strong>2009</strong>/12 Local Roads Minor<br />
improvements<br />
– 4,697,000 1,490,000 1,570,000 1,637,000<br />
MCC Administration Support –<br />
Roading <strong>2009</strong>/12<br />
Annual<br />
allocation<br />
– 12,350,000 4,000,000 4,100,000 4,250,000<br />
MCC Minor Improvements <strong>2009</strong>/12 Local Roads Minor<br />
improvements<br />
– 9,085,000 2,862,000 3,018,000 3,205,000<br />
941,257,787 230,345,842 275,400,290 220,785,424
Table 10.9: Activity Class 13, Infrastructure for State Highways<br />
Approved<br />
Organisation<br />
Project name Phase Work<br />
category<br />
Objectives<br />
Total cost<br />
($)<br />
<strong>2009</strong>/10 cost<br />
($)<br />
2011/12 cost<br />
($)<br />
2011/12 cost<br />
($)<br />
Seriousness<br />
& Urgency<br />
Effectiveness<br />
Efficiency<br />
HNO AHB Structural Upgrade Construction<br />
(Committed)<br />
Replacement of<br />
bridges and<br />
other structures<br />
Responsiveness 45,037,100 15,750,000 – –<br />
HNO ATMS Stage IV Construction<br />
(Committed)<br />
New traffic<br />
management<br />
facilities<br />
Safety and<br />
security<br />
66,036,600 11,005,700 9,900,000 11,800,000<br />
HNO ATMS Stage IV Design<br />
(Committed)<br />
New traffic<br />
management<br />
facilities<br />
Safety and<br />
security<br />
2,861,100 930,000 500,100 100,000<br />
HNO ATMS Stage IV Investigation<br />
(Committed)<br />
Traffic<br />
management<br />
Safety and<br />
security<br />
190,000 20,000 20,000 10,000<br />
HNO Hobsonville Deviation Construction<br />
(Committed)<br />
New roads<br />
Economic<br />
development<br />
205,301,200 69,000,000 59,214,800 8,900,000<br />
HNO Kopuku Realignment Investigation<br />
(Committed)<br />
Road<br />
reconstruction<br />
Safety and<br />
security<br />
1,750,000 1,103,400 – –<br />
HNO Manukau Extension Construction<br />
(Committed)<br />
New roads<br />
Access and<br />
mobility<br />
211,764,000 41,520,000 5,451,100 1,953,000<br />
HNO Manukau Harbour Crossing Construction<br />
(Committed)<br />
New roads<br />
Access and<br />
mobility<br />
232,739,400 88,933,000 47,100,000 –<br />
HNO<br />
McKinney Road/Wech Drive<br />
Intersection Improvements<br />
Design<br />
(Committed)<br />
New roads<br />
Safety and<br />
security<br />
450,000 150,000 200,000 –<br />
HNO Newmarket Viaduct Construction<br />
(Committed)<br />
Replacement of<br />
bridges and<br />
other structures<br />
Economic<br />
development<br />
208,040,000 79,340,000 59,400,000 38,400,000<br />
HNO<br />
Newmarket Viaduct to<br />
Greenlane Aux<br />
Construction<br />
(Committed)<br />
Road<br />
reconstruction<br />
Economic<br />
development<br />
22,700,000 16,900,000 5,800,000 –<br />
HNO<br />
Newmarket Viaduct to<br />
Greenlane Aux<br />
Design<br />
(Committed)<br />
New roads<br />
and structures<br />
Economic<br />
development<br />
2,000,000 480,000 – –<br />
HNO<br />
Northern Motorway TDM<br />
(Ramp Signalling)<br />
Construction<br />
(Committed)<br />
New traffic<br />
management<br />
facilities<br />
Safety and<br />
security<br />
14,695,500 3,931,500 – –<br />
HNO<br />
Punganui Stream Bridge<br />
Replacement<br />
Construction<br />
(Committed)<br />
Replacement of<br />
bridges and<br />
other structures<br />
Safety and<br />
security<br />
6,600,000 4,500,000 2,100,000 –<br />
HNO SH16 Brigham Creek Ext Construction<br />
(Committed)<br />
New roads<br />
and structures<br />
Access and<br />
mobility<br />
19,000,000 – 16,000,000 3,000,000<br />
73
74<br />
Table 10.9: Activity Class 13, Infrastructure for State Highways (Continued)<br />
Approved<br />
Organisation<br />
Project name Phase Work<br />
category<br />
Objectives<br />
Total cost<br />
($)<br />
<strong>2009</strong>/10 cost<br />
($)<br />
2011/12 cost<br />
($)<br />
2011/12 cost<br />
($)<br />
Seriousness<br />
& Urgency<br />
Effectiveness<br />
Efficiency<br />
HNO Southern Motorway TDM Construction<br />
(Committed)<br />
New traffic<br />
management<br />
facilities<br />
Safety and<br />
security<br />
27,498,700 2,261,100 – –<br />
HNO WRR Ramp Signalling Construction<br />
(Committed)<br />
New traffic<br />
management<br />
facilities<br />
Safety and<br />
security<br />
17,087,800 5,000,000 5,000,000 –<br />
HNO Warkworth Stage 1 Construction<br />
(Committed)<br />
Road<br />
reconstruction<br />
Economic<br />
development<br />
15,000,000 7,280,000 2,540,000 2,300,000<br />
HNO Waterview Connection Investigation<br />
(Committed)<br />
New roads<br />
Economic<br />
development<br />
9,840,100 3,440,000 – –<br />
HNO Waterview Connection Property<br />
(Committed)<br />
Property<br />
purchase<br />
(State<br />
highways)<br />
Economic<br />
development<br />
108,775,000 27,875,000 44,600,000 25,300,000<br />
HNO Victoria Park Tunnel Construction<br />
(Committed)<br />
New roads<br />
Access and<br />
mobility<br />
361,000,000 30,000,000 100,000,000 105,000,000<br />
HNO Victoria Park Tunnel Property<br />
(Committed)<br />
Property<br />
purchase<br />
(State<br />
highways)<br />
Access and<br />
mobility<br />
45,450,000 8,000,000 30,000,000 5,450,000<br />
HNO Schedewys Hill Dev Design New roads Safety and<br />
security<br />
3,371,000 – 1,159,000 1,210,000 H H M<br />
HNO<br />
McKinney Road/Wech Drive<br />
Intersection Improvements<br />
Construction New roads Safety and<br />
security<br />
11,506,000 – – 11,506,000 H M H<br />
HNO <strong>Auckland</strong> Road Safety Group Group<br />
allocation<br />
Road<br />
reconstruction<br />
Safety and<br />
security<br />
32,789,505 14,412,505 10,447,223 16,217,232 H M H<br />
HNO<br />
<strong>Auckland</strong> Improved Traffic<br />
Management Group<br />
Group<br />
allocation<br />
Road<br />
reconstruction<br />
Safety and<br />
security<br />
3,754,512 1,770,632 1,676,621 1,833,240 M H H<br />
HNO Puhoi to Wellsford Property New roads Access and<br />
mobility<br />
HNO Puhoi to Wellsford Investigation New roads Access and<br />
mobility<br />
38,894,000 – – 7,545,000 H M M<br />
19,200,000 6,000,000 7,500,000 5,700,000 H M M<br />
HNO<br />
Papakura Interchange<br />
Upgrade Stage 1<br />
Construction<br />
Road<br />
reconstruction<br />
Access and<br />
mobility<br />
34,831,375 – 13,791,700 14,205,450 H M M
Table 10.9: Activity Class 13, Infrastructure for State Highways (Continued)<br />
Approved<br />
Organisation<br />
Project name Phase Work<br />
category<br />
Objectives<br />
Total cost<br />
($)<br />
<strong>2009</strong>/10 cost<br />
($)<br />
2011/12 cost<br />
($)<br />
2011/12 cost<br />
($)<br />
Seriousness<br />
& Urgency<br />
Effectiveness<br />
Efficiency<br />
HNO<br />
Papakura Interchange<br />
Upgrade Stage 1<br />
Design<br />
Road<br />
reconstruction<br />
Access and<br />
mobility<br />
309,000 309,000 – – H M M<br />
HNO<br />
Papakura Interchange<br />
Upgrade Stage 1<br />
Property<br />
Property<br />
purchase<br />
(State<br />
highways)<br />
Access and<br />
mobility<br />
206,000 206,000 – – H M M<br />
HNO<br />
Lincoln Rd Interchange<br />
Upgrade<br />
Investigation<br />
Road<br />
reconstruction<br />
Access and<br />
mobility<br />
1,560,000 1,030,000 530,000 – H M M<br />
HNO<br />
Lincoln Rd Interchange<br />
Upgrade<br />
Design<br />
Road<br />
reconstruction<br />
Access and<br />
mobility<br />
1,623,000 – 526,000 1,097,000 H M M<br />
HNO<br />
Lincoln Rd Interchange<br />
Upgrade<br />
Property<br />
Property<br />
purchase<br />
(State<br />
highways)<br />
Access and<br />
mobility<br />
5,751,000 1,428,000 2,125,000 2,198,000 H M M<br />
HNO Dome Hill Realign Design Road<br />
reconstruction<br />
Safety and<br />
security<br />
646,088 – – 318,270 H M M<br />
HNO<br />
St Lukes to Te Atatu<br />
Interchange Upgrade<br />
Investigation New roads Access and<br />
mobility<br />
3,136,286 1,547,119 1,589,167 – H M M<br />
HNO<br />
St Lukes to Te Atatu<br />
Interchange Upgrade<br />
Property<br />
Property<br />
purchase<br />
(State<br />
highways)<br />
Access and<br />
mobility<br />
5,562,000 – – 2,740,000 H M M<br />
HNO<br />
St Lukes to Te Atatu<br />
Interchange Upgrade<br />
Design New roads Access and<br />
mobility<br />
7,537,542 – 3,718,244 3,819,298 H M M<br />
HNO Hobsonville Deviation Property Property<br />
purchase<br />
(State<br />
highways)<br />
Economic<br />
development<br />
4,100,000 4,100,000 – – M M H<br />
HNO SH20B Upgrade Investigation Road<br />
reconstruction<br />
HNO SH20B Upgrade Design Road<br />
reconstruction<br />
HNO SH20B Upgrade Property Road<br />
reconstruction<br />
Economic<br />
development<br />
Economic<br />
development<br />
Economic<br />
development<br />
HNO Waterview Connection Design New roads Economic<br />
development<br />
836,360 412,000 424,360 – H H L<br />
891,545 – – 891,545 H H L<br />
2,621,350 – 1,030,000 1,591,350 H H L<br />
86,622,000 14,984,000 12,638,000 10,000,000 H H L<br />
75
76<br />
Table 10.9: Activity Class 13, Infrastructure for State Highways (Continued)<br />
Approved<br />
Organisation<br />
Project name Phase Work<br />
category<br />
Objectives<br />
Total cost<br />
($)<br />
<strong>2009</strong>/10 cost<br />
($)<br />
2011/12 cost<br />
($)<br />
2011/12 cost<br />
($)<br />
Seriousness<br />
& Urgency<br />
Effectiveness<br />
Efficiency<br />
HNO Waterview Connection Construction New roads Economic<br />
development<br />
974,005,000 – 53,241,000 106,481,000 H H L<br />
HNO<br />
Waitemata Harbour Crossing<br />
(Designation only)<br />
Investigation New roads Integration 12,828,000 2,065,000 5,309,000 5,454,000 H H L<br />
HNO<br />
Waitemata Harbour Crossing<br />
(Designation only)<br />
Property<br />
Property<br />
purchase<br />
(State<br />
highways)<br />
Integration 9,144,000 – – 2,174,000 H H L<br />
HNO Falls Bridge Realignment Investigation Road<br />
reconstruction<br />
HNO Kopuku Realignment Design Road<br />
reconstruction<br />
Safety and<br />
security<br />
Safety and<br />
security<br />
HNO Kirkbride Rd Grade Separate Investigation New roads Safety and<br />
security<br />
HNO Old Mangere Bridge WC Investigation Replacement of<br />
bridges and<br />
other structures<br />
HNO Old Mangere Bridge WC Design Replacement of<br />
bridges and<br />
other structures<br />
HNO Old Mangere Bridge WC Construction Replacement of<br />
bridges and<br />
other structures<br />
Access and<br />
mobility<br />
Access and<br />
mobility<br />
Access and<br />
mobility<br />
HNO Kirkbride Rd Grade Separate Design New roads Safety and<br />
security<br />
HNO Kirkbride Rd Grade Separate Property New roads Safety and<br />
security<br />
538,407 – – 265,225 H H L<br />
3,397,000 – – 281,000 H M L<br />
2,477,000 1,220,000 1,257,000 – H M –<br />
323,600 200,000 123,600 – H M L<br />
428,789 – 206,000 222,789 H M L<br />
12,921,762 – – 6,365,400 H M L<br />
2,000,000 – – 1,000,000 H M L<br />
5,000,000 – 2,500,000 2,500,000 H M L<br />
HNO Kopuku Realignment Property Property<br />
purchase<br />
(State<br />
highways)<br />
Safety and<br />
security<br />
3,262,000 – 1,062,000 1,640,000 H M L<br />
HNO<br />
<strong>Auckland</strong> Roading Route<br />
Efficiency Group<br />
Group<br />
allocation<br />
Road<br />
reconstruction<br />
Access and<br />
mobility<br />
14,172,615 5,003,540 6,987,776 10,068,950 L M H<br />
HNO<br />
Constellation to Albany<br />
Interchange Upgrade<br />
Investigation<br />
Road<br />
reconstruction<br />
Economic<br />
development<br />
3,246,354 – 1,060,900 2,185,454 M M –
Table 10.9: Activity Class 13, Infrastructure for State Highways (Continued)<br />
Approved<br />
Organisation<br />
Project name Phase Work<br />
category<br />
Objectives<br />
Total cost<br />
($)<br />
<strong>2009</strong>/10 cost<br />
($)<br />
2011/12 cost<br />
($)<br />
2011/12 cost<br />
($)<br />
Seriousness<br />
& Urgency<br />
Effectiveness<br />
Efficiency<br />
HNO<br />
Constellation to Albany<br />
Interchange Upgrade<br />
Property<br />
Road<br />
reconstruction<br />
Economic<br />
development<br />
5,463,635 – – 5,463,635 M M –<br />
HNO<br />
<strong>Auckland</strong> Route security and<br />
environmental group<br />
Group<br />
allocation<br />
New traffic<br />
management<br />
facilities<br />
Responsiveness 7,010,340 3,140,000 3,175,000 3,254,900 M M –<br />
HNO SH20A Upgrade Property Road<br />
reconstruction<br />
HNO SH20A Upgrade Investigation Road<br />
reconstruction<br />
HNO SH20A Upgrade Design Road<br />
reconstruction<br />
Economic<br />
development<br />
Economic<br />
development<br />
Economic<br />
development<br />
540,000 – – 540,000 L M M<br />
1,568,175 772,500 795,675 – L M M<br />
546,363 – – 546,363 L M M<br />
HNO Minor improvements <strong>2009</strong>/12 State<br />
Highways<br />
Minor<br />
improvements<br />
– 21,649,284 6,799,851 7,307,879 7,541,554<br />
HNO Administration support –<br />
Roading <strong>2009</strong>/12<br />
Annual<br />
allocation<br />
– 12,322,082 3,986,568 4,106,165 4,229,349<br />
2,982,409,469 486,806,415 532,113,310 443,299,004<br />
77
APPENDIX 1: AUCKLAND<br />
RLTP’S LEGISLATIVE REQUIREMENTS<br />
The <strong>Auckland</strong> <strong>Regional</strong> <strong>Land</strong> <strong>Transport</strong> <strong>Programme</strong> is a document<br />
required under the <strong>Land</strong> <strong>Transport</strong> Management Act (LTMA) 2003, to<br />
be prepared every three years by ARTA seeking funding from the<br />
NZTA. ARTA prepares a land transport programme known as the<br />
<strong>Auckland</strong> RLTP covering all transport activities undertaken by<br />
<strong>Auckland</strong> local authorities, NZTA HNO and ARTA.<br />
The NZTA must give effect to the GPS in developing the NLTP and<br />
take account of the GPS when approving project funding. The GPS<br />
sets funding ranges for 16 different activity classes. The activity class<br />
ranges, together with the GPS targets, will guide NZTA’s funding<br />
decisions. The GPS also requires the land transport sector to make<br />
best use of resources by achieving value for money.<br />
In preparing the <strong>Auckland</strong> RLTP ARTA must:<br />
1. Include a statement of its view of land transport priorities<br />
(including the priorities of other Approved Organisations) for the<br />
<strong>Auckland</strong> region. In preparing this statement of priorities, ARTA:<br />
><br />
><br />
Must take into account the ten-year financial forecasts of the<br />
land transport expenditure of the NZTA, <strong>Auckland</strong> territorial<br />
authorities, and<br />
Must be satisfied that the priorities contribute to its objective,<br />
including its social and environmental responsibilities, and<br />
contribute to the following goals:<br />
> Assisting economic development.<br />
> Assisting safety and personal security.<br />
> Improving access and mobility.<br />
> Protecting and promoting public health.<br />
> Ensuring environmental sustainability.<br />
It must also include all significant expenditure from sources other<br />
than NZTA.<br />
2. Take into account how each activity or activity class contributes<br />
to the goals listed above.<br />
3. Take into account any current National <strong>Land</strong> <strong>Transport</strong> Strategy<br />
and the National Energy Efficiency and Conservation Strategy.<br />
4. Give effect to the matters in the <strong>Auckland</strong> RLTS, unless it is<br />
required to do otherwise by operational considerations that<br />
affect the sequencing and timing of activities, the funding<br />
available to it, or its statutory functions or powers.<br />
5. Consider the needs of persons who are transport-disadvantaged.<br />
78
APPENDIX 2:<br />
PRIORITISATION PROCESS<br />
A critical part of preparing the RLTP is prioritising all project proposals<br />
received from Approved Organisations (AO). All proposals submitted<br />
to ARTA are first ranked to create a list of activities in priority order<br />
within each GPS activity class. This allows funding to be allocated to<br />
the highest priority activities in times when funding is limited.<br />
The profiling process is carried out by ARTA staff who have the<br />
necessary skills and experience having produced the last three<br />
<strong>Auckland</strong> <strong>Land</strong> <strong>Transport</strong> <strong>Programme</strong>s.<br />
1. Non-discretionary activities<br />
The prioritisation process first extracts the following non-discretionary<br />
activities:<br />
> Maintaining existing public transport services.<br />
> Already committed activities.<br />
> Maintenance and renewals of local roads, State highways and<br />
public transport infrastructure.<br />
ARTA chooses to treat these activities as priorities and essential and<br />
they are therefore funded before all other projects which are<br />
considered discretionary. Historically, the non-discretionary activities<br />
account for approximately two thirds of the total value of the RLTP.<br />
Consequently the prioritisation process described in this section<br />
applies to approximately one third of the value of the programme.<br />
2. Discretionary activities<br />
Next, discretionary activities are categorised according to whether or<br />
not they are able to have a ’generic‘ prioritisation profile applied to<br />
them. Projects which are able to have a ’generic‘ prioritisation profile<br />
applied must be below $4.5m in capital value and are generally<br />
simple, routine types of capital improvement.<br />
Activities which cannot have a generic profile applied to them are<br />
larger and more complex.<br />
2.1 Larger activities<br />
These larger, more complex activities are then ranked based on the<br />
following criteria:<br />
> The seriousness of the issue being addressed.<br />
> The effectiveness of the proposed solution in addressing the issue<br />
identified and in delivering regional/national strategic objectives.<br />
> The economic efficiency (or benefit/cost ratio) of the proposed<br />
solution.<br />
In addition to the above factors, the urgency of a project is also<br />
considered to rank the priority of projects with the same ’Seriousness‘<br />
rating. Urgency is defined by whether there are any external factors<br />
that influence project timing or inter-dependencies with other actions<br />
that make implementation urgent (such as the Rugby World Cup<br />
in 2011).<br />
Each project is rated High, Medium or Low (H, M or L) for each of the<br />
three factors resulting in a profile (e.g. HHM). Each element of the<br />
profiling system is explained in detail below.<br />
2.2 Prioritisation Process<br />
ARTA has developed a methodology, based on the Prioritisation<br />
Process and Assessment Criteria of the ATP for assessing profiles<br />
based on the relationship between the <strong>Regional</strong> Strategic Focus<br />
Areas and the objectives of the RLTS (2005). All improvement<br />
activities being submitted for NZTA subsidy through ARTA need to<br />
be profiled in order to determine the activity’s priority and allocate<br />
available funding accordingly.<br />
The profiling process<br />
An activity’s profile consists of giving a High, Medium, or Low rating<br />
to each of the following three factors:<br />
Seriousness (of the issue being addressed) – refers to the scale<br />
and importance of the transport problem to which the project/activity<br />
or package responds.<br />
Effectiveness (of the proposed solution) – refers to the extent to<br />
which the solution (the package or project/activity) contributes to<br />
addressing the issue being addressed and the broad policy objectives<br />
set out in the RLTS (2005) and ARTA’s statutory objectives; and<br />
Efficiency (of the proposed solution) – the efficiency of an activity<br />
is based on its benefit/cost ratio (BCR). In calculating the BCR,<br />
sensitivity analysis of the key BCR drivers should be undertaken, and<br />
consideration given to including all benefits and costs such as urban<br />
design outcomes. The economic efficiency of an activity does not<br />
necessarily have to be based on the BCR even though it almost always<br />
is the case for roading improvement schemes.<br />
Because the factors named above are given equal weighting, the<br />
outcomes can result in activity profiles with the same Seriousness<br />
rating. In such cases, the urgency of a project will be considered in<br />
order to further rank the priority of projects with the same<br />
Seriousness rating.<br />
Urgency – allows for the incorporation of any external factors that<br />
influence the timing of implementation.<br />
The last part of profiling considers the activity’s contribution to the<br />
strategic balance of the <strong>Auckland</strong> <strong>Transport</strong> Plan. This factor allows a<br />
structured judgement to be applied to ensure that the overall shape<br />
of the <strong>Auckland</strong> <strong>Transport</strong> Plan is acceptable, recognises the modal<br />
shares and outcomes indicated in the RLTS (2005), and takes account<br />
of broader considerations (including the impacts desired by the GPS<br />
(<strong>2009</strong>) that might influence the priority and timing of regional<br />
projects and packages.<br />
79
The prioritisation principles<br />
Seriousness<br />
Seriousness considers the scale and importance of the transport<br />
problem to which the activity, projects or package responds as<br />
assessed against the key challenges identified in the Table 1 below<br />
(developed through the <strong>Auckland</strong> <strong>Transport</strong> Plan).<br />
The first step towards assessing the Seriousness rating of a project<br />
is to identify the main issues each project is aimed at addressing<br />
and assess these issues against the challenges identified in Table 1.<br />
A High, Medium or Low (H, M, L) rating is then allocated to each of<br />
the challenges in Table 1 for the project being assessed.<br />
All activities start with a default Low rating against each challenge<br />
listed in Table 1 below.<br />
> A High rating for any challenge can be obtained if the project<br />
matches the principles listed below for that challenge.<br />
> If the project is part way towards any of the challenges listed<br />
below then a Medium rating is used for that challenge.<br />
The second step is then to allocate an overall rating for the<br />
Seriousness factor.<br />
> An overall High rating for the Seriousness factor only requires a<br />
High against one challenge.<br />
> A Medium rating requires one Medium.<br />
Table 1: Seriousness<br />
Seriousness: The scale and importance of the transport problem to which the project/activity or package responds.<br />
Strategic Focus Area<br />
Note: Further information<br />
on the five Strategic<br />
Focus Areas can be found<br />
in Chapter 4<br />
Challenges<br />
Prioritisation principles<br />
SFA 1, 2, 4<br />
Encouraging and<br />
facilitating economic<br />
development<br />
><br />
Priority to projects which support increased economic productivity, including<br />
intensification of employment, economic clusters, and effective heavy goods<br />
vehicle access.<br />
><br />
Improving accessibility to areas of intensified economic activity, including visitor<br />
concentrations.<br />
><br />
Priority to projects which support regionally agreed areas of new business activity.<br />
><br />
Priority will be given to those parts of the strategic and arterial network where limited<br />
alternative routes exist for accommodating growth.<br />
><br />
<strong>Transport</strong> requirements to facilitate urban growth strategies, including lead<br />
infrastructure and services.<br />
SFA 1, 2, 3<br />
Minimising the impact<br />
of congestion and<br />
unreliable travel times<br />
><br />
Highest priority will be given to addressing congestion which impacts on freight and<br />
commercial traffic movements, and all-day congestion that constrains business and<br />
community development.<br />
><br />
Priority will be given to reducing congestion that impacts on the safe and efficient<br />
operation of strategic corridors and the needs of inter-regional travel will receive a<br />
high priority.<br />
><br />
Congestion that impacts travel to and from vital economic growth centres and<br />
markets will receive a high priority.<br />
><br />
Priority will be given to reducing congestion which impacts on passenger transport<br />
and improving passenger transport travel times.<br />
><br />
Other solutions to commuter peak travel congestion will be accorded a high priority<br />
where a viable sustainable transport alternative, or only a partial solution, is unavailable.<br />
SFA 1, 2, 3, 4<br />
Optimising use of<br />
the existing<br />
transport system<br />
><br />
Priority will be given to strategies aimed at Travel Demand Management, traffic<br />
management, traffic light optimisation and road access control.<br />
SFA 4<br />
Ensuring integrated<br />
land use and transport<br />
provision to enhance<br />
regional growth<br />
><br />
The <strong>Regional</strong> Growth Strategy (RGS) growth concept, will be a key determinant in<br />
deciding priorities for investment in transport, with particular emphasis on:<br />
> Encouraging higher-density development and employment in growth nodes<br />
and corridors.<br />
><br />
Investment in alternative and active modes to support higher-density development<br />
in towns and sub-regional centres.<br />
><br />
Ensuring that land use patterns are consistent with the RPS and RGS.<br />
><br />
An integrated transport system.<br />
80<br />
><br />
Priority will be given to projects that help to achieve a better balance between<br />
employment, education and residential locations, and to projects that reduce the need<br />
to travel.
Strategic Focus Area<br />
Note: Further information<br />
on the five Strategic<br />
Focus Areas can be found<br />
in Chapter 4<br />
Challenges<br />
Prioritisation principles<br />
SFA 5<br />
Providing a<br />
transport system<br />
that is safe to use<br />
><br />
Provision of alternative/additional capacity required in the event of critical failures on<br />
the network will be given priority to ensure security of the transport network in the<br />
event of emergencies.<br />
><br />
Areas with demonstrated safety problems (both current and potential) will be<br />
addressed first (i.e. accident black-spots, recognised unsafe sites, etc).<br />
><br />
Safety improvements for vulnerable users will be given a high priority.<br />
><br />
Priority will be given to responding to perceived personal security risk issues where this<br />
is likely to restrict use of alternatives in favour of the private car.<br />
><br />
Priority will be given to solutions which incorporate positive urban design outcomes.<br />
SFA 2, 3, 4<br />
Increasing travel<br />
choices and<br />
reducing reliance<br />
on private cars<br />
><br />
><br />
Highest priority will be given to the needs of those travelling to employment,<br />
education centres and vital social services.<br />
Priority will be given to parts of the network with poor linkages and a lack of<br />
integration between modes.<br />
><br />
Ensuring viable alternative transport choices to and within town centres will be<br />
a priority.<br />
><br />
Priority will be accorded to the provision of transport choices in growing communities<br />
where existing transport choices are limited.<br />
><br />
Priority will be accorded to providing transport mode choice in areas of high social<br />
deprivation and to the transport-disadvantaged.<br />
><br />
Priority will be given to solutions which avoid or improve community severance.<br />
SFA 3, 4<br />
Promoting<br />
environmental<br />
sustainability<br />
><br />
><br />
Priority will be given to reducing dependence on non-renewable resources (including<br />
fuel, land and aggregate).<br />
Reductions in fuel use and CO 2 emissions will be prioritised.<br />
><br />
Priority will be given to addressing transport-related water quality issues in<br />
sensitive catchments.<br />
><br />
Priority will be given to addressing transport-related community dislocation in areas<br />
where this is significant.<br />
SFA 3, 4<br />
Promoting public<br />
health outcomes<br />
><br />
Priority will be given to addressing air emissions from vehicles in areas with high<br />
population exposure.<br />
><br />
Priority will be given to addressing noise and vibration in areas with high<br />
residential exposure.<br />
><br />
Priority will be given to those parts of the region where low participation in active<br />
modes is likely to result in health problems.<br />
Urgency: allowing the incorporation of any external factors that influence the timing of implementation.<br />
Does the project have particular timing or inter-dependencies with other actions that make its implementation urgent, such as:<br />
><br />
><br />
><br />
><br />
The potential failure of critical infrastructure.<br />
The potential foreclosing of significant future economic development or transport opportunities if action is not taken.<br />
The need for completion in time for specific events of regional or national significance, particularly the Rugby World Cup 2011.<br />
The need for the project as a prerequisite for other high-priority activities (for example advance land purchase).<br />
81
Effectiveness<br />
Effectiveness is the extent to which the proposed activity or package<br />
contributes to the broad policy objectives set out in the RLTS, ARTA’s<br />
statutory objectives.<br />
The second step is then to allocate an overall rating for the<br />
Effectiveness factor.<br />
> An overall High rating for the Effectiveness factor only requires a<br />
High against one objective.<br />
All activities start with a default Low rating against each objective<br />
listed in Table 2 below.<br />
><br />
A Medium rating requires one Medium.<br />
><br />
><br />
A High rating for any objective can be obtained if the project<br />
matches the principles listed below for that objective.<br />
If the project is part way towards any of the objectives listed<br />
below then a Medium rating is used for that objective.<br />
Table 2: Effectiveness<br />
Effectiveness: the extent to which the solution (the package or project/activity) contributes to the issue being addressed and the broad policy<br />
objectives set out in the GPS, RLTS and ARTA’s statutory objectives.<br />
Objective<br />
Assessment criteria<br />
Economic development<br />
Integration of transport,<br />
networks, services and<br />
land use<br />
Impact on sustainability<br />
of transport network<br />
Contribution to the<br />
<strong>Regional</strong> Growth Strategy<br />
Safety and personal<br />
security<br />
Access and mobility<br />
Environmental<br />
sustainability<br />
Public health<br />
><br />
><br />
><br />
><br />
><br />
><br />
><br />
><br />
><br />
><br />
><br />
><br />
><br />
><br />
><br />
><br />
><br />
><br />
><br />
><br />
><br />
How effective is the project in reducing travel time variability for freight movement between key<br />
economic hubs?<br />
To what extent will the project encourage shorter journeys that deliver economic advantages?<br />
To what extent does the project have the potential to unlock private sector investment and<br />
development benefits?<br />
How effective is the project in contributing to a transport network that integrates all modes?<br />
How effective is the project in increasing the choice of mode?<br />
How effective is the project in retaining benefits over time?<br />
To what extent does the project have an impact on other parts of the transport network?<br />
To what extent does the project actively support the RPS and RGS growth concept, including centre<br />
intensification and/or high-density corridors?<br />
To what extent will the project reduce crashes?<br />
How effective is the project in improving the safety and personal security of vulnerable transport?<br />
To what extent will the project improve the transport choices available?<br />
How effective is the project in improving access to appropriate transport for vulnerable users, the transportdisadvantaged<br />
and their caregivers?<br />
To what extent does the project remove barriers to people’s ability to access opportunities for work,<br />
education, health and social services (especially the transport-disadvantaged)?<br />
To what extent will the project reduce reliance on non-renewable resources?<br />
To what extent will the project improve fuel efficiency?<br />
How effective is the project in reducing adverse water quality impacts?<br />
To what extent does the project avoid environmental damage and reduce the adverse impacts of transport<br />
on the natural and physical environment?<br />
To what extent does the project reduce community dislocation?<br />
How effective is the project in increasing the use of active modes?<br />
How effective is the project in reducing harmful air emissions?<br />
How effective is the project in reducing traffic noise and vibration?<br />
82
Strategic Balance: a factor that allows a structured judgement to be applied to ensure that the overall shape of the <strong>Auckland</strong> <strong>Transport</strong> Plan<br />
is acceptable, recognises the modal shares and outcomes indicated in the RLTS, and takes account of broader considerations (including national<br />
issues) that might influence the priority and timing of projects and packages.<br />
The balance of projects and packages in the ATP will seek to enable:<br />
><br />
><br />
><br />
><br />
><br />
><br />
><br />
><br />
><br />
><br />
><br />
><br />
><br />
><br />
><br />
The achievement of the Government Policy Statement targets.<br />
Achievement of the expected outcomes of the RLTS.<br />
The general allocation of transport resources in accordance with the RLTS.<br />
An overall plan that builds for the future.<br />
Projects that contribute to an integrated solution, including the completion of a network.<br />
The best use of existing transport assets.<br />
Strong network resilience and reduced risk of network failure, with a particular focus on lifelines, civil emergencies and civil defence<br />
evacuation procedures.<br />
Options to be kept open for the future, and not foreclosing on opportunities (including corridor protection and advance land purchase).<br />
Taking proactive actions early to influence future demand in a more sustainable way, or avoid future problems (for example early introduction<br />
of passenger transport to newly developing areas).<br />
Sufficient flexibility in the programme to enable other projects to be advanced when projects encounter implementation problems.<br />
Fundability (i.e. local share, and the ability to gain funding from other sources).<br />
Affordability of the programme as a whole, recognising available resources and contingency planning.<br />
A reasonable balance between rural and urban requirements.<br />
Community aspirations to be met through an equitable balance of transport resources, and opportunities between different communities<br />
and socio-economic groups.<br />
Risks to be appropriately managed.<br />
Efficiency<br />
Efficiency (of the proposed solution)<br />
The Efficiency of an activity is based on its benefit/cost ratio. In<br />
calculating the BCR, sensitivity analysis of the key BCR drivers should<br />
be undertaken, and consideration given to including all benefits and<br />
costs such as agglomeration impacts, enhanced land use outcomes<br />
and positive urban design outcomes. The economic efficiency of an<br />
activity does not necessarily have to be based on the BCR even though<br />
it almost always is the case for roading improvement schemes.<br />
It is reported in LTP Online to one decimal place. At time of writing,<br />
the profile relationship for the Efficiency is:<br />
> High: BCR ≥ 4.0<br />
> Medium: 2.0 ≤ BCR < 4.0<br />
> Low: 1.0 ≤ BCR < 2.0<br />
Where no details on the Efficiency of a project are known at the RLTP<br />
stage, then a low value is given to the project and a dashed line<br />
shown in the table in Section 10.<br />
2.3 Generic projects<br />
Projects which are below $4.5 million in capital value and are generally<br />
simple, routine types of capital improvement are categorised as<br />
‘generic’ for profiling purposes.<br />
The profiles for these schemes have been developed and refined by<br />
NZTA over the last few years and are applied uniformly across the<br />
country. ARTA has amended the profile for public transport<br />
infrastructure to be higher than the NZTA profile to take account of<br />
greater importance of public transport in addressing <strong>Auckland</strong>’s<br />
transport issues given the larger size, faster growth and higher levels<br />
of congestion in <strong>Auckland</strong> relative to other regions.<br />
In light of the changes in emphasis in the <strong>2009</strong> GPS, ARTA has<br />
considered whether it is necessary to alter our generic profiles. ARTA<br />
believes it is not necessary to change the profiles as public transport<br />
and walking and cycling are able to make significant contributions to<br />
decongesting routes in heavily populated areas with high congestion<br />
levels such as the <strong>Auckland</strong> region, which will improve journey<br />
reliability for freight and other economically valuable trips. The<br />
ranking of projects in the same profile group has altered to be<br />
consistent with the <strong>2009</strong> GPS, this is discussed in 2.4 on page 85.<br />
83
Table 3 below shows the generic profiles for Seriousness and Effectiveness. The Efficiency of each activity is assessed separately.<br />
Table 3: NZTA and ARTA generic profiles for Seriousness and Effectiveness<br />
Generic project description<br />
NZTA standard<br />
profile<br />
ARTA profile<br />
Traffic management: network efficiency MH MH<br />
Effluent disposal facilities MM MM<br />
Bridge renewals: structural, seismic strengthening – safety HM HM<br />
Replacement of bridges: Route efficiency MM MM<br />
New roads and bridges: Safety HM HM<br />
New roads and bridges: Route efficiency LM LM<br />
Road reconstruction: Route efficiency improvements at intersections or along routes LM LM<br />
Road reconstruction: Passing lanes HM HM<br />
Road reconstruction: Rural realignment (travel time) LM LM<br />
Road reconstruction: Rural realignment (safety) HM HM<br />
Road reconstruction: Safety improvements at intersections/along urban routes HM HM<br />
Road reconstruction: Safety retro-fitting HM HM<br />
Road reconstruction: Seismic retro-fitting MM<br />
Road reconstruction: Street lighting improvements HM HM<br />
Road reconstruction: Pavement smoothing LM LM<br />
Seal extensions:<br />
> Community benefits<br />
MM MM<br />
> User benefits<br />
LM LM<br />
Advanced property purchase: Safety HM HM<br />
Advanced property purchase: Route efficiency LM LM<br />
Advanced property purchase: Alternative modes HM HM<br />
Purpose-built walking or cycling facilities HM HM<br />
Improvements to existing mixed walking or cycling networks HM HM<br />
Passenger transport infrastructure improvements HM HH<br />
Preventive maintenance MM MH<br />
Note: NZTA is considering up-dating its generic profiles and it is likely that ARTA will also update the generic profiles in the near future, however, the above profiles are<br />
current at the time of the evaluation of the RLTP.<br />
84
2.4 Ranking schemes<br />
Finally, in order to prioritise projects with the same profile, a points<br />
system is used. Projects which align with the ‘Strategic Focus Areas’<br />
stated in Chapter 4 – Statement of Priorities, are awarded points.<br />
Focus Area 1 – Greater focus on regional arterial roads, which is<br />
considered of highest importance is awarded 5 points, Focus Area 2<br />
– Greater focus on safety engineering for streets and roads is awarded<br />
4 points and so on. In addition, if a project aligns with the short-term<br />
challenges as stated in Chapter 4 a further point is awarded<br />
It is important to note that GPS impacts are explicitly taken account<br />
of in the prioritisation process via the Strategic Focus Areas, and the<br />
Seriousness challenges and Effectiveness objectives.<br />
Finally, all points are added up and the projects with the highest<br />
number of points are ranked higher in the priority list than lower<br />
scoring projects.<br />
Figure 1 summarises the prioritisation process.<br />
Figure 1: Prioritisation process<br />
Activity<br />
submitted<br />
No<br />
Discretionary<br />
activity?<br />
Yes<br />
No<br />
Committed<br />
activity?<br />
Yes<br />
No<br />
Generic<br />
activity?<br />
Yes<br />
• Profile Seriousness and<br />
Effectiveness as ‘high’<br />
for all activities<br />
• Rank above<br />
discretionary activities<br />
Rank above<br />
discretionary<br />
activities<br />
Profile Seriousness,<br />
Urgency and<br />
Effectiveness<br />
Generic profile<br />
Seriousness and<br />
Effectiveness<br />
Profile Efficiency<br />
Rank activities with same<br />
profile based on:<br />
• Strategic balance<br />
• Short-term challenges<br />
• Strategic focus areas<br />
(include GPS)<br />
85
GLOSSARY<br />
ARLTP<br />
ARC<br />
ARTA<br />
ATP<br />
GPS<br />
NZTS<br />
NZTA<br />
NZTA HNO<br />
<strong>Auckland</strong> <strong>Regional</strong> <strong>Land</strong> <strong>Transport</strong> <strong>Programme</strong><br />
<strong>Auckland</strong> <strong>Regional</strong> Council<br />
<strong>Auckland</strong> <strong>Regional</strong> <strong>Transport</strong> Authority<br />
<strong>Auckland</strong> <strong>Transport</strong> Plan<br />
Government Policy Statement<br />
New Zealand <strong>Transport</strong> Strategy<br />
New Zealand <strong>Transport</strong> Agency (formerly <strong>Land</strong> <strong>Transport</strong> NZ)<br />
New Zealand <strong>Transport</strong> Agency Highways and Network and Operations (formerly Transit NZ) responsible for State highways<br />
LGAAA Local Government (<strong>Auckland</strong>) Amendment Act 2004<br />
LTCCP<br />
Long Term Council Community Plan<br />
LTMA <strong>Land</strong> <strong>Transport</strong> Management Act 2003<br />
RLTP<br />
NLTF<br />
NLTP<br />
PTNP<br />
RLTS<br />
RTPIS<br />
<strong>Regional</strong> <strong>Land</strong> <strong>Transport</strong> <strong>Programme</strong><br />
National <strong>Land</strong> <strong>Transport</strong> Fund<br />
National <strong>Land</strong> <strong>Transport</strong> <strong>Programme</strong><br />
Passenger <strong>Transport</strong> Network Plan<br />
<strong>Regional</strong> <strong>Land</strong> <strong>Transport</strong> Strategy<br />
Real Time Passenger Information System<br />
Useful websites:<br />
<strong>Auckland</strong> <strong>Regional</strong> Council<br />
<strong>Auckland</strong> <strong>Regional</strong> <strong>Transport</strong> Authority<br />
New Zealand <strong>Transport</strong> Agency<br />
KiwiRail<br />
RoadSafe <strong>Auckland</strong><br />
<strong>Auckland</strong> City Council<br />
Franklin District Council<br />
Manukau City Council<br />
North Shore City Council<br />
Papakura District Council<br />
Rodney District Council<br />
Waitakere City Council<br />
www.arc.govt.nz<br />
www.arta.co.nz<br />
www.nzta.govt.nz<br />
www.kiwirail.govt.nz<br />
www.roadsafeauckland.org.nz<br />
www.aucklandcity.govt.nz<br />
www.franklin.govt.nz<br />
www.manukau.govt.nz<br />
www.northshorecity.govt.nz<br />
www.pdc.govt.nz<br />
www.rodney.govt.nz<br />
www.waitakere.govt.nz<br />
86
ARTA’S MISSION:<br />
“TO DELIVER A WORLD-CLASS TRANSPORT SYSTEM<br />
THAT MAKES AUCKLAND AN EVEN BETTER PLACE<br />
TO LIVE, WORK AND PLAY.”