Use of an amorphous silicon electronic portal imaging device for ...
Use of an amorphous silicon electronic portal imaging device for ...
Use of an amorphous silicon electronic portal imaging device for ...

Create successful ePaper yourself
Turn your PDF publications into a flip-book with our unique Google optimized e-Paper software.
Home Search Collections Journals About Contact us My IOPscience<br />
<strong>Use</strong> <strong>of</strong> <strong>an</strong> <strong>amorphous</strong> <strong>silicon</strong> <strong>electronic</strong> <strong>portal</strong> <strong>imaging</strong> <strong>device</strong> <strong>for</strong> multileaf collimator quality<br />
control <strong>an</strong>d calibration<br />
This article has been downloaded from IOPscience. Please scroll down to see the full text article.<br />
2005 Phys. Med. Biol. 50 1377<br />
(http://iopscience.iop.org/0031-9155/50/7/003)<br />
View the table <strong>of</strong> contents <strong>for</strong> this issue, or go to the journal homepage <strong>for</strong> more<br />
Download details:<br />
IP Address: 152.92.171.92<br />
The article was downloaded on 08/10/2010 at 20:20<br />
Please note that terms <strong>an</strong>d conditions apply.
INSTITUTE OF PHYSICS PUBLISHING<br />
Phys. Med. Biol. 50 (2005) 1377–1392<br />
PHYSICS IN MEDICINE AND BIOLOGY<br />
doi:10.1088/0031-9155/50/7/003<br />
<strong>Use</strong> <strong>of</strong> <strong>an</strong> <strong>amorphous</strong> <strong>silicon</strong> <strong>electronic</strong> <strong>portal</strong> <strong>imaging</strong><br />
<strong>device</strong> <strong>for</strong> multileaf collimator quality control <strong>an</strong>d<br />
calibration<br />
S J K Baker, G J Budgell <strong>an</strong>d R I MacKay<br />
North Western Medical Physics, Christie Hospital NHS Trust, M<strong>an</strong>chester M20 4BX, UK<br />
E-mail: sally.baker@physics.cr.m<strong>an</strong>.ac.uk<br />
Received 19 October 2004, in final <strong>for</strong>m 6 J<strong>an</strong>uary 2005<br />
Published 16 March 2005<br />
Online at stacks.iop.org/PMB/50/1377<br />
Abstract<br />
Multileaf collimator (MLC) calibration <strong>an</strong>d quality control is a time-consuming<br />
procedure typically involving the processing, sc<strong>an</strong>ning <strong>an</strong>d <strong>an</strong>alysis <strong>of</strong> films<br />
to measure leaf <strong>an</strong>d collimator positions. Faster <strong>an</strong>d more reliable calibration<br />
procedures are required <strong>for</strong> these tasks, especially with the introduction <strong>of</strong><br />
intensity modulated radiotherapy which requires more frequent checking <strong>an</strong>d<br />
finer positional leaf toler<strong>an</strong>ces th<strong>an</strong> previously. A routine quality control (QC)<br />
technique to measure MLC leaf b<strong>an</strong>k gain <strong>an</strong>d <strong>of</strong>fset, as well as minor <strong>of</strong>fsets<br />
(individual leaf position relative to a reference leaf), using <strong>an</strong> <strong>amorphous</strong> <strong>silicon</strong><br />
<strong>electronic</strong> <strong>portal</strong> <strong>imaging</strong> <strong>device</strong> (EPID) has been developed. The technique<br />
also tests the calibration <strong>of</strong> the primary <strong>an</strong>d back-up collimators. A detailed<br />
comparison between film <strong>an</strong>d EPID measurements has been per<strong>for</strong>med <strong>for</strong> six<br />
linear accelerators (linacs) equipped with MLC <strong>an</strong>d <strong>amorphous</strong> <strong>silicon</strong> EPIDs.<br />
Measurements <strong>of</strong> field size from 4 to 24 cm with the EPID were systematically<br />
smaller th<strong>an</strong> film measurements over all field sizes by 0.4 mm <strong>for</strong> leaves/backup<br />
collimators <strong>an</strong>d by 0.2 mm <strong>for</strong> conventional collimators. This effect is due to<br />
the gain calibration correction applied by the EPID, resulting in a ‘flattening’ <strong>of</strong><br />
primary beam pr<strong>of</strong>iles. Linac dependent systematic differences <strong>of</strong> up to 0.5 mm<br />
in individual leaf/collimator positions were also found between EPID <strong>an</strong>d film<br />
measurements due to the difference between the mech<strong>an</strong>ical <strong>an</strong>d radiation axes<br />
<strong>of</strong> rotation. When corrections <strong>for</strong> these systematic differences were applied,<br />
the residual r<strong>an</strong>dom differences between EPID <strong>an</strong>d film were 0.23 mm <strong>an</strong>d<br />
0.26 mm (1 st<strong>an</strong>dard deviation) <strong>for</strong> field size <strong>an</strong>d individual leaf/back-up<br />
collimator position, respectively. Measured gains (over a dist<strong>an</strong>ce <strong>of</strong> 220 mm)<br />
always agreed within 0.4 mm with a st<strong>an</strong>dard deviation <strong>of</strong> 0.17 mm. Minor<br />
<strong>of</strong>fset measurements gave a me<strong>an</strong> agreement between EPID <strong>an</strong>d film <strong>of</strong><br />
0.01 ± 0.10 mm (1 st<strong>an</strong>dard deviation) after correction <strong>for</strong> the tilt <strong>of</strong> the<br />
EPID <strong>an</strong>d small rotational misalignments between leaf b<strong>an</strong>ks <strong>an</strong>d the backup<br />
collimators used as a reference straight edge. Reproducibility <strong>of</strong> EPID<br />
measurements was found to be very high, with a st<strong>an</strong>dard deviation <strong>of</strong><br />
0031-9155/05/071377+16$30.00 © 2005 IOP Publishing Ltd Printed in the UK 1377
1378 S J K Baker et al<br />
MLC QC with <strong>an</strong> <strong>amorphous</strong> <strong>silicon</strong> EPID 1379<br />
higher precision on the measurements should be obtainable. EPIDs have been used as a tool<br />
<strong>for</strong> verifying the position <strong>of</strong> individual MLC leaf positions, both <strong>for</strong> QC <strong>an</strong>d verification <strong>of</strong><br />
clinical MLC fields (Eilertsen 1997, James et al 2000, Sam<strong>an</strong>t et al 2002).<br />
The commercial introduction <strong>of</strong> <strong>amorphous</strong> <strong>silicon</strong> EPIDs provides a tool ideally suited<br />
to QC applications. This new design <strong>of</strong> EPID provides a geometrically stable, undistorted,<br />
high-resolution image, which ought to allow more accurate measurements <strong>of</strong> x-ray field size<br />
th<strong>an</strong> ever be<strong>for</strong>e. In this paper, the use <strong>of</strong> <strong>an</strong> <strong>amorphous</strong> <strong>silicon</strong> EPID to obtain QC <strong>an</strong>d<br />
calibration measurements <strong>for</strong> minor <strong>of</strong>fsets <strong>of</strong> individual MLC leaves, major <strong>of</strong>fsets <strong>an</strong>d gain<br />
<strong>of</strong> leaf b<strong>an</strong>ks, <strong>an</strong>d <strong>of</strong>fset <strong>an</strong>d gain measurements <strong>for</strong> primary <strong>an</strong>d secondary collimators is<br />
described. Comparisons between the results obtained with the EPID <strong>an</strong>d with film are made<br />
in order to assess inherent differences <strong>an</strong>d accuracy. The reproducibility <strong>an</strong>d precision <strong>of</strong> the<br />
results obtained using the EPID are measured. The implementation <strong>of</strong> the s<strong>of</strong>tware <strong>for</strong> routine<br />
QC in a department with six EPIDs <strong>an</strong>d MLCs <strong>of</strong> this type is discussed.<br />
2. Methods<br />
A series <strong>of</strong> prescriptions were created in order to cover all aspects <strong>of</strong> calibration <strong>of</strong> the MLC<br />
<strong>an</strong>d the primary/secondary collimators. In each case, the prescriptions were delivered both to<br />
the EPID <strong>an</strong>d to films. Images were exported from the EPID acquisition s<strong>of</strong>tware <strong>an</strong>d <strong>an</strong>alysed<br />
<strong>of</strong>fline using s<strong>of</strong>tware developed <strong>for</strong> the purpose. The films were sc<strong>an</strong>ned <strong>an</strong>d <strong>an</strong>alysed, then<br />
the results compared with those from the EPID. Each aspect <strong>of</strong> this methodology is discussed<br />
in detail below.<br />
2.1. Description <strong>of</strong> MLC <strong>an</strong>d EPID<br />
This work was carried out using six Elekta Precise linear accelerators (Elekta Oncology<br />
Systems, Crawley, UK) at this institution, each equipped with <strong>an</strong> MLC <strong>an</strong>d iViewGT EPID.<br />
A full description <strong>of</strong> the MLCs c<strong>an</strong> be found in Jord<strong>an</strong> <strong>an</strong>d Williams (1994). The EPIDs<br />
are <strong>amorphous</strong> <strong>silicon</strong> (a-Si) flat-p<strong>an</strong>el detectors. The a-Si array is 41 × 41 cm 2 (1024 ×<br />
1024 pixels). Each pixel corresponds to close to 0.25 mm square at isocentre, thus enabling<br />
a comparatively high image resolution. The EPIDs are geometrically stable, with a high<br />
positional reproducibility centred relative to the treatment head <strong>an</strong>d are mounted at about<br />
160 cm FSD. The dosimetric response has been shown (McCurdy et al 2001) to be nearlinear,<br />
enabling relative dosimetry within each image. The images are 16-bit grey-level<br />
depth, giving high contrast in<strong>for</strong>mation, particularly import<strong>an</strong>t when <strong>imaging</strong> pr<strong>of</strong>iles <strong>an</strong>d<br />
beam penumbra. The default image processing s<strong>of</strong>tware per<strong>for</strong>med is a bad pixel correction,<br />
<strong>of</strong>fset (dark current) correction, gain (flat-field) correction, pixel value renormalization, pulse<br />
artefact removal, optional greyscale inversion <strong>an</strong>d rotation through 90 ◦ .<br />
2.2. Characterization <strong>of</strong> EPID<br />
In order to use EPID images as a substitute <strong>for</strong> films, it was necessary to establish certain<br />
properties <strong>of</strong> the EPID images, namely dosimetric linearity <strong>an</strong>d pixel size. The greyscale dose<br />
linearity needs to be known in order to correctly detect the field edge, which is defined as 50%<br />
<strong>of</strong> the central axis dose. This property was investigated in two ways. Firstly, by acquiring<br />
images <strong>of</strong> a 10 × 10 cm 2 field <strong>for</strong> differing numbers <strong>of</strong> monitor units (MU), correcting <strong>for</strong> the<br />
effects <strong>of</strong> image normalization <strong>an</strong>d greyscale, <strong>an</strong>d plotting dose versus greyscale. Secondly,<br />
to check the dose linearity within a single image (which is the actual situation <strong>for</strong> detecting<br />
field edges), <strong>an</strong> ionization chamber was moved incrementally across a wedged field, <strong>an</strong>d the<br />
readings were compared with the grey level on the image at the corresponding positions.
1380 S J K Baker et al<br />
The pixel size needs to be known accurately in order to convert number <strong>of</strong> pixels into<br />
absolute dist<strong>an</strong>ce. The pixel size at isocentre was measured <strong>for</strong> each EPID using a grid<br />
ph<strong>an</strong>tom placed at isocentre, consisting <strong>of</strong> thin lead wires laid out to define 4 cm squares,<br />
mounted on backing material (Kirby 1995). Measurements were made to the nearest tenth<br />
<strong>of</strong> a millimetre between specific points on the ph<strong>an</strong>tom using the longest dist<strong>an</strong>ces possible<br />
(around 24 cm) to maximize accuracy. Images <strong>of</strong> the ph<strong>an</strong>tom were used to obtain numbers<br />
<strong>of</strong> pixels corresponding to measured dist<strong>an</strong>ces. The measurements were made <strong>for</strong> multiple<br />
lines, both in-pl<strong>an</strong>e <strong>an</strong>d cross-pl<strong>an</strong>e, <strong>an</strong>d averaged to determine the pixel size to <strong>an</strong> accuracy<br />
<strong>of</strong> four decimal places. The measurements were repeated after <strong>an</strong> interval <strong>of</strong> two years to test<br />
the stability <strong>of</strong> the pixel size calibration.<br />
2.3. Prescriptions<br />
The detector on the EPID projects to only 26 × 26 cm 2 at isocentre. Thus all 40 1-cm-thick<br />
leaves in each leaf b<strong>an</strong>k c<strong>an</strong>not be imaged simult<strong>an</strong>eously. A series <strong>of</strong> prescriptions were thus<br />
created to fit inside the EPID field <strong>of</strong> view, with the EPID in the central rest position whenever<br />
possible. An exposure <strong>of</strong> 40 monitor units was used <strong>for</strong> each prescription since this is known<br />
to give suitable optical density on film <strong>for</strong> our processor.<br />
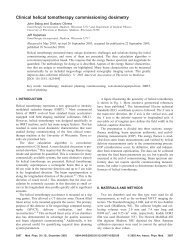
For minor <strong>of</strong>fset measurements, it was necessary to divide the field into two overlapping<br />
halves; leaves 1–24 <strong>an</strong>d leaves 17–40. The field width was chosen to be 10 cm, with the leaf<br />
b<strong>an</strong>k at 10 cm <strong>an</strong>d the opposing back-up collimator on the central axis <strong>for</strong>ming <strong>an</strong> opposing<br />
straight edge to the leaf b<strong>an</strong>k relative to which the individual leaf positions c<strong>an</strong> be measured<br />
(figure 1). The EPID had to be <strong>of</strong>fset in order to encompass these prescriptions. Figure 1 also<br />
illustrates the IEC601 collimator labelling convention used throughout this paper.<br />
The major <strong>of</strong>fsets <strong>for</strong> both leaf b<strong>an</strong>ks <strong>an</strong>d collimators are measured using a set <strong>of</strong> square<br />
fields <strong>of</strong> varying size. The fields c<strong>an</strong> be defined in the direction <strong>of</strong> leaf travel by leaves or<br />
back-up collimators, enabling calibration <strong>of</strong> either. In the orthogonal direction, the field is<br />
defined by the primary X collimators. The leaf square fields were defined as 4 × 4cm 2 ,10×<br />
10 cm 2 <strong>an</strong>d 24 × 24 cm 2 , with the back-up collimators pulled back 2 cm behind the leaf b<strong>an</strong>k<br />
to avoid interference with the leaf edge. The collimators-only square fields were defined as<br />
4 × 4cm 2 ,10× 10 cm 2 <strong>an</strong>d 22 × 22 cm 2 , with the leaf b<strong>an</strong>ks pulled back 2 cm behind the<br />
leaf b<strong>an</strong>k to avoid interference with the back-up collimator edge; the reason <strong>for</strong> the smaller<br />
large field (22 × 22 cm 2 ) being that we wished to maintain a 2 cm gap between leaf b<strong>an</strong>k <strong>an</strong>d<br />
collimator but did not w<strong>an</strong>t the sensitive <strong>electronic</strong>s around the detector edge to be shielded by<br />
back-ups only (with 10% tr<strong>an</strong>smission), hence the 24 × 24 cm 2 leaf dimension was maintained<br />
<strong>an</strong>d the back-up collimator dimension reduced.<br />
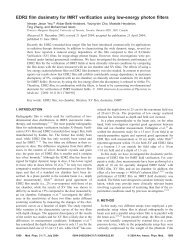
Prescriptions were created <strong>for</strong> measuring gain <strong>for</strong> both Y 1 <strong>an</strong>d Y 2 leaf b<strong>an</strong>ks <strong>an</strong>d back-up<br />
collimators. The central 24 leaves were used <strong>for</strong> <strong>an</strong>alysis. The prescriptions consist <strong>of</strong> two<br />
segments (figure 2); the first segment sets the leaf b<strong>an</strong>k/back-up collimators to define Y 2 to<br />
12 cm <strong>an</strong>d Y 1 to 10 cm to the left <strong>of</strong> the central axis, defining a field which is 2 cm wide <strong>an</strong>d<br />
24 cm long. The second segment has Y 1 positioned at 12 cm <strong>an</strong>d Y 2 at 10 cm to the right <strong>of</strong><br />
the central axis. Gain c<strong>an</strong> be measured from the difference between the measured position <strong>of</strong><br />
each leaf b<strong>an</strong>k/collimator at the two positions: a perfectly calibrated MLC/collimator would<br />
measure a difference <strong>of</strong> 22 cm.<br />
2.4. Acquisition<br />
The EPID was positioned so that the field was totally within the detector region <strong>of</strong> the plate.<br />
The <strong>an</strong>gle <strong>of</strong> the treatment head was adjusted so that the exposed region on the images appeared
MLC QC with <strong>an</strong> <strong>amorphous</strong> <strong>silicon</strong> EPID 1381<br />
Y2<br />
X2<br />
X1<br />
Y1<br />
Y2<br />
X2<br />
X1<br />
Y1<br />
Primary X collimators<br />
Back-up Y collimators<br />
MLC leaves<br />
Figure 1. Positions <strong>of</strong> individual leaves <strong>an</strong>d collimators in the prescriptions used <strong>for</strong> measuring<br />
minor <strong>of</strong>fsets <strong>of</strong> the Y 1 leaf b<strong>an</strong>k. The prescriptions <strong>for</strong> the Y 2 leaf b<strong>an</strong>k are the mirror images <strong>of</strong><br />
these two. The IEC601 collimator labelling convention used throughout this paper is also shown<br />
by this diagram. The Y collimator positions in the prescriptions shown are Y 2 leaf b<strong>an</strong>k: −10.0 cm,<br />
Y 2 back-up collimator: 0.0 cm, Y 1 leaf b<strong>an</strong>k: +10.0 cm, Y 1 back-up collimator: +12.0 cm.<br />
X2<br />
X2<br />
Y2<br />
Y1<br />
Y2<br />
Y1<br />
X1<br />
X1<br />
Figure 2. Positions <strong>of</strong> individual leaves <strong>an</strong>d collimators in the prescriptions used <strong>for</strong> measuring<br />
the leaf b<strong>an</strong>k gains. For measuring back-up collimator gain, the leaf <strong>an</strong>d back-up collimator<br />
positions are reversed. The leaf b<strong>an</strong>k positions in the two prescriptions are Y 2 : −12.0 cm, Y 1 :<br />
−10.0 cm (left-h<strong>an</strong>d diagram) <strong>an</strong>d Y 2 : +10.0 cm, Y 1 : +12.0 cm (right-h<strong>an</strong>d diagram). The back-up<br />
collimators are pulled back 2 cm from the leaves.<br />
parallel to the edges <strong>of</strong> the image. This was quite a sensitive requirement, as deviations from<br />
parallel could be seen, on the image displayed on the iViewGT computer, at head <strong>an</strong>gles <strong>of</strong>
1382 S J K Baker et al<br />
±0.1 ◦ . Exposures were made with 40 monitor units <strong>for</strong> each prescription, which dose gives a<br />
sensible optical dose to the films used <strong>for</strong> comparison. All prescriptions were delivered with<br />
6 MV, the lowest energy on each linac except <strong>for</strong> one machine which had a lowest energy <strong>of</strong><br />
8MV.<br />
Radiographic films (Kodak X-Omat V) were also taken <strong>for</strong> each <strong>of</strong> the calibration<br />
prescriptions. The films were positioned at the isocentre, under 15 mm or 20 mm <strong>of</strong> Perspex<br />
<strong>for</strong> build-up depending on whether the energy was 6 MV or 8 MV. For the minor <strong>of</strong>fset<br />
images, it was imperative that the leaf positioning was the same on the image as the film in<br />
order <strong>for</strong> comparisons to be valid so the films <strong>an</strong>d EPIs were acquired without the leaves being<br />
reset. For the other prescriptions, the films were acquired on the same day as the images,<br />
but not simult<strong>an</strong>eously, so a small error was introduced corresponding to the reproducibility<br />
in positioning <strong>of</strong> the leaf b<strong>an</strong>ks/back-up collimators. The leaf b<strong>an</strong>k reproducibility has been<br />
reported as 0.23 mm (1 st<strong>an</strong>dard deviation) by Jord<strong>an</strong> <strong>an</strong>d Williams (1994); however, the<br />
actual error introduced will be smaller th<strong>an</strong> this since the leaf positions are measured from the<br />
average <strong>of</strong> the central four leaves.<br />
2.5. Image <strong>an</strong>alysis<br />
The programming l<strong>an</strong>guage used <strong>for</strong> image <strong>an</strong>alysis throughout this project was the Interactive<br />
Data L<strong>an</strong>guage (IDL) (Research Systems Inc., Boulder, CO) programming environment as<br />
recommended by Eilertsen (1997).<br />
The approximate edges <strong>of</strong> the field are identified by thresholding with a greyscale known<br />
to be near the field edge in all images. The centre <strong>of</strong> each leaf c<strong>an</strong> then be estimated by<br />
dividing the length <strong>of</strong> the field by the number <strong>of</strong> leaves in the field, <strong>an</strong>d incrementing along<br />
the length. Pr<strong>of</strong>iles are then extracted from the central portion <strong>of</strong> each leaf; this is done to<br />
avoid interleaf leakage regions. Fifteen adjacent pr<strong>of</strong>iles across the leaf centre are averaged to<br />
improve the measurement precision, equating to 3.75 mm <strong>of</strong> the leaf width at isocentre. All<br />
further <strong>an</strong>alysis uses these averaged pr<strong>of</strong>iles.<br />
The position <strong>of</strong> <strong>an</strong> individual leaf edge within a b<strong>an</strong>k <strong>of</strong> leaves c<strong>an</strong> be found at the<br />
point <strong>of</strong> 50% <strong>of</strong> the intensity in the centre <strong>of</strong> the field, found from the average <strong>of</strong> the central<br />
21 pixels (5.25 mm). The intensity along the central axes varies across the image in both x<br />
<strong>an</strong>d y axes, due to the inherent pr<strong>of</strong>ile <strong>of</strong> the radiation beam, there<strong>for</strong>e a central intensity value<br />
was identified <strong>for</strong> each incremental leaf pr<strong>of</strong>ile. The approximate edge values found using<br />
the thresholding method are then used as a starting point <strong>for</strong> the location <strong>of</strong> the field edge. The<br />
s<strong>of</strong>tware loops through 15 pixels (3.75 mm) either side <strong>of</strong> these to find the pixels which have<br />
intensity values closest to either 50% <strong>of</strong> the 100% intensity value in the central region <strong>for</strong> a<br />
leaf b<strong>an</strong>k or the X collimators, or 55% <strong>for</strong> a Y back-up collimator (Jord<strong>an</strong> <strong>an</strong>d Williams 1994).<br />
Linear interpolation between adjacent pixels allows the absolute edge point to be located to<br />
sub-pixel accuracy. The straight-line interpolation is a suitable <strong>an</strong>d accurate approximation,<br />
as the portion <strong>of</strong> the pr<strong>of</strong>ile corresponding to 50% dose has a very steep, near-linear gradient.<br />
The minor <strong>of</strong>fset measurements are made relative to the opposing back-up collimator. To<br />
determine major <strong>of</strong>fsets, the absolute position <strong>of</strong> the field edges relative to the centre <strong>of</strong> the<br />
radiation field must be measured. To achieve this, the prescriptions are imaged twice, once<br />
at a treatment head <strong>an</strong>gle <strong>of</strong> 0 ◦ <strong>an</strong>d once at 180 ◦ . The absolute position <strong>of</strong> each collimator<br />
relative to the radiation axis <strong>of</strong> rotation c<strong>an</strong> then be found as the average dist<strong>an</strong>ce <strong>of</strong> each<br />
specific collimator from the image centre. Major <strong>of</strong>fset leaf b<strong>an</strong>k or collimator positions are<br />
defined as the me<strong>an</strong> <strong>of</strong> the positions measured <strong>for</strong> the central four pr<strong>of</strong>iles, i.e. −15, −5, +5,<br />
+15 mm.
MLC QC with <strong>an</strong> <strong>amorphous</strong> <strong>silicon</strong> EPID 1383<br />
2.6. Film <strong>an</strong>alysis<br />
The films were processed <strong>an</strong>d <strong>an</strong>alysed using a Vidar VX12 sc<strong>an</strong>ner (Vidar Systems<br />
Corporation) <strong>an</strong>d Poseidon s<strong>of</strong>tware version 4.1A (MDS Nordion), in the same m<strong>an</strong>ner as<br />
would normally be per<strong>for</strong>med <strong>for</strong> x-ray field-size checks. The films are sc<strong>an</strong>ned at a resolution<br />
<strong>of</strong> 150 dots per inch, <strong>an</strong>d digitized at a 12-bit greyscale. The field centre is identified as marked<br />
using a cross on the film, the image is then normalized <strong>an</strong>d the background subtracted. Pr<strong>of</strong>iles<br />
are then extracted at 0.2 mm resolution <strong>an</strong>d the positions on the pr<strong>of</strong>ile corresponding to the<br />
optical density measured <strong>for</strong> that batch <strong>of</strong> film <strong>for</strong> 50% dose (or 55% <strong>for</strong> back-up collimators)<br />
are identified as the edge points. Again, the central four leaf pr<strong>of</strong>iles are used to identify the<br />
major <strong>of</strong>fset <strong>for</strong> a leaf b<strong>an</strong>k. The minor <strong>of</strong>fset films were also run through a version <strong>of</strong> the<br />
s<strong>of</strong>tware described above adapted to read in film images <strong>an</strong>d which used calibrated optical<br />
density values <strong>for</strong> 50% <strong>an</strong>d 55%. By using exactly the same s<strong>of</strong>tware, <strong>an</strong>y differences seen<br />
must be due only to inherent differences between film <strong>an</strong>d EPID acquisition, not the <strong>an</strong>alysis<br />
technique.<br />
2.7. Reproducibility <strong>an</strong>d precision<br />
A24× 24 cm 2 field defined by leaves <strong>an</strong>d X collimators was imaged five times in succession,<br />
without resetting the leaf b<strong>an</strong>k positions <strong>an</strong>d without moving the EPID position. The field was<br />
then imaged a further five times, driving the EPID in <strong>an</strong>d out again in between each exposure<br />
to determine the reproducibility <strong>of</strong> EPID centring. The images were <strong>an</strong>alysed using a modified<br />
<strong>for</strong>m <strong>of</strong> the s<strong>of</strong>tware which <strong>an</strong>alyses only one image using <strong>an</strong> arbitrary field centre: this gave<br />
five sets <strong>of</strong> individual leaf b<strong>an</strong>k positions <strong>an</strong>d five sets <strong>of</strong> overall field sizes <strong>for</strong> each <strong>of</strong> the two<br />
experiments. This experiment was repeated on a second linac, this time using a 10 × 10 cm 2<br />
field <strong>an</strong>d repeating each measurement ten times in succession. On the second linac, ten fields<br />
with the leaves <strong>an</strong>d collimators re-positioned in between fields, but with the EPID stationary,<br />
were also imaged <strong>an</strong>d <strong>an</strong>alysed.<br />
3. Results<br />
3.1. Characterization <strong>of</strong> EPID<br />
The grey-level value to dose relationship proved to be near-linear through the y = 0 intercept,<br />
as found by Munro <strong>an</strong>d Bouius (1998) <strong>an</strong>d McCurdy et al (2001). This result was found<br />
both <strong>for</strong> varying numbers <strong>of</strong> MU in different images <strong>an</strong>d <strong>for</strong> studying dose linearity within <strong>an</strong><br />
image. The non-linearities at low dose levels due to image lag <strong>an</strong>d ghosting as reported by<br />
McDermott et al (2004), although observed in our results, will not affect the 50% dose point<br />
<strong>for</strong> the doses used in this study. Moreover, since they are frame-by-frame effects, whereas we<br />
are studying dose linearity within <strong>an</strong> image, they would not affect the 50% field edge.<br />
The pixel size was measured to be between 0.2503 <strong>an</strong>d 0.2510 mm/pixel. The pixel sizes<br />
<strong>of</strong> five EPIDs were re-measured two years later <strong>an</strong>d all five pixel size measurements were<br />
found to be within 0.0002 mm/pixel <strong>of</strong> their previous value; even <strong>for</strong> a p<strong>an</strong>el which had been<br />
replaced. This is to be expected in that the pixel size is mainly dependent upon the height at<br />
which the EPID is initially set when commissioned, which varies slightly from linac to linac.<br />
When a p<strong>an</strong>el is replaced no ch<strong>an</strong>ge is made to the mounting, the replacement p<strong>an</strong>el is simply<br />
slid into place, resulting in no ch<strong>an</strong>ge in p<strong>an</strong>el height or pixel dimension.<br />
3.2. Comparisons <strong>of</strong> EPID against film<br />
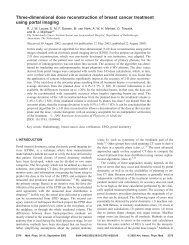
3.2.1. Minor <strong>of</strong>fsets. The results <strong>of</strong> the comparisons between minor <strong>of</strong>fsets measured with<br />
film <strong>an</strong>d EPID are shown in figures 3 <strong>an</strong>d 4. Figure 3(a) shows <strong>an</strong> example set <strong>of</strong> results from
1384 S J K Baker et al<br />
(a)<br />
2<br />
(b)<br />
1<br />
Deviation from leaf 20 (mm)<br />
1.5<br />
1<br />
0.5<br />
0<br />
EPID<br />
-0.5<br />
Film<br />
-1<br />
0 10 20 30 40<br />
Leaf number<br />
Deviation from leaf 20 (mm)<br />
0.5<br />
0<br />
-0.5<br />
EPID<br />
Film<br />
-1<br />
0 10 20 30 40<br />
Leaf number<br />
Figure 3. Minor <strong>of</strong>fset values as found using film <strong>an</strong>d EPID <strong>for</strong> <strong>an</strong> example linac: (a) raw data,<br />
(b) after correction <strong>for</strong> the rotational misalignment <strong>of</strong> MLC <strong>an</strong>d back-up collimator.<br />
(a)<br />
1.0<br />
Y2 leaves<br />
(b)<br />
1.0<br />
Y1 leaves<br />
EPID - film (mm)<br />
0.5<br />
0.0<br />
-0.5<br />
EPID - film (mm)<br />
0.5<br />
0.0<br />
-0.5<br />
-1.0<br />
0 5 10 15 20 25 30 35 40<br />
Leaf number<br />
-1.0<br />
0 5 10 15 20 25 30 35 40<br />
Leaf number<br />
(c)<br />
1.0<br />
(d)<br />
1.0<br />
Y1 leaves<br />
Y1 leaves<br />
EPID - film (mm)<br />
0.5<br />
0.0<br />
-0.5<br />
EPID - film (mm)<br />
0.5<br />
0.0<br />
-0.5<br />
-1.0<br />
0 5 10 15 20 25 30 35 40<br />
Leaf number<br />
-1.0<br />
0 5 10 15 20 25 30 35 40<br />
Leaf number<br />
Figure 4. Difference between individual relative leaf positions (minor <strong>of</strong>fsets) as measured with<br />
EPID <strong>an</strong>d film <strong>for</strong> six linacs <strong>for</strong> (a) the Y 2 leaf b<strong>an</strong>ks, <strong>an</strong>d (b) the Y 1 leaf b<strong>an</strong>ks, (c) <strong>an</strong>d (d) show<br />
the same results after correction <strong>for</strong> EPID tilts.<br />
one leaf b<strong>an</strong>k <strong>for</strong> one linac. The film <strong>an</strong>d EPID results c<strong>an</strong> be seen to clearly follow the same<br />
overall pattern. Unexpectedly, the results do not fluctuate r<strong>an</strong>domly around zero but show a<br />
marked gradient versus leaf position. This result was found to differing extents <strong>for</strong> all six<br />
MLCs. The reason <strong>for</strong> the gradient is that the back-up collimator used as the reference straight<br />
edge is not perfectly rotationally aligned with the MLC. Analysis <strong>of</strong> the different gradients<br />
measured showed rotational misalignments <strong>of</strong> between 0.0 ◦ <strong>an</strong>d 0.6 ◦ ; all but one <strong>of</strong> which<br />
were within the m<strong>an</strong>ufacturer’s 0.5 ◦ toler<strong>an</strong>ce <strong>for</strong> this alignment. A correction c<strong>an</strong> be made
MLC QC with <strong>an</strong> <strong>amorphous</strong> <strong>silicon</strong> EPID 1385<br />
Table 1. Me<strong>an</strong> <strong>an</strong>d st<strong>an</strong>dard deviation <strong>of</strong> the EPID/film differences <strong>for</strong> major <strong>of</strong>fset measurements<br />
both be<strong>for</strong>e <strong>an</strong>d after correction <strong>for</strong> field flattening <strong>an</strong>d mech<strong>an</strong>ical/radiation centre <strong>of</strong> rotation<br />
differences.<br />
Individual leaf b<strong>an</strong>ks/collimator<br />
Overall field size<br />
Film/EPID differences (mm) Leaf b<strong>an</strong>ks Y collimators X collimators Leaf b<strong>an</strong>ks Y collimators X collimators<br />
Be<strong>for</strong>e correction<br />
Me<strong>an</strong> −0.17 −0.19 −0.08 −0.35 −0.40 −0.17<br />
St<strong>an</strong>dard deviation 0.41 0.36 0.47 0.17 0.27 0.25<br />
After correction<br />
Me<strong>an</strong> 0.03 0.01 0.02 0.05 0.00 0.03<br />
St<strong>an</strong>dard deviation 0.26 0.28 0.26 0.17 0.27 0.25<br />
<strong>for</strong> this effect by subtracting the best-fit straight line to the data thus leaving only the residual<br />
minor <strong>of</strong>fsets. The result <strong>of</strong> this operation c<strong>an</strong> be seen in figure 3(b). Clearly, if there is a real<br />
gradient in the minor <strong>of</strong>fsets it would be disguised by this operation. In practice, however, this<br />
is unlikely <strong>an</strong>d could be easily checked <strong>for</strong> by viewing a film or the light field <strong>for</strong> a long thin<br />
MLC only field.<br />
Since both film <strong>an</strong>d EPID measurements include this rotation effect, a clearer way to<br />
compare the two data sets is to subtract the film measurements from the EPID measurements as<br />
shown in figures 4(a) <strong>an</strong>d (b) <strong>for</strong> all six linacs. These diagrams show reasonable correspondence<br />
between film <strong>an</strong>d EPID with me<strong>an</strong> differences (±1 SD)<strong>of</strong>−0.03 ± 0.14 mm <strong>for</strong> the Y 2 leaf<br />
b<strong>an</strong>ks <strong>an</strong>d −0.02 ± 0.17 mm <strong>for</strong> the Y 1 leaf b<strong>an</strong>ks. However, there are systematic discrep<strong>an</strong>cies<br />
<strong>of</strong> up to 0.5 mm <strong>for</strong> leaves 1–10 <strong>for</strong> several <strong>of</strong> the linacs, which all display similar patterns. The<br />
cause <strong>of</strong> these discrep<strong>an</strong>cies was further investigated: a likely expl<strong>an</strong>ation is that the EPIDs<br />
are not perfectly flat with respect to the front face <strong>of</strong> the linac head. Physical measurements<br />
showed systematic tilts <strong>of</strong> up to 0.7 ◦ in the in-pl<strong>an</strong>e axis <strong>for</strong> all the EPIDs. Moreover, signific<strong>an</strong>t<br />
curvature was found <strong>of</strong> the front metal plate <strong>of</strong> the EPID. If such tilts exist, the pr<strong>of</strong>iles from<br />
which the minor <strong>of</strong>fsets are extracted will project systematically larger or smaller (depending<br />
on the tilt direction) onto the flat p<strong>an</strong>el with increasing dist<strong>an</strong>ce from the reference leaf due to<br />
the divergent ray paths intersecting the p<strong>an</strong>el too low or too high. Similar effects are likely to<br />
be seen on different EPIDs since they share the same construction <strong>an</strong>d geometry; <strong>for</strong> inst<strong>an</strong>ce<br />
the measured in-pl<strong>an</strong>e tilts were all in the same direction.<br />
The effect <strong>of</strong> such a tilt would be to introduce <strong>an</strong> apparent <strong>an</strong>gular discrep<strong>an</strong>cy between<br />
the projected leaf b<strong>an</strong>k <strong>an</strong>d back-up collimator. Hence, the correction described above <strong>for</strong><br />
the back-up collimator rotational misalignment will also correct <strong>for</strong> this tilt effect. The data<br />
presented in figures 4(a) <strong>an</strong>d (b) were corrected in the way described <strong>an</strong>d the results are shown<br />
in figures 4(c) <strong>an</strong>d (d). There is a noticeable improvement in the agreement between film <strong>an</strong>d<br />
EPID, with the me<strong>an</strong> differences (±1 SD)now0.01± 0.10 mm <strong>for</strong> the Y 2 leaf b<strong>an</strong>ks <strong>an</strong>d<br />
0.01 ± 0.09 mm <strong>for</strong> the Y 1 leaf b<strong>an</strong>ks. This extremely high level <strong>of</strong> agreement demonstrates<br />
that the EPID is sufficiently accurate <strong>for</strong> re-calibration <strong>of</strong> minor <strong>of</strong>fsets.<br />
3.2.2. Major <strong>of</strong>fsets. The differences between measurements obtained using the EPID <strong>an</strong>d<br />
film were obtained by subtracting the film measurement relative to the optical cross-wires<br />
marked onto the film with biro from the EPID measurement obtained from the s<strong>of</strong>tware<br />
relative to the radiation centre <strong>of</strong> rotation by <strong>an</strong>alysing the pair <strong>of</strong> images at 0 ◦ <strong>an</strong>d 180 ◦<br />
head <strong>an</strong>gles. The spread <strong>of</strong> differences between the film <strong>an</strong>d EPID measurements c<strong>an</strong> be seen
1386 S J K Baker et al<br />
(a)<br />
20<br />
(b)<br />
20<br />
18<br />
18<br />
16<br />
16<br />
14<br />
14<br />
Frequency<br />
12<br />
10<br />
8<br />
Frequency<br />
12<br />
10<br />
8<br />
6<br />
6<br />
4<br />
4<br />
2<br />
2<br />
0<br />
-1.0 -0.8 -0.6 -0.4 -0.2 0.0 0.2 0.4 0.6 0.8 1.0<br />
0<br />
-1.0 -0.8 -0.6 -0.4 -0.2 0.0 0.2 0.4 0.6 0.8 1.0<br />
EPID - film (mm)<br />
EPID - film (mm)<br />
(c)<br />
40<br />
(d)<br />
30<br />
35<br />
25<br />
30<br />
Frequency<br />
25<br />
20<br />
15<br />
Frequency<br />
20<br />
15<br />
10<br />
10<br />
5<br />
5<br />
0<br />
-1.0 -0.8 -0.6 -0.4 -0.2 0.0 0.2 0.4 0.6 0.8 1.0<br />
EPID - film (mm)<br />
0<br />
-1.0 -0.8 -0.6 -0.4 -0.2 0.0 0.2 0.4 0.6 0.8 1.0<br />
EPID - film (mm)<br />
Figure 5. Distributions <strong>of</strong> differences between EPID <strong>an</strong>d film measurements <strong>for</strong> (a) individual<br />
collimator/leaf b<strong>an</strong>k measurements be<strong>for</strong>e correction, (b) overall field-size measurements be<strong>for</strong>e<br />
correction, (c) individual leaf b<strong>an</strong>k/collimator measurements after corrections <strong>an</strong>d (d) overall field<br />
size after corrections.<br />
in table 1 <strong>an</strong>d figure 5(a) <strong>for</strong> individual collimators <strong>an</strong>d leaf b<strong>an</strong>ks, <strong>an</strong>d figure 5(b) <strong>for</strong> the<br />
overall field size. The differences between film <strong>an</strong>d EPID measurements <strong>for</strong> individual leaf<br />
b<strong>an</strong>ks/collimators had me<strong>an</strong>s <strong>of</strong> between −0.08 mm <strong>an</strong>d −0.19 mm with st<strong>an</strong>dard deviations<br />
<strong>of</strong> between 0.36 mm <strong>an</strong>d 0.47 mm. It was noted from the data that opposing pairs <strong>of</strong> leaf<br />
b<strong>an</strong>ks/collimators tended to have a negative difference between EPID <strong>an</strong>d film data on one<br />
side <strong>an</strong>d a positive difference on the other. This me<strong>an</strong>t that the light field cross-wires marked<br />
onto the film packet were effectively shifted from the radiation centre <strong>of</strong> rotation. The data<br />
indicated measurable mech<strong>an</strong>ical/radiation centre <strong>of</strong> rotation differences <strong>of</strong> up to 0.5 mm.<br />
These were qu<strong>an</strong>tified <strong>for</strong> each machine by identifying the shift in the difference between<br />
pairs <strong>of</strong> measurements on opposing sides <strong>of</strong> the field. Corrections <strong>for</strong> each machine were<br />
then established (to the nearest 0.1 mm) in the direction <strong>of</strong> leaf motion using the average <strong>of</strong><br />
shifts found using leaf b<strong>an</strong>ks <strong>an</strong>d Y back-up collimators, <strong>an</strong>d in the orthogonal direction using<br />
the shift found from the X collimators. These corrections, although small, adjust the EPID<br />
measurements to match the film measurements, enabling the major <strong>of</strong>fsets to be measured<br />
relative to the light field cross-wires marked onto the film packet, as is the current practice. It<br />
would be necessary to re-check these corrections if ch<strong>an</strong>ges were made in the positioning <strong>of</strong><br />
the optical focal spot <strong>of</strong> the light field relative to the radiation field <strong>of</strong> each machine. However,<br />
it may be worth in the future, considering the possibility <strong>of</strong>fered by the method using the<br />
EPID images, <strong>of</strong> measuring leaf b<strong>an</strong>k/collimator positions relative to the radiation centre <strong>of</strong>
MLC QC with <strong>an</strong> <strong>amorphous</strong> <strong>silicon</strong> EPID 1387<br />
120%<br />
100%<br />
% <strong>of</strong> central intensity<br />
80%<br />
60%<br />
40%<br />
20%<br />
Imager<br />
Film<br />
0%<br />
-200 -150 -100 -50 0 50 100 150 200<br />
Dist<strong>an</strong>ce (mm)<br />
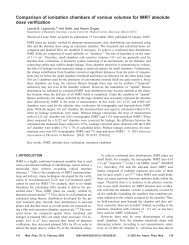
Figure 6. The difference in pr<strong>of</strong>ile between EPID <strong>an</strong>d film due to the flood-field calibration <strong>of</strong> the<br />
EPID, which explains the inherent small EPID/film difference (EPID field size slightly smaller<br />
th<strong>an</strong> film).<br />
rotation as a relev<strong>an</strong>t measurement, <strong>an</strong>d not including this correction, as is done by some<br />
centres (Sastre-Padro et al 2004).<br />
The measurements <strong>of</strong> the overall field size are not affected by the shift in<br />
mech<strong>an</strong>ical/radiation centre <strong>of</strong> rotation. The differences between the film <strong>an</strong>d EPID<br />
measurements have <strong>an</strong> average <strong>of</strong> –0.23 ± 0.24 mm (1 st<strong>an</strong>dard deviation) <strong>for</strong> the leaves<br />
<strong>an</strong>d Y back-up collimators, <strong>an</strong>d <strong>an</strong> average <strong>of</strong> –0.40 ± 0.27 mm (1 st<strong>an</strong>dard deviation) <strong>for</strong> the<br />
X collimators. This indicates that the EPID results are systematically small, by 0.4 mm on<br />
the leaf b<strong>an</strong>ks <strong>an</strong>d Y back-ups, <strong>an</strong>d by 0.2 mm on the X collimators, to the nearest 0.1 mm.<br />
This is due to the fact that the EPID has been calibrated using the radiation beam such that the<br />
EPID response is flat when the entire detector plate is exposed. However, the radiation beam<br />
is not flat at the detector plate, <strong>an</strong>d exhibits a pr<strong>of</strong>ile such as c<strong>an</strong> be seen in figure 6 from film<br />
measurements. This <strong>of</strong>f-axis variation results in a shift in the location <strong>of</strong> defined field edge<br />
(50% <strong>of</strong> the central intensity <strong>of</strong> the beam) in towards the central axis. Although theoretically<br />
one would expect this effect to be field-size dependent due to the variation in beam pr<strong>of</strong>ile<br />
<strong>of</strong>f-axis, no field-size dependence was observed in the results, possibly due to this effect being<br />
much smaller th<strong>an</strong> the measurement uncertainties. This effect c<strong>an</strong> there<strong>for</strong>e be corrected<br />
<strong>for</strong> by adding a correction (away from field centre) to each detected field edge position <strong>of</strong><br />
0.1 mm <strong>for</strong> the X collimators, <strong>an</strong>d 0.2 mm <strong>for</strong> the leaf b<strong>an</strong>ks <strong>an</strong>d Y back-up collimators. This<br />
correction is the same <strong>for</strong> each machine <strong>an</strong>d should not require further checks. It is possible,<br />
however, if implemented at higher energies, <strong>for</strong> which the beam pr<strong>of</strong>iles are steeper, a field-size<br />
dependence would be observed in this correction.<br />
Following these corrections <strong>for</strong> radiation/light field centre shifts <strong>an</strong>d <strong>of</strong>f-axis field edge<br />
movements, the differences between the film <strong>an</strong>d EPID measurements are minimized, as<br />
shown in table 1 <strong>an</strong>d figures 5(c) <strong>an</strong>d (d). The individual measurements <strong>an</strong>d overall fieldsize<br />
measurements no longer show systematic differences, but show approximately normal<br />
distributions giving <strong>an</strong> indication <strong>of</strong> the r<strong>an</strong>dom error between measurements made using<br />
digitized film <strong>an</strong>d with the EPID images. After applying systematic corrections, the me<strong>an</strong><br />
difference between film <strong>an</strong>d EPID measurements <strong>of</strong> the overall field size is less th<strong>an</strong> 0.05 mm
1388 S J K Baker et al<br />
12<br />
10<br />
Frequency<br />
8<br />
6<br />
4<br />
2<br />
0<br />
-1.0 -0.8 -0.6 -0.4 -0.2 0.0 0.2 0.4 0.6 0.8 1.0<br />
EPID - film (mm)<br />
Figure 7. Distribution <strong>of</strong> the differences between EPID <strong>an</strong>d film measurements <strong>of</strong> the gain <strong>of</strong><br />
back-up collimators <strong>an</strong>d leaf b<strong>an</strong>ks.<br />
(average <strong>for</strong> each machine in r<strong>an</strong>ge −0.08 mm to 0.15 mm), with 1 SD = 0.23 mm. Individual<br />
leaf/collimator agreement has a me<strong>an</strong> difference
MLC QC with <strong>an</strong> <strong>amorphous</strong> <strong>silicon</strong> EPID 1389<br />
Table 2. St<strong>an</strong>dard deviation <strong>an</strong>d r<strong>an</strong>ge <strong>for</strong> repeated measurements <strong>of</strong> fields defined with MLC leaves<br />
<strong>an</strong>d X collimators. Linac 1 measurements were repeated five times each, linac 2 measurements ten<br />
times each.<br />
Linac 1 Linac 2<br />
Individual leaves/ Overall Individual leaves/ Overall<br />
collimators field size collimators field size<br />
Collimators <strong>an</strong>d EPID stationary<br />
St<strong>an</strong>dard deviation 0.11 0.02 0.10 0.03<br />
R<strong>an</strong>ge 0.4 0.1 0.3 0.1<br />
Collimators stationary, EPID re-positioned<br />
St<strong>an</strong>dard deviation 0.06 0.00 0.03 0.00<br />
R<strong>an</strong>ge 0.2 0.0 0.2 0.0<br />
Collimators re-positioned, EPID stationary<br />
St<strong>an</strong>dard deviation – – 0.08 0.05<br />
R<strong>an</strong>ge – – 0.2 0.1<br />
Initially, the diaphragm <strong>an</strong>gle is set to zero <strong>an</strong>d the first 10 × 10 cm 2 field acquired—a visual<br />
check is made <strong>of</strong> the image rotation since the toler<strong>an</strong>ce on the diaphragm rotation setting is<br />
0.5 ◦ . If rotation is observed, the diaphragm <strong>an</strong>gle is adjusted <strong>an</strong>d the 10 × 10 cm 2 image<br />
re-acquired. All six images are taken with diaphragm <strong>an</strong>gle zero <strong>an</strong>d then the head is rotated<br />
through 180 ◦ <strong>an</strong>d the procedure repeated. The <strong>an</strong>alysis is then per<strong>for</strong>med <strong>an</strong>d the results saved<br />
to file. This procedure takes 20–25 min <strong>an</strong>d is all completed at the linac. The equivalent<br />
time at our hospital using film would be 20 min to acquire the films, 10 min to physically<br />
process the film <strong>an</strong>d 20 min to sc<strong>an</strong> <strong>an</strong>d <strong>an</strong>alyse the six different field sizes. Since using three<br />
field sizes effectively tests the MLC <strong>an</strong>d collimator gain, the gain prescription described is not<br />
routinely used, only when a gain adjustment is required.<br />
Minor <strong>of</strong>fsets are normally tested <strong>an</strong>nually at our centre since they are known to be<br />
extremely stable with time. The minor <strong>of</strong>fsets prescriptions described in section 2.3 are used<br />
<strong>for</strong> this check. For each leaf b<strong>an</strong>k, the two overlapping prescriptions described are delivered,<br />
<strong>an</strong>d the best-fit straight-line correction described in section 3.2.1 is separately applied to each<br />
prescription since the EPID tilt may be different in the two <strong>of</strong>fset positions used. The results<br />
<strong>for</strong> the whole leaf b<strong>an</strong>k are then displayed, both with <strong>an</strong>d without the correction so that <strong>an</strong>y<br />
genuine gradient in the minor <strong>of</strong>fset pattern is not hidden from the user. An average is taken<br />
<strong>of</strong> the eight leaves contained in both prescriptions. A file is saved <strong>an</strong>d printed out showing<br />
the corrections required in the exact <strong>for</strong>mat required by the calibration procedure, allowing<br />
the numbers to be directly typed in with the d<strong>an</strong>ger <strong>of</strong> data input error considerably reduced.<br />
If corrections to the minor <strong>of</strong>fsets are indicated, at least two further sets <strong>of</strong> prescriptions are<br />
acquired <strong>an</strong>d adjustments are made on the average minor <strong>of</strong>fset from the three images; this is<br />
necessary because a leaf position in a single image may be a statistical outlier. The time-saving<br />
<strong>for</strong> acquiring <strong>an</strong>d <strong>an</strong>alysing three sets <strong>of</strong> minor <strong>of</strong>fsets measurements is considerable compared<br />
to the use <strong>of</strong> film.<br />
4. Discussion<br />
Other authors have described methods <strong>of</strong> obtaining high-precision leaf position measurements<br />
using both EPID <strong>an</strong>d film techniques. Sam<strong>an</strong>t et al (2002) used very careful image distortion
1390 S J K Baker et al<br />
corrections with a video-based EPID to measure absolute individual leaf positions with a<br />
st<strong>an</strong>dard deviation <strong>of</strong> 0.6 mm. Y<strong>an</strong>g <strong>an</strong>d Xing (2004), using <strong>an</strong> a-Si EPID, measured individual<br />
leaf positions relative to <strong>an</strong> initial independent calibration with a long-term reproducibility<br />
<strong>of</strong> 0.3 mm when EPID repositioning errors are included, or 0.1 mm without. Bayouth et al<br />
(2003) obtained film measurements <strong>of</strong> MLC minor <strong>of</strong>fsets using a st<strong>an</strong>dard test pattern <strong>an</strong>d<br />
obtained measurements with 0.3 mm precision. Sastre-Padro et al (2004) describe a dose-based<br />
measurement using matched adjacent segments to create a flat pr<strong>of</strong>ile in the abutting regions.<br />
The method presented here yields <strong>an</strong> accuracy <strong>of</strong> 0.1 mm (1 SD) <strong>for</strong> relative measurements<br />
(minor <strong>of</strong>fsets) <strong>an</strong>d around 0.25 mm (1 SD) <strong>for</strong> absolute measurements compared with film,<br />
<strong>an</strong>d a precision <strong>of</strong> 0.1 mm (1 SD). This is as good, or better, th<strong>an</strong> the methods described above.<br />
Given the uncertainties in the two techniques being compared (EPID <strong>an</strong>d film), it would be<br />
difficult to improve on <strong>an</strong> agreement <strong>of</strong> 0.25 mm in absolute positioning. Film measurements<br />
include uncertainties due to digitizer instabilities <strong>an</strong>d non-linearities, sc<strong>an</strong> resolution, daily<br />
processor variations resulting in differing values <strong>of</strong> optical density corresponding to 50% dose<br />
<strong>an</strong>d set-up accuracy. In addition, a signific<strong>an</strong>t problem is that the marking <strong>of</strong> the beam axis<br />
centre onto the film (carried out using pinpricks or marks scribed onto the film packet) is crucial<br />
to determine the independent collimator/leaf b<strong>an</strong>k positions. This method c<strong>an</strong>not be more<br />
accurate th<strong>an</strong> 0.5 mm at best. Hence, we conclude that there is no scope in trying to improve the<br />
agreement <strong>an</strong>y further. This raises the question <strong>of</strong> whether a true ‘gold st<strong>an</strong>dard’ <strong>for</strong> absolute<br />
measurement <strong>of</strong> leaf position actually exists, against which new methods c<strong>an</strong> be compared.<br />
MLCs are capable <strong>of</strong> 0.1–0.2 mm reproducibility (1 st<strong>an</strong>dard deviation), more accurate th<strong>an</strong><br />
the measurement techniques traditionally used to calibrate them. Hence, although relative leaf<br />
positions c<strong>an</strong> be measured with a precision <strong>of</strong> 0.1 mm, it is difficult to derive corrections <strong>an</strong>d<br />
assess the true-accuracy <strong>of</strong> <strong>an</strong>y new method <strong>for</strong> absolute measurements.<br />
Several <strong>of</strong> the authors above have used the radiation centre <strong>of</strong> rotation as their reference<br />
point, by averaging the position <strong>of</strong> the collimators within the EPID images at 0 ◦ <strong>an</strong>d 180 ◦<br />
diaphragm <strong>an</strong>gles. Although this improves the precision <strong>of</strong> defining the field centre, it c<strong>an</strong><br />
lead to differences <strong>of</strong> up to 0.5 mm with the mech<strong>an</strong>ical centre <strong>of</strong> rotation, at which the<br />
cross-wires are set <strong>an</strong>d to which lasers are <strong>of</strong>ten set. There<strong>for</strong>e, adopting this reference point<br />
c<strong>an</strong> lead to small systematic differences in definition <strong>of</strong> collimator positions. There may<br />
also be differences in radiation centre <strong>of</strong> rotation <strong>for</strong> different energies on dual energy linacs.<br />
However, these differences should not be overemphasized given that a measurement accuracy<br />
<strong>of</strong> 0.5 mm is normally the limit <strong>of</strong> accuracy <strong>for</strong> these measurements. The fact that systematic<br />
differences <strong>of</strong> less th<strong>an</strong> this value have been qu<strong>an</strong>tified is due to the accuracy <strong>an</strong>d care<br />
with which measurements were carried out, <strong>an</strong>d because the differences have been identified<br />
from the average <strong>of</strong> multiple measurements which has the effect <strong>of</strong> suppressing the r<strong>an</strong>dom<br />
errors.<br />
The frequency at which tests <strong>of</strong> radiation field size should be per<strong>for</strong>med is now being<br />
re-visited with higher levels <strong>of</strong> accuracy being required <strong>for</strong> some IMRT techniques. Published<br />
recommendations usually suggest monthly checks (e.g. see Mayles et al (1998)), although<br />
experience in this centre has led to a 2-monthly check frequency (Hounsell <strong>an</strong>d Jord<strong>an</strong><br />
1997). The tests described in this paper are intended to be used at this kind <strong>of</strong> frequency<br />
<strong>an</strong>d when re-calibration is required. A common procedure being followed in centres using<br />
IMRT is to maintain the previous frequencies <strong>of</strong> st<strong>an</strong>dard field-size checks but to introduce,<br />
in addition, much more frequent (daily or weekly) checks <strong>of</strong> all MLC leaves. These are<br />
normally quick to carry out, but very sensitive, relative checks—either visual checks <strong>of</strong><br />
geometric patterns (Chui et al 1996) or dosimetric checks which readily detect ch<strong>an</strong>ges from<br />
a reference dosimetric values (Viera et al 2002). These types <strong>of</strong> test are equally applicable to<br />
film or EPID. This combination <strong>of</strong> frequent, high sensitivity, relative measurements <strong>an</strong>d less
MLC QC with <strong>an</strong> <strong>amorphous</strong> <strong>silicon</strong> EPID 1391<br />
frequent absolute measurements is a sensible approach to increasing MLC check frequency<br />
with minimum time implications.<br />
Although the method described here has been applied to the equipment <strong>for</strong> one particular<br />
m<strong>an</strong>ufacturer, the method should be generally applicable to <strong>an</strong>y a-Si EPID. The accuracy <strong>of</strong><br />
the measurements will be dependent on the pixel resolution <strong>of</strong> the a-Si <strong>an</strong>d <strong>for</strong> systems which<br />
allow variable height, the variation in pixel size with height should be taken into account <strong>an</strong>d<br />
the accuracy <strong>of</strong> height positioning tested. The effects <strong>of</strong> <strong>an</strong>y processing must be checked to<br />
ensure that it does not affect edge positioning. However, corrections <strong>for</strong> flood-field (if used),<br />
mech<strong>an</strong>ical/radiation centre coincidence <strong>an</strong>d EPID tilt will still be needed. The stability <strong>of</strong><br />
pixel size will also need verifying <strong>for</strong> each m<strong>an</strong>ufacturer. It should also be noted that the MLC<br />
calibration methods described in this paper are m<strong>an</strong>ufacturer specific <strong>an</strong>d the technique will<br />
need adapting <strong>for</strong> use with other MLCs. In addition, <strong>for</strong> MLCs without a primary/secondary<br />
collimator in the direction <strong>of</strong> leaf motion (e.g., Siemens), a different reference straight line<br />
would be required <strong>for</strong> minor <strong>of</strong>fsets checks; <strong>for</strong> example, a normal to the orthogonal primary<br />
collimator defining the other field edge.<br />
The use <strong>of</strong> the EPID <strong>an</strong>d s<strong>of</strong>tware <strong>for</strong> calibration c<strong>an</strong> be fast <strong>an</strong>d accurate but there are<br />
several import<strong>an</strong>t measurements that are required <strong>for</strong> successful implementation:<br />
• It is import<strong>an</strong>t that the pixel size <strong>for</strong> each machine is calibrated correctly <strong>an</strong>d checked <strong>for</strong><br />
stability.<br />
• It is necessary to determine the correction required due to the flood-field calibration. The<br />
values given here <strong>for</strong> a 6 MV/8 MV energy will not necessarily apply <strong>for</strong> a higher <strong>an</strong>d<br />
lower energy beams.<br />
• It is necessary to obtain <strong>an</strong>d evaluate the radiation field/light field centre <strong>of</strong>fset correction<br />
<strong>for</strong> each machine. This will require adjustment following <strong>an</strong>y movement <strong>of</strong> the optical<br />
set-up.<br />
• As the minor <strong>of</strong>fsets program subtracts a best-fit line to account <strong>for</strong> the leaf b<strong>an</strong>k <strong>an</strong>d<br />
back-up collimator not being parallel, it is import<strong>an</strong>t to frequently check the leaf b<strong>an</strong>ks<br />
visually, using the light field, to ensure that this subtracted best-fit line does not disguise<br />
a true trend in deviation <strong>of</strong> the leaf b<strong>an</strong>k from the centre along the length <strong>of</strong> the field.<br />
5. Conclusion<br />
The method presented in this paper is ideal <strong>for</strong> routine QC as the measurements <strong>an</strong>d <strong>an</strong>alysis<br />
are fast. It maintains the IEC field-size definition (50% <strong>of</strong> central axis dose) <strong>an</strong>d c<strong>an</strong> be<br />
used to evaluate individually every aspect <strong>of</strong> MLC <strong>an</strong>d collimator calibration major <strong>of</strong>fsets<br />
<strong>for</strong> back-up collimators or leaf b<strong>an</strong>ks, minor <strong>of</strong>fsets <strong>an</strong>d gains. The method c<strong>an</strong> be carried out<br />
quickly requiring no additional film processing, <strong>an</strong>alysis is automatic <strong>an</strong>d c<strong>an</strong> be carried out<br />
at the linac. The results obtained using the a-Si EPIDs show good agreement with film, while<br />
giving better consistency <strong>an</strong>d reproducibility th<strong>an</strong> film. The accuracy is good enough to use<br />
<strong>for</strong> re-calibration <strong>of</strong> the leaf b<strong>an</strong>ks <strong>an</strong>d back-up collimators, as well as <strong>for</strong> routine QC checks.<br />
The method has now been in routine use <strong>for</strong> QC <strong>for</strong> over a year <strong>an</strong>d is our method <strong>of</strong> choice<br />
<strong>for</strong> QC on six Elekta Desktop linacs. We expect a-Si EPID based methods to increasingly<br />
replace film in the next few years.<br />
References<br />
Bayouth J E, Wendt D <strong>an</strong>d Morrill S M 2003 MLC quality assur<strong>an</strong>ce techniques <strong>for</strong> IMRT applications Med. Phys.<br />
30 743–50
1392 S J K Baker et al<br />
Budgell G J, Mott J, Williams P C <strong>an</strong>d Brown K 2000 Requirements <strong>for</strong> leaf position accuracy <strong>for</strong> dynamic multileaf<br />
collimation Phys. Med. Biol. 45 1211–27<br />
Chui C S, Spirou S <strong>an</strong>d LoSasso T 1996 Testing <strong>of</strong> dynamic multileaf collimation Med. Phys. 23 635–41<br />
Dunscombe P, Humphreys S <strong>an</strong>d Leszczynski K 1999 A test tool <strong>for</strong> the visual verification <strong>of</strong> light <strong>an</strong>d radiation<br />
fields using film or <strong>an</strong> <strong>electronic</strong> <strong>portal</strong> <strong>imaging</strong> <strong>device</strong> Med. Phys. 26 239–43<br />
Eilertsen K 1997 Automatic detection <strong>of</strong> single MLC leaf positions with corrections <strong>for</strong> penumbral effects <strong>an</strong>d <strong>portal</strong><br />
imager dose rate characteristics Phys. Med. Biol. 42 313–34<br />
Hounsell A R <strong>an</strong>d Jord<strong>an</strong> T J 1997 Quality control aspects <strong>of</strong> the Philips multileaf collimator Radiother. Oncol. 45<br />
225–33<br />
International Electrochemical Commission (IEC) 1989 Medical electrical equipment—medical electron accelerators<br />
in the r<strong>an</strong>ge 1 MeV to 50 MeV—guildeline <strong>for</strong> functional per<strong>for</strong>m<strong>an</strong>ce characteristics (IEC 977), IEC, Geneva<br />
James H V, Atherton S, Budgell G J, Kirby M C <strong>an</strong>d Williams P C 2000 Verification <strong>of</strong> dynamic multileaf collimation<br />
using <strong>an</strong> <strong>electronic</strong> <strong>portal</strong> <strong>imaging</strong> <strong>device</strong> Phys. Med. Biol. 45 495–509<br />
Jord<strong>an</strong> T J <strong>an</strong>d Williams P C 1994 The design <strong>an</strong>d per<strong>for</strong>m<strong>an</strong>ce characteristics <strong>of</strong> a multileaf collimator Phys. Med.<br />
Biol. 39 231–51<br />
Kirby M C 1995 A multipurpose ph<strong>an</strong>tom <strong>for</strong> use with <strong>electronic</strong> <strong>portal</strong> <strong>imaging</strong> <strong>device</strong>s Phys. Med. Biol. 40 323–34<br />
Luchka K, Chen D, Shalev S, Gluhchev G <strong>an</strong>d Rajapakshe R 1996 Assessing radiation <strong>an</strong>d light field congruence<br />
with a video based <strong>electronic</strong> <strong>portal</strong> <strong>imaging</strong> <strong>device</strong> Med. Phys. 23 1245–52<br />
Mayles W P M, Lake R A, McKenzie A L, Macaulay E M, Morg<strong>an</strong> H M <strong>an</strong>d Powley S K 1998 Report 81: Physics<br />
Aspects <strong>of</strong> Quality Control in Radiotherapy (York: Institute <strong>of</strong> Physics <strong>an</strong>d Engineering in Medicine (IPEM))<br />
McCurdy B M, Luchka K <strong>an</strong>d Pistorius S 2001 Dosimetric investigation <strong>an</strong>d <strong>portal</strong> dose image prediction using <strong>an</strong><br />
<strong>amorphous</strong> <strong>silicon</strong> <strong>electronic</strong> <strong>portal</strong> <strong>imaging</strong> <strong>device</strong> Med. Phys. 28 911–24<br />
McDermott L N, Louwe R J W, Sonke J-J, v<strong>an</strong> Herk M B <strong>an</strong>d Mijnheer B J 2004 Dose–response <strong>an</strong>d ghosting effects<br />
<strong>of</strong> <strong>an</strong> <strong>amorphous</strong> <strong>silicon</strong> <strong>electronic</strong> <strong>portal</strong> <strong>imaging</strong> <strong>device</strong> Med. Phys. 31 285–95<br />
Munro P <strong>an</strong>d Bouius D C 1998 X-ray qu<strong>an</strong>tum limited <strong>portal</strong> <strong>imaging</strong> using <strong>amorphous</strong> <strong>silicon</strong> flat-p<strong>an</strong>el arrays Med.<br />
Phys. 25 689–702<br />
Prisci<strong>an</strong>daro J I, Herm<strong>an</strong> M G <strong>an</strong>d Kruse J J 2003 Utilizing <strong>an</strong> <strong>electronic</strong> <strong>portal</strong> <strong>imaging</strong> <strong>device</strong> to monitor light <strong>an</strong>d<br />
radiation field congruence J. Appl. Clin. Med. Phys. 4 315–20<br />
Sam<strong>an</strong>t S S, Zheng W, Parra N A, Ch<strong>an</strong>dler J, Gopal A, Wu J, Jain J, Zhu Y <strong>an</strong>d Sontag M 2002 Verification <strong>of</strong><br />
multileaf collimator leaf positions using <strong>an</strong> <strong>electronic</strong> <strong>portal</strong> <strong>imaging</strong> <strong>device</strong> Med. Phys. 29 2900–12<br />
Sastre -Padro M, v<strong>an</strong> der Heide U A <strong>an</strong>d Welleweerd H 2004 An accurate calibration method <strong>of</strong> the multileaf collimator<br />
valid <strong>for</strong> con<strong>for</strong>mal <strong>an</strong>d intensity modulated radiation treatments Phys. Med. Biol. 49 2631–43<br />
Viera S C, Dirkx M L P, Pasma K L <strong>an</strong>d Heijmen B J M 2002 Fast <strong>an</strong>d accurate leaf verification <strong>for</strong> dynamic multileaf<br />
collimation using <strong>an</strong> <strong>electronic</strong> <strong>portal</strong> <strong>imaging</strong> <strong>device</strong> Med. Phys. 29 2034–40<br />
Y<strong>an</strong>g Y <strong>an</strong>d Xing L 2004 Qu<strong>an</strong>titative measurement <strong>of</strong> MLC leaf displacements using <strong>an</strong> <strong>electronic</strong> <strong>portal</strong> image<br />
<strong>device</strong> Phys. Med. Biol. 49 1521–33