ANNUAL REPORT 2012 - University of South Africa
ANNUAL REPORT 2012 - University of South Africa
ANNUAL REPORT 2012 - University of South Africa

Create successful ePaper yourself
Turn your PDF publications into a flip-book with our unique Google optimized e-Paper software.
UNISA <strong>ANNUAL</strong> <strong>REPORT</strong> <strong>2012</strong><br />
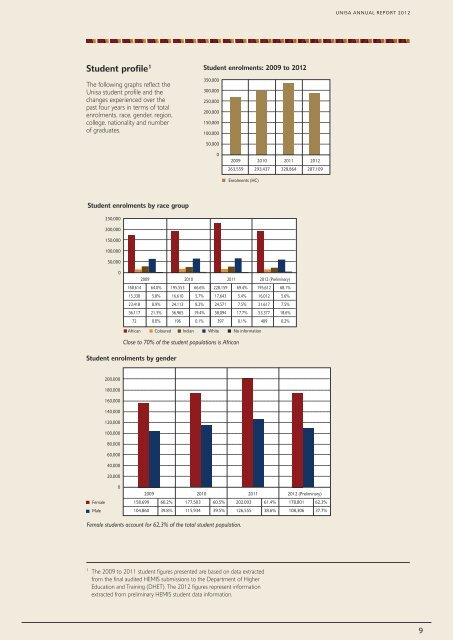
Student pr<strong>of</strong>ile 1<br />
The following graphs reflect the<br />
Unisa student pr<strong>of</strong>ile and the<br />
changes experienced over the<br />
past four years in terms <strong>of</strong> total<br />
enrolments, race, gender, region,<br />
college, nationality and number<br />
<strong>of</strong> graduates.<br />
Student enrolments: 2009 to <strong>2012</strong><br />
350,000<br />
300,000<br />
250,000<br />
200,000<br />
150,000<br />
100,000<br />
50,000<br />
0<br />
2009 2010 2011 <strong>2012</strong><br />
263,559 293,437 328,864 287,109<br />
Enrolments (HC)<br />
Student enrolments by race group<br />
250,000<br />
200,000<br />
150,000<br />
100,000<br />
50,000<br />
0<br />
2009 2010 2011 <strong>2012</strong> (Preliminary)<br />
168,614 64.0% 195,553 66.6% 228,159 69.4% 195,612 68.1%<br />
15,338 5.8% 16,610 5.7% 17,643 5.4% 16,012 5.6%<br />
23,418 8.9% 24,113 8.2% 24,571 7.5% 21,617 7.5%<br />
56,117 21.3% 56,965 19.4% 58,094 17.7% 53,377 18.6%<br />
72 0.0% 196 0.1% 397 0.1% 489 0.2%<br />
<strong>Africa</strong>n Coloured Indian White No information<br />
Close to 70% <strong>of</strong> the student populations is <strong>Africa</strong>n<br />
Student enrolments by gender<br />
200,000<br />
180,000<br />
160,000<br />
140,000<br />
120,000<br />
100,000<br />
80,000<br />
60,000<br />
40,000<br />
20,000<br />
Female<br />
Male<br />
0<br />
2009 2010 2011 <strong>2012</strong> (Preliminary)<br />
158.699 60.2% 177,503 60.5% 202.003 61.4% 178,801 62.3%<br />
104,860 39.8% 115,934 39.5% 126,555 38.6% 108,306 37.7%<br />
Female students account for 62,3% <strong>of</strong> the total student population.<br />
1 The 2009 to 2011 student figures presented are based on data extracted<br />
from the final audited HEMIS submissions to the Department <strong>of</strong> Higher<br />
Education and Training (DHET). The <strong>2012</strong> figures represent information<br />
extracted from preliminary HEMIS student data information.<br />
9