Using Cumulative Count Of Conforming CCC-Chart to Study the ...
Using Cumulative Count Of Conforming CCC-Chart to Study the ...
Using Cumulative Count Of Conforming CCC-Chart to Study the ...
SHOW LESS

Create successful ePaper yourself
Turn your PDF publications into a flip-book with our unique Google optimized e-Paper software.
10<br />
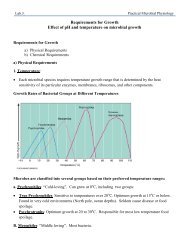
Fig( 6-5) A decision graph for <strong>the</strong> stat of control of a process<br />
Fig (5-5) Show <strong>the</strong> chart of <strong>the</strong> sample size of different fractional non conforming level at<br />
certainty level, s Number <strong>Of</strong> –non- conforming items percent non conforming.<br />
Since usually p