Assam - Ministry of Environment and Forests
Assam - Ministry of Environment and Forests
Assam - Ministry of Environment and Forests

Create successful ePaper yourself
Turn your PDF publications into a flip-book with our unique Google optimized e-Paper software.
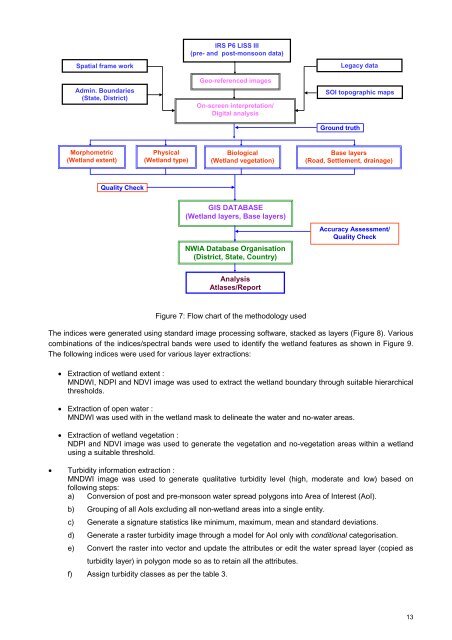
IRS P6 LISS III<br />
(pre- <strong>and</strong> post-monsoon data)<br />
Spatial frame work<br />
Legacy data<br />
Geo-referenced images<br />
Admin. Boundaries<br />
(State, District)<br />
On-screen interpretation/<br />
Digital analysis<br />
SOI topographic maps<br />
Ground truth<br />
Morphometric<br />
(Wetl<strong>and</strong> extent)<br />
Physical<br />
(Wetl<strong>and</strong> type)<br />
Biological<br />
(Wetl<strong>and</strong> vegetation)<br />
Base layers<br />
(Road, Settlement, drainage)<br />
Quality Check<br />
GIS DATABASE<br />
(Wetl<strong>and</strong> layers, Base layers)<br />
NWIA Database Organisation<br />
(District, State, Country)<br />
Accuracy Assessment/<br />
Quality Check<br />
Analysis<br />
Atlases/Report<br />
Figure 7: Flow chart <strong>of</strong> the methodology used<br />
The indices were generated using st<strong>and</strong>ard image processing s<strong>of</strong>tware, stacked as layers (Figure 8). Various<br />
combinations <strong>of</strong> the indices/spectral b<strong>and</strong>s were used to identify the wetl<strong>and</strong> features as shown in Figure 9.<br />
The following indices were used for various layer extractions:<br />
• Extraction <strong>of</strong> wetl<strong>and</strong> extent :<br />
MNDWI, NDPI <strong>and</strong> NDVI image was used to extract the wetl<strong>and</strong> boundary through suitable hierarchical<br />
thresholds.<br />
• Extraction <strong>of</strong> open water :<br />
MNDWI was used with in the wetl<strong>and</strong> mask to delineate the water <strong>and</strong> no-water areas.<br />
• Extraction <strong>of</strong> wetl<strong>and</strong> vegetation :<br />
NDPI <strong>and</strong> NDVI image was used to generate the vegetation <strong>and</strong> no-vegetation areas within a wetl<strong>and</strong><br />
using a suitable threshold.<br />
• Turbidity information extraction :<br />
MNDWI image was used to generate qualitative turbidity level (high, moderate <strong>and</strong> low) based on<br />
following steps:<br />
a) Conversion <strong>of</strong> post <strong>and</strong> pre-monsoon water spread polygons into Area <strong>of</strong> Interest (AoI).<br />
b) Grouping <strong>of</strong> all AoIs excluding all non-wetl<strong>and</strong> areas into a single entity.<br />
c) Generate a signature statistics like minimum, maximum, mean <strong>and</strong> st<strong>and</strong>ard deviations.<br />
d) Generate a raster turbidity image through a model for AoI only with conditional categorisation.<br />
e) Convert the raster into vector <strong>and</strong> update the attributes or edit the water spread layer (copied as<br />
turbidity layer) in polygon mode so as to retain all the attributes.<br />
f) Assign turbidity classes as per the table 3.<br />
13