Annual review and forecast of Utah coal - Utah Geological Survey ...
Annual review and forecast of Utah coal - Utah Geological Survey ...
Annual review and forecast of Utah coal - Utah Geological Survey ...

Create successful ePaper yourself
Turn your PDF publications into a flip-book with our unique Google optimized e-Paper software.
ANNUAL REVIEW AND<br />
FORECAST OF UTAH COAL<br />
PRODUCTION AND<br />
DISTRIBUTION—2009<br />
Final 2009 numbers <strong>and</strong> preliminary 2010 data<br />
by Michael D. V<strong>and</strong>en Berg<br />
CIRCULAR 112<br />
UTAH GEOLOGICAL SURVEY<br />
a division <strong>of</strong><br />
<strong>Utah</strong> Department <strong>of</strong> Natural Resources<br />
2010
ANNUAL REVIEW AND<br />
FORECAST OF UTAH COAL<br />
PRODUCTION AND<br />
DISTRIBUTION—2009<br />
Final 2009 numbers <strong>and</strong> preliminary 2010 data<br />
by Michael D. V<strong>and</strong>en Berg<br />
ISBN 978-1-55791-838-3<br />
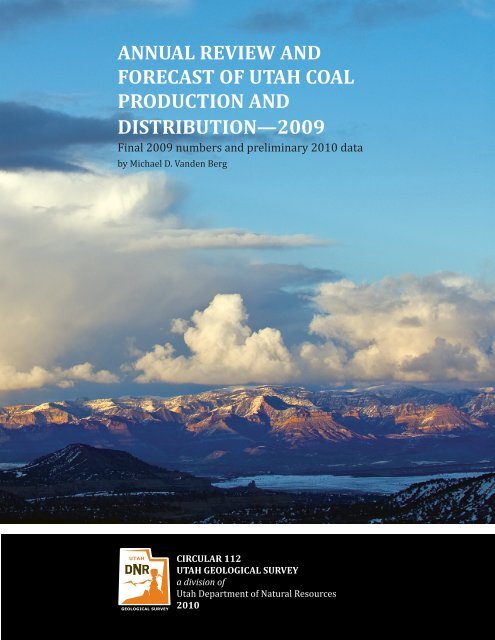
Cover photo: Book Cliffs near Price, <strong>Utah</strong><br />
CIRCULAR 112<br />
UTAH GEOLOGICAL SURVEY<br />
a division <strong>of</strong><br />
<strong>Utah</strong> Department <strong>of</strong> Natural Resources<br />
2010
STATE OF UTAH<br />
Gary R. Herbert, Governor<br />
DEPARTMENT OF NATURAL RESOURCES<br />
Michael Styler, Executive Director<br />
UTAH GEOLOGICAL SURVEY<br />
Richard G. Allis, Director<br />
PUBLICATIONS<br />
contact<br />
Natural Resources Map & Bookstore<br />
1594 W. North Temple<br />
Salt Lake City, UT 84116<br />
telephone: 801-537-3320<br />
toll-free: 1-888-UTAH MAP<br />
Web site: mapstore.utah.gov<br />
email: geostore@utah.gov<br />
UTAH GEOLOGICAL SURVEY<br />
contact<br />
1594 W. North Temple, Suite 3110<br />
Salt Lake City, UT 84116<br />
telephone: 801-537-3300<br />
Web site: geology.utah.gov<br />
Although this product represents the work <strong>of</strong> pr<strong>of</strong>essional scientists, the <strong>Utah</strong> Department <strong>of</strong> Natural Resources,<br />
<strong>Utah</strong> <strong>Geological</strong> <strong>Survey</strong>, makes no warranty, express or implied, regarding its suitability for a particular use. The<br />
<strong>Utah</strong> Department <strong>of</strong> Natural Resources, <strong>Utah</strong> <strong>Geological</strong> <strong>Survey</strong>, shall not be liable under any circumstances for<br />
any direct, indirect, special, incidental, or consequential damages with respect to claims by users <strong>of</strong> this product.
PREFACE<br />
This report was prepared by Michael V<strong>and</strong>en Berg under the direction <strong>of</strong> David Tabet, Energy<br />
<strong>and</strong> Minerals Program Manager, <strong>and</strong> Rick Allis, Director <strong>of</strong> the <strong>Utah</strong> <strong>Geological</strong> <strong>Survey</strong><br />
(UGS), <strong>Utah</strong> Department <strong>of</strong> Natural Resources. Additional information about the data in this<br />
report can be obtained from Michael V<strong>and</strong>en Berg at 801-538-5419, or email at michaelv<strong>and</strong>enberg@utah.gov.<br />
Data for the annual <strong>Utah</strong> Coal Report were gathered directly from <strong>coal</strong> producers <strong>and</strong> consumers,<br />
<strong>and</strong> comparisons were made to national data, news <strong>and</strong> company reports, <strong>and</strong> data from<br />
industry experts.<br />
This will be the last st<strong>and</strong>-alone annual <strong>Utah</strong> Coal Report. In the future, similar <strong>coal</strong> production<br />
<strong>and</strong> distribution information will be prepared as part <strong>of</strong> the annual UGS Mineral Activity<br />
Summary.<br />
For more information on <strong>Utah</strong> <strong>coal</strong> or other energy-related data, please refer to the “<strong>Utah</strong><br />
Energy <strong>and</strong> Mineral Statistics” Web-based data repository located at http://geology.utah.gov/<br />
emp/energydata.
CONTENTS<br />
EXECUTIVE SUMMARY......................................................................................................................................................................................... 1<br />
UTAH COAL PRICES, EMPLOYMENT, AND PRODUCTION...................................................................................................................... 1<br />
Prices <strong>and</strong> Revenue......................................................................................................................................................................................... 2<br />
Employment....................................................................................................................................................................................................... 2<br />
Coal Mining Productivity.............................................................................................................................................................................. 5<br />
Production By Coalfield................................................................................................................................................................................ 5<br />
Production By County.................................................................................................................................................................................... 5<br />
Production By L<strong>and</strong>ownership.................................................................................................................................................................. 5<br />
ACTIVITIES OF UTAH COAL OPERATORS..................................................................................................................................................... 6<br />
<strong>Utah</strong>American Energy, Inc. –<br />
Murray Energy Corporation.................................................................................................................................................................. 9<br />
Tower Division – Aberdeen <strong>and</strong> Pinnacle Mines........................................................................................................................... 9<br />
Dry Canyon Coal Tract............................................................................................................................................................................10<br />
Lila Canyon Mine.......................................................................................................................................................................................10<br />
GENWAL Resources, Inc. – Cr<strong>and</strong>all Canyon <strong>and</strong> South Cr<strong>and</strong>all Canyon Mines..........................................................10<br />
WEST RIDGE Resources, Inc. – West Ridge Mine........................................................................................................................10<br />
Canyon Fuel Company – Arch Coal.........................................................................................................................................................10<br />
Dugout Canyon Mine...............................................................................................................................................................................10<br />
Skyline Mine................................................................................................................................................................................................10<br />
SUFCO Mine.................................................................................................................................................................................................10<br />
Greens Hollow Tract................................................................................................................................................................................11<br />
Cottonwood Tract.....................................................................................................................................................................................11<br />
CONSOL Energy..............................................................................................................................................................................................11<br />
Emery Mine.................................................................................................................................................................................................11<br />
C.W. Mining (Co-op)......................................................................................................................................................................................11<br />
Bear Canyon Mines..................................................................................................................................................................................11<br />
Energy West Mining Company (PacifiCorp).......................................................................................................................................11<br />
Deer Creek Mine........................................................................................................................................................................................11<br />
America West Resources, Inc....................................................................................................................................................................11<br />
Hidden Splendor Resources, Inc. – Horizon Mine......................................................................................................................11<br />
Columbia Property...................................................................................................................................................................................11<br />
Alton Coal Development, LLC...................................................................................................................................................................12<br />
Coal Hollow Mine......................................................................................................................................................................................12<br />
DISTRIBUTION OF UTAH COAL.......................................................................................................................................................................12<br />
Electric Utility Market.................................................................................................................................................................................12<br />
<strong>Utah</strong>’s Electric Utility Market...............................................................................................................................................................12<br />
Out-<strong>of</strong>-State Electric Utility Market..................................................................................................................................................12<br />
Industrial Market...........................................................................................................................................................................................14<br />
<strong>Utah</strong>’s Industrial Market........................................................................................................................................................................14<br />
Out-<strong>of</strong>-State Industrial Market............................................................................................................................................................14<br />
Cogeneration Market...................................................................................................................................................................................14<br />
<strong>Utah</strong>’s Coking Coal Market.........................................................................................................................................................................17<br />
Residential <strong>and</strong> Commercial Markets...................................................................................................................................................17<br />
Foreign Exports..............................................................................................................................................................................................19<br />
COAL IMPORTED INTO UTAH..........................................................................................................................................................................19<br />
OUTLOOK FOR UTAH’S COAL INDUSTRY....................................................................................................................................................19<br />
Production........................................................................................................................................................................................................20<br />
Prices..................................................................................................................................................................................................................20<br />
Distribution <strong>and</strong> Consumption................................................................................................................................................................23<br />
Reserves.............................................................................................................................................................................................................24<br />
REFERENCES...........................................................................................................................................................................................................26<br />
APPENDIX ................................................................................................................................................................................................................27
FIGURES<br />
Figure 1. U.S. <strong>coal</strong> production by region, 1970–2035........................................................................................................................21<br />
Figure 2. Average mine-mouth price <strong>of</strong> U.S. <strong>coal</strong> by region, 1990–2035...................................................................................21<br />
Figure 3. Average mine-mouth price <strong>of</strong> Rocky Mountain <strong>and</strong> Powder River Basin <strong>coal</strong>, 2005–2035..........................22<br />
Figure 4. Average mine-mouth price <strong>of</strong> <strong>Utah</strong> <strong>coal</strong>, 1960–2010.....................................................................................................22<br />
Figure 5. U.S. <strong>coal</strong> consumption by sector, 1970–2035.....................................................................................................................23<br />
Figure 6. Consumption <strong>of</strong> <strong>coal</strong> in <strong>Utah</strong> by end use, 1960–2010....................................................................................................24<br />
Figure 7. Remaining estimated recoverable resources in <strong>Utah</strong> by <strong>coal</strong>field, 2009...............................................................25<br />
Figure 8. Net increase/loss <strong>of</strong> new <strong>coal</strong> tonnage leased in <strong>Utah</strong> compared to cumulative production, 1975–2009.......25<br />
Figure A1. Location <strong>and</strong> significance <strong>of</strong> <strong>Utah</strong> <strong>coal</strong>fields.......................................................................................................................34<br />
Figure A2. Location <strong>and</strong> status (at time <strong>of</strong> printing) <strong>of</strong> <strong>Utah</strong> <strong>coal</strong> mining operations............................................................35<br />
TABLES<br />
Table 1. U.S. <strong>coal</strong> production by state, 2008–2009................................................................................................................................ 2<br />
Table 2. <strong>Utah</strong> <strong>coal</strong> industry production, employment, productivity, prices, <strong>and</strong> revenue, 1960–2010.......................... 3<br />
Table 3. Coal mining employment in <strong>Utah</strong> by <strong>coal</strong> mine, 2001–2010........................................................................................... 4<br />
Table 4. Coal production in <strong>Utah</strong> by <strong>coal</strong>field, 1870–2010................................................................................................................ 6<br />
Table 5. Coal production <strong>and</strong> recoverable reserves in <strong>Utah</strong> by <strong>coal</strong> mine, 2001–2010......................................................... 7<br />
Table 6. Coal production in <strong>Utah</strong> by county, 1870–2010.................................................................................................................... 8<br />
Table 7. Coal production in <strong>Utah</strong> by l<strong>and</strong>ownership, 1980–2010.................................................................................................. 9<br />
Table 8. Distribution <strong>of</strong> <strong>Utah</strong> <strong>coal</strong>, 1981–2010.....................................................................................................................................13<br />
Table 9. Distribution <strong>of</strong> <strong>Utah</strong> <strong>coal</strong> by state, 2009.................................................................................................................................14<br />
Table 10. <strong>Utah</strong> <strong>and</strong> non-<strong>Utah</strong> <strong>coal</strong> purchases by select companies, 2003–2010.......................................................................15<br />
Table 11. Electricity generation <strong>and</strong> <strong>coal</strong> consumption at <strong>coal</strong> burning power plants in <strong>Utah</strong>, 1990–2010................16<br />
Table 12. Consumption <strong>of</strong> <strong>coal</strong> in <strong>Utah</strong> by end use, 1960–2010. ....................................................................................................18<br />
Table 13. <strong>Utah</strong> <strong>coal</strong> imports, 1981–2010...................................................................................................................................................19<br />
Table A1. U.S. <strong>coal</strong> production by region, 1970–2035...........................................................................................................................28<br />
Table A2. Average mine-mouth price <strong>of</strong> U.S. <strong>coal</strong> by region, 1990–2035.....................................................................................29<br />
Table A3. U.S. <strong>coal</strong> consumption by sector, 1970–2035.......................................................................................................................30<br />
Table A4. <strong>Utah</strong> <strong>coal</strong> resources by <strong>coal</strong>field, 2009....................................................................................................................................31<br />
Table A5. <strong>Utah</strong> <strong>coal</strong> resources by county, 2009........................................................................................................................................31<br />
Table A6. Net generation <strong>of</strong> electricity in <strong>Utah</strong> by energy source, 1960–2010..........................................................................32<br />
Table A7. Average <strong>coal</strong> quality at <strong>Utah</strong> mines, 2009..............................................................................................................................33
ANNUAL REVIEW AND FORECAST<br />
OF UTAH COAL PRODUCTION<br />
AND DISTRIBUTION—2009<br />
Final 2009 numbers <strong>and</strong> preliminary 2010 data<br />
EXECUTIVE SUMMARY<br />
<strong>Utah</strong> <strong>coal</strong> production for 2009 dropped 9.7% to 21.9 million<br />
tons, mostly due to decreased dem<strong>and</strong> as a result<br />
<strong>of</strong> the world-wide economic downturn. In fact, all <strong>Utah</strong><br />
<strong>coal</strong> mines, except the Emery mine, recorded production<br />
declines, some quite significant like Dugout Canyon (decline<br />
<strong>of</strong> 20.4%) <strong>and</strong> West Ridge (decline <strong>of</strong> 19.5%). Both<br />
<strong>of</strong> these mines are located in the Book Cliffs <strong>coal</strong>field <strong>and</strong><br />
are experiencing difficult mining conditions due to complicated<br />
geology <strong>and</strong> deep cover. In addition, the Bear<br />
Canyon mine closed in mid-2009 <strong>and</strong> is in the process <strong>of</strong><br />
being sold. Average employment for the year was similar<br />
to 2008, holding at 1954 employees, but is expected to decline<br />
significantly in 2010 to 1760 workers. The nominal<br />
price <strong>of</strong> <strong>coal</strong> remained at a 25-year high, averaging $28.40<br />
per ton, but is significantly below the inflation-adjusted<br />
price <strong>of</strong> $87.93 per ton recorded in 1976. Distribution <strong>of</strong><br />
<strong>Utah</strong> <strong>coal</strong> in 2009 also decreased with the poor economy,<br />
dropping 17.7% to 20.6 million tons, while out-<strong>of</strong>-state<br />
imports reached a record-high <strong>of</strong> 4.2 million tons, most <strong>of</strong><br />
which goes to the Bonanza Power Plant in eastern <strong>Utah</strong><br />
<strong>and</strong> the Intermountain Power Plant in central <strong>Utah</strong>.<br />
Forecast data indicate that <strong>Utah</strong>’s <strong>coal</strong> production may decrease<br />
by another 13% in 2010 to a total <strong>of</strong> 19.1 million<br />
tons; the first time <strong>Utah</strong> production could drop below 20<br />
million tons since 1988. Production declines are again anticipated<br />
from all operators except for a small increase at<br />
the Horizon mine. On a positive note, after over 10 years<br />
<strong>of</strong> permitting, the Lila Canyon mine produced its first <strong>coal</strong><br />
in June <strong>of</strong> 2010. Full production is still several years away,<br />
but the added tonnage, even during development, will help<br />
<strong>of</strong>fset lower production at other existing mines. <strong>Utah</strong> <strong>coal</strong><br />
distribution should follow the production’s downward<br />
trend <strong>and</strong> total 17.9 million tons in 2010, with imports<br />
decreasing to about 3.4 million tons. Despite 2009/2010’s<br />
economic downturn, the average price <strong>of</strong> <strong>Utah</strong> <strong>coal</strong> should<br />
remain near $28 per ton.<br />
Existing <strong>Utah</strong> mines are faced with steady reserve depletion<br />
<strong>and</strong> difficult mining conditions. As a result, operators<br />
are increasingly looking to new areas with slightly lower<br />
<strong>coal</strong> quality or farther from market to replenish their reserve<br />
base. As mentioned, <strong>Utah</strong>American Energy recently<br />
began construction <strong>and</strong> development work on the Lila<br />
Canyon mine in the southern part <strong>of</strong> the Book Cliffs <strong>coal</strong>field.<br />
Alton Coal Development received a permit (pending<br />
legal settlements <strong>and</strong> reclamation bond posting) to mine<br />
on private l<strong>and</strong> in the Alton <strong>coal</strong>field in southern <strong>Utah</strong>’s<br />
Kane County; an option to lease surrounding federal l<strong>and</strong><br />
is pending completion <strong>of</strong> an Environmental Impact Statement.<br />
Canyon Fuel was recently awarded the state-managed<br />
Cottonwood lease located in the Wasatch Plateau<br />
<strong>coal</strong>field <strong>and</strong> has nominated for lease the large Greens<br />
Hollow tract near the company’s SUFCO mine. Production<br />
from these new operations <strong>and</strong> lease tracts could <strong>of</strong>fset<br />
declining production from some existing mines <strong>and</strong> keep<br />
<strong>Utah</strong>’s production near 23 to 25 million tons—the norm<br />
for the past 15 years.<br />
Increased regulatory concerns over miner safety while extracting<br />
deeper <strong>coal</strong> may lead to changes in mine design<br />
(e.g., barrier pillars) that reduce the amount <strong>of</strong> <strong>coal</strong> that is<br />
permitted to be extracted. In order to maintain a sustainable<br />
industry, <strong>Utah</strong> <strong>coal</strong> mines are working with state <strong>and</strong><br />
federal regulators to both maximize miner safety <strong>and</strong> the<br />
amount <strong>of</strong> recoverable <strong>coal</strong>.<br />
Another area <strong>of</strong> concern for <strong>coal</strong> companies, which could<br />
curtail future dem<strong>and</strong>, is the possibility <strong>of</strong> carbon emission<br />
constraints. In fact, all proposed <strong>coal</strong>-fired power plants in<br />
<strong>Utah</strong> are on hold pending permit challenges or financing<br />
concerns. In the meantime, <strong>coal</strong> dem<strong>and</strong> in <strong>Utah</strong> will remain<br />
relatively steady as established <strong>coal</strong> plants continue<br />
to provide the state with relatively cheap, reliable power.<br />
UTAH COAL PRICES, EMPLOYMENT,<br />
AND PRODUCTION<br />
The U.S. Energy Information Administration (EIA) reported<br />
that U.S. <strong>coal</strong> production in 2009 decreased 8.5%<br />
to 1073 million tons, down from the record-setting 1172<br />
million tons produced in 2008 (table 1). This downturn re-
2<br />
Table 1. U.S. <strong>coal</strong> production by state, 2008–2009.<br />
Thous<strong>and</strong> short tons<br />
2009<br />
Rank<br />
State 2008 2009<br />
Percent<br />
Change<br />
1 Wyoming 467,644 430,669 -7.9%<br />
2 West Virginia 157,778 136,699 -13.4%<br />
3 Kentucky 120,323 106,105 -11.8%<br />
4 Pennsylvania 65,414 58,080 -11.2%<br />
5 Montana 44,786 39,486 -11.8%<br />
6 Indiana 35,893 36,555 1.8%<br />
7 Texas 39,017 35,091 -10.1%<br />
8 Illinois 32,918 33,761 2.6%<br />
9 North Dakota 29,627 29,945 1.1%<br />
10 Colorado 32,028 28,267 -11.7%<br />
11 Ohio 26,251 27,423 4.5%<br />
12 New Mexico 25,645 25,124 -2.0%<br />
13 <strong>Utah</strong> 24,275 21,927 -9.7%<br />
14 Virginia 24,712 20,516 -17.0%<br />
15 Alabama 20,611 18,772 -8.9%<br />
16 Arizona 8,025 7,474 -6.9%<br />
17 Louisiana 3,843 3,657 -4.8%<br />
18 Mississippi 2,842 3,440 21.0%<br />
19 Maryl<strong>and</strong> 2,860 2,305 -19.4%<br />
20 Tennessee 2,333 2,099 -10.0%<br />
21 Alaska 1,477 1,847 25.1%<br />
22 Oklahoma 1,463 956 -34.7%<br />
23 Missouri 247 452 83.0%<br />
24 Kansas 229 185 -19.2%<br />
25 Arkansas 69 5 -92.8%<br />
Refuse<br />
Recovery<br />
1,408 2,120 50.6%<br />
Appalachian 390,218 339,300 -13.0%<br />
Interior 146,586 146,802 0.1%<br />
Western 633,597 584,530 -7.7%<br />
East <strong>of</strong><br />
Mississippi R.<br />
West <strong>of</strong><br />
Mississippi R.<br />
491,935 445,775 -9.4%<br />
678,467 624,877 -7.9%<br />
U.S. Total 1,171,809 1,072,752 -8.5%<br />
Source: U.S. Energy Information Administration, Quarterly Coal Report,<br />
October–December 2009; <strong>Utah</strong> production from UGS <strong>coal</strong> company questionnaires<br />
Note: <strong>Utah</strong> production differs from EIA due to different reporting methods,<br />
but the overall totals match EIA data.<br />
sulted from 18 <strong>of</strong> the 25 <strong>coal</strong>-producing states having decreased<br />
production in 2009, including production declines<br />
from the top five producing states. Production in the Appalachian<br />
<strong>and</strong> Western Regions decreased by 13.0% <strong>and</strong><br />
7.7%, respectively, while production in the Interior Region<br />
increased slightly. Lower dem<strong>and</strong> from both industry <strong>and</strong><br />
electric utilities, related to the economic downturn, is seen<br />
as the major reason for decreases in production.<br />
<strong>Utah</strong> <strong>Geological</strong> <strong>Survey</strong><br />
<strong>Utah</strong>’s <strong>coal</strong> production followed suit, decreasing 9.7% in<br />
2009, down from 24,275,000 tons produced in 2008 to<br />
21,927,000 tons, ranking <strong>Utah</strong> as the 13th largest <strong>coal</strong>producing<br />
state. Forecasts for 2010 indicate another<br />
12.9% decrease in <strong>coal</strong> production to 19.1 million tons,<br />
the lowest total since 1988. Fortunately, the new Lila Canyon<br />
mine produced its first <strong>coal</strong> in spring 2010 while performing<br />
longwall development work. Full production is<br />
not expected to start until 2014, but even production from<br />
development work will help <strong>of</strong>fset lower production rates<br />
at other mines.<br />
Prices <strong>and</strong> Revenue<br />
The average mine-mouth price for <strong>Utah</strong> <strong>coal</strong> increased<br />
2.2% in 2009 from $27.78 per ton in 2008 to $28.40, the<br />
highest nominal price since 1984 (table 2). As recently as<br />
2003, the average <strong>Utah</strong> <strong>coal</strong> price was at a 30-year low <strong>of</strong><br />
$16.64 per ton in nominal dollars. Many <strong>Utah</strong> mines are<br />
unable to take advantage <strong>of</strong> the presently high spot price<br />
for <strong>coal</strong>, currently about $40.00 per ton, because their production<br />
is mostly committed to lower-priced contracts,<br />
thus reducing the overall average mine-mouth price. The<br />
average <strong>Utah</strong> <strong>coal</strong> price for 2010 is expected to decrease<br />
slightly to about $28.00 per ton. The recent price <strong>of</strong> <strong>Utah</strong><br />
<strong>coal</strong> is well below the highest inflation-adjusted price<br />
reached in 1976 <strong>of</strong> $87.93 (table 2).<br />
Revenues from <strong>coal</strong> produced in <strong>Utah</strong> decreased 7.7%,<br />
from a record-high $674 million in nominal dollars<br />
reached in 2008 to $623 million in 2009, based solely on<br />
the decrease in production. The 2009 value is well below<br />
the inflation-adjusted high <strong>of</strong> $1.1 billion reached in 1982.<br />
Another significant decrease in production in 2010, along<br />
with slightly lower prices, will push estimated <strong>coal</strong> revenues<br />
down an additional 14.1% to $535 million.<br />
Employment<br />
During 2009, the number <strong>of</strong> active mines dropped from 9<br />
to 8, <strong>and</strong> the total number <strong>of</strong> employees decreased from<br />
1973 to 1954 (table 2). All mines increased employment<br />
or remained steady, except C.W. Mining, which closed the<br />
Bear Canyon mine halfway through 2009 (table 3). During<br />
2010, the average employment at active mines is expected<br />
to drop to about 1760 employees, mostly attributed to the<br />
closure <strong>of</strong> the Bear Canyon mine. The Skyline, SUFCO, <strong>and</strong><br />
Emery mines expect steady employment, but the Deer<br />
Creek, West Ridge, <strong>and</strong> Dugout mines project a decrease<br />
in the number <strong>of</strong> workers. In contrast, the Horizon mine<br />
anticipates adding roughly 30 new employees in 2010 <strong>and</strong><br />
the newly-opened Lila Canyon mine will also be adding<br />
workers.
<strong>Annual</strong> <strong>review</strong> <strong>and</strong> <strong>forecast</strong> <strong>of</strong> <strong>Utah</strong> <strong>coal</strong> production <strong>and</strong> distribution—2009 3<br />
Table 2. <strong>Utah</strong> <strong>coal</strong> industry production, employment, productivity, prices, <strong>and</strong> revenue, 1960–2010.<br />
Year<br />
Production<br />
Thous<strong>and</strong><br />
short tons<br />
# <strong>of</strong><br />
Operators<br />
# <strong>of</strong><br />
Mines<br />
Employment 1<br />
# <strong>of</strong> employees<br />
Productivity<br />
Tons/<br />
employee-hour<br />
Average Mine-mouth<br />
Price<br />
$/Ton<br />
(nominal<br />
dollars)<br />
$/Ton<br />
(real 2010<br />
dollars)<br />
Million $<br />
(nominal<br />
dollars)<br />
Revenue<br />
Million $<br />
(real 2010<br />
dollars)<br />
1960 4,955 na 45 2,418 na 6.35 46.81 31.5 231.9<br />
1961 5,159 na 50 2,206 na 6.03 44.00 31.1 227.0<br />
1962 4,297 na 38 2,034 na 5.40 39.02 23.2 167.7<br />
1963 4,359 na 36 1,596 na 5.22 37.22 22.8 162.3<br />
1964 4,720 na 35 1,679 na 7.03 49.48 33.2 233.6<br />
1965 4,992 na 31 1,495 na 6.37 44.12 31.8 220.3<br />
1966 4,636 na 25 1,374 na 5.77 38.86 26.7 180.1<br />
1967 4,174 na 24 1,238 na 5.82 38.02 24.3 158.7<br />
1968 4,317 na 23 1,155 na 5.77 36.18 24.9 156.2<br />
1969 4,657 na 21 1,193 na 6.31 37.52 29.4 174.7<br />
1970 4,733 na 20 1,469 na 7.28 40.94 34.5 193.8<br />
1971 4,626 na 22 1,430 na 7.37 39.71 34.1 183.7<br />
1972 4,802 na 22 1,582 na 8.93 46.62 42.9 223.8<br />
1973 5,650 na 16 1,603 na 11.19 54.99 63.2 310.7<br />
1974 6,046 na 15 1,514 na 12.24 54.17 74.0 327.5<br />
1975 6,937 na 20 2,550 na 19.84 80.47 137.6 558.2<br />
1976 7,968 na 24 2,614 na 22.93 87.93 182.7 700.6<br />
1977 8,838 na 26 2,703 na 20.32 73.17 179.6 646.6<br />
1978 9,253 na 28 3,424 na 21.52 72.02 199.1 666.4<br />
1979 12,096 na 25 3,656 na 22.71 68.26 274.7 825.6<br />
1980 13,236 na 29 3,512 na 25.63 67.87 339.2 898.3<br />
1981 13,808 16 28 4,166 1.99 26.87 64.50 371.0 890.6<br />
1982 16,912 16 29 4,296 2.05 29.42 66.52 497.6 1,125.0<br />
1983 11,829 15 25 2,707 2.30 28.32 62.04 335.0 733.9<br />
1984 12,259 15 24 2,525 2.55 29.20 61.32 358.0 751.8<br />
1985 12,831 15 22 2,563 2.38 27.69 56.15 355.3 720.5<br />
1986 14,269 16 21 2,881 2.59 27.64 55.03 394.4 785.2<br />
1987 16,521 16 20 2,650 3.38 25.67 49.31 424.1 814.6<br />
1988 18,164 14 17 2,559 3.74 22.85 42.15 415.0 765.5<br />
1989 20,517 14 20 2,471 4.25 22.01 38.73 451.6 794.6<br />
1990 22,012 13 18 2,791 4.44 21.78 36.36 479.4 800.4<br />
1991 21,875 11 16 2,292 4.55 21.56 34.54 471.6 755.6<br />
1992 21,015 10 16 2,106 5.09 21.83 33.95 458.8 713.5<br />
1993 21,723 9 15 2,161 5.42 21.17 31.97 459.9 694.4<br />
1994 24,422 8 14 2,024 6.20 20.07 29.55 490.1 721.7<br />
1995 25,051 7 14 1,989 6.54 19.11 27.36 478.7 685.4<br />
1996 27,071 7 13 2,077 6.77 18.50 25.73 500.8 696.5<br />
1997 26,428 8 16 2,091 6.01 18.34 24.93 484.7 658.9<br />
1998 26,600 8 17 1,950 6.23 17.83 23.87 474.3 634.9<br />
1999 26,491 8 15 1,843 6.71 17.36 22.74 459.9 602.3<br />
2000 26,920 8 13 1,672 7.54 16.93 21.45 455.8 577.5<br />
2001 27,024 7 13 1,564 6.50 17.76 21.88 479.9 591.3<br />
2002 25,299 8 13 1,525 7.73 18.47 22.40 467.3 566.8<br />
2003 23,069 9 14 1,595 7.30 16.64 19.73 383.9 455.2<br />
2004 21,818 8 13 1,523 6.78 17.70 20.45 386.2 446.1<br />
2005 24,556 8 13 1,803 6.44 19.34 21.61 474.9 530.6<br />
2006 26,131 8 13 1,994 6.18 22.51 24.36 588.2 636.6<br />
2007 24,288 8 10 1,888 5.88 25.18 26.50 611.6 643.7<br />
2008 24,275 7 9 1,973 5.87 27.78 28.15 674.4 683.5<br />
2009 21,927 6 8 1,954 5.36 28.40 28.89 622.7 633.5<br />
2010* 19,095 6 8 1,760 5.64 28.00 28.00 534.7 534.7<br />
Source: UGS <strong>coal</strong> company questionnaires<br />
1<br />
Includes only active <strong>Utah</strong> <strong>coal</strong> mines <strong>and</strong> their associated operations<br />
*Forecast
4<br />
<strong>Utah</strong> <strong>Geological</strong> <strong>Survey</strong><br />
Table 3. Coal mining employment in <strong>Utah</strong> by <strong>coal</strong> mine, 2001–2010.<br />
Number <strong>of</strong> employees<br />
Company Mine County 2001 2002 2003 2004 2005 2006 2007 2008 2009 2010*<br />
<strong>Utah</strong>American Energy, Inc. -<br />
Murray Energy Corp.<br />
Aberdeen/Pinnacle 1<br />
Lila Canyon<br />
Carbon<br />
Emery<br />
32<br />
--<br />
116<br />
--<br />
136<br />
--<br />
134<br />
--<br />
166<br />
--<br />
219<br />
--<br />
163<br />
--<br />
58<br />
--<br />
--<br />
--<br />
--<br />
22<br />
Canyon Fuel, LLC -<br />
Arch Coal, Inc.<br />
Dugout Canyon<br />
Skyline #3<br />
SUFCO<br />
Carbon<br />
Emery/Carbon<br />
Sevier<br />
77<br />
351<br />
273<br />
121<br />
234<br />
275<br />
171<br />
183<br />
291<br />
206<br />
38<br />
295<br />
217<br />
120<br />
303<br />
231<br />
185<br />
337<br />
229<br />
197<br />
368<br />
247<br />
210<br />
365<br />
270<br />
218<br />
375<br />
237<br />
216<br />
370<br />
CONSOL Energy Emery Emery 3 61 60 116 130 140 140 144 171 175<br />
C.W. Mining 2 Bear Canyon #1, #3, #4 Emery 134 138 156 45 115 121 76 217 146 4<br />
Energy West Mining Co. Deer Creek<br />
Trail Mountain<br />
Emery<br />
Emery<br />
335<br />
71<br />
331<br />
--<br />
341<br />
--<br />
354<br />
--<br />
362<br />
--<br />
358<br />
--<br />
356<br />
--<br />
358<br />
--<br />
353<br />
--<br />
329<br />
--<br />
GENWAL Resources, Inc. - <strong>Utah</strong> American<br />
Energy, Inc., Intermountain Power Agency<br />
Cr<strong>and</strong>all Canyon/ South Cr<strong>and</strong>all<br />
Canyon<br />
Emery 124 98 73 141 197 154 54 -- -- --<br />
3<br />
Hidden Splendor Resources, Inc. -<br />
America West Resources, Inc.<br />
Horizon 4 Carbon 16 29 45 45 44 60 76 97 100 132<br />
Lodestar Energy, Inc. Whisky Creek #1<br />
White Oak #2<br />
Carbon<br />
Carbon<br />
--<br />
48<br />
21<br />
--<br />
22<br />
--<br />
--<br />
--<br />
--<br />
--<br />
--<br />
--<br />
--<br />
--<br />
--<br />
--<br />
--<br />
--<br />
--<br />
--<br />
WEST RIDGE Resources, Inc. - <strong>Utah</strong><br />
American Energy, Inc., Intermountain<br />
Power Agency<br />
West Ridge 3 Carbon 100 101 117 149 149 189 229 277 321 275<br />
Total 1,564 1,525 1,595 1,523 1,803 1,994 1,888 1,973 1,954 1,760<br />
Source: UGS <strong>coal</strong> company questionnaires<br />
1 Owned by Andalex Resources, Inc. until fall 2006<br />
2 Currently in bankruptcy <strong>and</strong> in the process <strong>of</strong> being sold<br />
3 Partially owned by Andalex Resources, Inc. until fall 2006<br />
4 Owned by Lodestar in 2001<br />
*Forecast
<strong>Annual</strong> <strong>review</strong> <strong>and</strong> <strong>forecast</strong> <strong>of</strong> <strong>Utah</strong> <strong>coal</strong> production <strong>and</strong> distribution—2009 5<br />
Coal Mining Productivity<br />
Production efficiency at <strong>Utah</strong> <strong>coal</strong> mines decreased in<br />
2009 to 5.36 tons per employee-hour. This decrease was<br />
the result <strong>of</strong> significantly lower production, but near<br />
steady employment (table 2). The SUFCO mine remains<br />
the state’s most productive, producing 8.7 tons per employee-hour,<br />
albeit lower than 2006’s productivity <strong>of</strong><br />
11.9 tons per employee-hour. The Deer Creek <strong>and</strong> Skyline<br />
mines rank second <strong>and</strong> third in productivity at 6.3 <strong>and</strong> 5.6<br />
tons per employee-hour, respectively. The Emery mine<br />
had the highest productivity, 3.3 tons per employee-hour,<br />
among mines that rely only on continuous miner equipment.<br />
<strong>Utah</strong>’s 2009 productivity is less than the 2008 average<br />
<strong>of</strong> 6.5 tons per employee-hour for underground mines<br />
in the western United States (EIA, 2008 <strong>Annual</strong> Coal Report).<br />
Forecast data indicate that mining productivity in<br />
<strong>Utah</strong> should increase in 2010 to 5.6 tons per employee per<br />
hour due to large decreases in employment.<br />
On average, each employee produced 11,200 tons during<br />
2009, down from 12,300 tons in 2008, <strong>and</strong> lower than the<br />
1990s’ average <strong>of</strong> 11,600 tons per employee, but still much<br />
higher than the 1980s’ average <strong>of</strong> 5,300 tons per employee.<br />
Employee production was highest in 2002 when productivity<br />
reached 7.7 tons per employee-hour <strong>and</strong> each<br />
employee produced an average 16,600 tons.<br />
Production By Coalfield<br />
Coal production from the Wasatch Plateau <strong>coal</strong>field decreased<br />
by 4.7% in 2009 but still accounted for 65.4% <strong>of</strong><br />
<strong>Utah</strong>’s total production for the year (table 4). Production<br />
declines were recorded at all five Wasatch Plateau mines:<br />
Skyline decreased by 6.7%, SUFCO by 2.8%, Deer Creek by<br />
1.2%, Horizon by 15.3%, <strong>and</strong> the Bear Canyon #4 mine,<br />
which closed part way through the year, declined by 25.1%<br />
(table 5). Wasatch Plateau production is expected to decrease<br />
by an additional 12% in 2010 due to the closure <strong>of</strong><br />
the Bear Canyon mine <strong>and</strong> three months <strong>of</strong> longwall maintenance<br />
at Deer Creek.<br />
The Book Cliffs <strong>coal</strong>field, with only two actively producing<br />
mines in 2009, accounted for 29.0% <strong>of</strong> total production,<br />
down from 33.7% the year before (table 4). Overall,<br />
production from these mines decreased by 22.4% to 6.4<br />
million tons <strong>and</strong> is expected to decrease again in 2010<br />
by another 14.3%. Canyon Fuel’s Dugout mine decreased<br />
production from 4.1 million tons in 2008 to 3.3 million<br />
tons in 2009, <strong>and</strong> is projected to produce only 2.8 million<br />
tons in 2010. West Ridge mine production peaked in 2007<br />
at 4.2 million tons before declining to 3.8 million tons in<br />
2008 <strong>and</strong> to 3.1 million tons in 2009. Production at the<br />
West Ridge mine is expected to decline again in 2010 to<br />
2.6 million tons. On a positive note, the new Lila Canyon<br />
mine reached the <strong>coal</strong> bed in spring <strong>of</strong> 2010, producing its<br />
first <strong>coal</strong>. Total <strong>coal</strong> production at Lila Canyon for 2010 is<br />
estimated at 45,000 tons, with first longwall <strong>coal</strong> scheduled<br />
for 2014.<br />
Coal production resumed in the Emery <strong>coal</strong>field in 2002<br />
with the reopening <strong>of</strong> the Emery mine (table 4). This mine<br />
produced 243,000 tons in 2003 before closing in August <strong>of</strong><br />
that year due to contract <strong>and</strong> ownership issues. The Emery<br />
mine reopened in August <strong>of</strong> 2004 <strong>and</strong> produced 256,000<br />
tons. Mining has been continuous from 2005 to 2009, with<br />
an average annual production <strong>of</strong> 1.1 million tons. The<br />
Emery <strong>coal</strong>field produced 5.6% <strong>of</strong> <strong>Utah</strong>’s <strong>coal</strong> during 2009.<br />
The remainder <strong>of</strong> <strong>Utah</strong>’s <strong>coal</strong>fields are inactive, as they<br />
have been for many years (table 4). Several fields, such as<br />
the Kaiparowits Plateau, which holds an estimated 9.1 billion<br />
tons <strong>of</strong> recoverable <strong>coal</strong> (see appendix table A4), cannot<br />
be mined because <strong>of</strong> l<strong>and</strong>-use restrictions <strong>and</strong>/or the<br />
fields are too remote for economical transport to market.<br />
However, a new surface mine has been proposed for the<br />
Alton <strong>coal</strong>field in southern <strong>Utah</strong>’s Kane County. This mine<br />
has the potential to produce up to two million tons <strong>of</strong> <strong>coal</strong><br />
per year.<br />
Production By County<br />
Carbon County led all counties in <strong>coal</strong> production in 2009,<br />
reaching 9.5 million tons, 43.1% <strong>of</strong> <strong>Utah</strong>’s total, down from<br />
11.5 million tons in 2008 (table 6). Across the board production<br />
declines at Carbon County mines led to the lower<br />
production totals. The mines in Emery County maintained<br />
production near 5.7 million tons in 2009, 26.1% <strong>of</strong> <strong>Utah</strong>’s<br />
total, but well below the county’s peak production <strong>of</strong><br />
17.3 million tons in 1995. Emery County <strong>coal</strong> production<br />
should rebound somewhat with the opening <strong>of</strong> the Lila<br />
Canyon mine. Sevier County’s only active mine, SUFCO,<br />
decreased production to 6.7 million tons in 2009, accounting<br />
for 30.8% <strong>of</strong> <strong>Utah</strong>’s total <strong>coal</strong> production. Forecast<br />
production data for 2010 estimates a 10% decrease for<br />
Carbon County mines to 8.6 million tons, a 31% decrease<br />
for Emery County mines to 3.9 million tons, <strong>and</strong> a 2.2%<br />
decrease from Sevier County’s SUFCO mine.<br />
Production By L<strong>and</strong>ownership<br />
Federal leases continued to provide the majority share <strong>of</strong><br />
<strong>Utah</strong>’s production as mines on U.S. Bureau <strong>of</strong> L<strong>and</strong> Management<br />
(BLM) <strong>and</strong> U.S. Forest Service l<strong>and</strong> accounted for<br />
10.7 million tons, or 48.7%, <strong>of</strong> the state’s total <strong>coal</strong> production<br />
in 2009 (table 7). This percentage has decreased<br />
since 2004 when production from federal leases made up<br />
92.9% <strong>of</strong> total <strong>coal</strong> production. The percentage is expected<br />
to increase in 2010 to 50.1% even though the federal <strong>coal</strong><br />
production will continue to decline.<br />
L<strong>and</strong>s owned by the State <strong>of</strong> <strong>Utah</strong> supplied a record-high
6<br />
<strong>Utah</strong> <strong>Geological</strong> <strong>Survey</strong><br />
Table 4. Coal production in <strong>Utah</strong> by <strong>coal</strong>field, 1870–2010.<br />
Thous<strong>and</strong> short tons<br />
Year<br />
Wasatch<br />
Plateau<br />
Book Cliffs Emery Sego Coalville Others Total<br />
1870–1981 166,404 234,547 5,723 2,654 4,262 3,095 416,685<br />
1982 12,342 3,718 852 0 0 0 16,912<br />
1983 10,173 1,568 88 0 0 0 11,829<br />
1984 10,266 1,993 0 0 0 0 12,259<br />
1985 9,386 2,805 640 0 0 0 12,831<br />
1986 10,906 2,860 503 0 0 0 14,269<br />
1987 13,871 2,348 269 0 33 0 16,521<br />
1988 15,218 2,363 548 0 35 0 18,164<br />
1989 17,146 2,785 586 0 0 0 20,517<br />
1990 18,591 3,085 336 0 0 0 22,012<br />
1991 18,934 2,941 0 0 0 0 21,875<br />
1992 18,631 2,384 0 0 0 0 21,015<br />
1993 19,399 2,324 0 0 0 0 21,723<br />
1994 22,079 2,343 0 0 0 0 24,422<br />
1995 22,631 2,420 0 0 0 0 25,051<br />
1996 23,616 3,455 0 0 0 0 27,071<br />
1997 22,916 3,512 0 0 0 0 26,428<br />
1998 22,708 3,892 0 0 0 0 26,600<br />
1999 23,572 2,919 0 0 0 0 26,491<br />
2000 22,967 3,953 0 0 0 0 26,920<br />
2001 21,919 5,106 0 0 0 0 27,024<br />
2002 19,654 5,619 26 0 0 0 25,299<br />
2003 15,868 6,958 243 0 0 0 23,069<br />
2004 13,082 8,479 256 0 0 0 21,818<br />
2005 14,442 8,927 1,187 0 0 0 24,556<br />
2006 15,532 9,545 1,054 0 0 0 26,131<br />
2007 14,241 9,021 1,026 0 0 0 24,288<br />
2008 15,041 8,184 1,050 0 0 0 24,275<br />
2009 14,336 6,354 1,238 0 0 0 21,927<br />
2010* 12,550 5,445 1,100 0 0 0 19,095<br />
Cumulative<br />
Production<br />
645,871 356,408 15,625 2,654 4,330 3,095 1,027,983<br />
Source: UGS <strong>coal</strong> company questionnaires<br />
*Forecast, 2010 values not included in cumulative totals<br />
10.1 million tons <strong>of</strong> <strong>coal</strong> in 2009 accounting for 45.9% <strong>of</strong><br />
total state production, up significantly from just 3.9% in<br />
2004. This increase was the result <strong>of</strong> steady longwall production<br />
from Deer Creek’s state-owned Mill Fork tract, as<br />
well as significant increases in production on state l<strong>and</strong><br />
at Dugout Canyon, West Ridge, <strong>and</strong> SUFCO. Production on<br />
state l<strong>and</strong>s is expected to decrease in 2010 to about 8.5<br />
million tons, or 44.5% <strong>of</strong> the state’s total, as Dugout, West<br />
Ridge, <strong>and</strong> SUFCO decrease their production.<br />
Production on private (fee) l<strong>and</strong> decreased slightly from<br />
1.2 million tons in 2008 to 1.1 million tons in 2009, 5.2%<br />
<strong>of</strong> <strong>Utah</strong>’s total. Fee <strong>coal</strong> in 2009 was produced from the<br />
Emery, Bear Canyon, SUFCO, <strong>and</strong> Horizon mines. Coal production<br />
on private l<strong>and</strong> is expected to remain steady at 1.0<br />
million tons in 2010.<br />
ACTIVITIES OF UTAH COAL OPERATORS<br />
<strong>Utah</strong> <strong>coal</strong> production decreased by 9.7% in 2009 to 21.9<br />
million tons as dem<strong>and</strong> slowed due to the weakened U.S.<br />
economy. In fact, all mines except the Emery mine recorded<br />
decreased production. With the mid-2009 closure<br />
<strong>of</strong> the Bear Canyon mine <strong>and</strong> further production losses at<br />
most other mines, <strong>Utah</strong>’s 2010 <strong>coal</strong> production is projected<br />
to drop to 19.1 million tons, the first time production<br />
has dropped below 20 million tons since 1988.<br />
One positive note to report, following a decade <strong>of</strong> planning,<br />
<strong>Utah</strong>American has begun development on the Lila<br />
Canyon mine in the southern portion <strong>of</strong> the Book Cliffs<br />
<strong>coal</strong>field in Emery County. Miners entered the <strong>coal</strong> seam<br />
in June 2010 <strong>and</strong> are expected to produce about 45,000
<strong>Annual</strong> <strong>review</strong> <strong>and</strong> <strong>forecast</strong> <strong>of</strong> <strong>Utah</strong> <strong>coal</strong> production <strong>and</strong> distribution—2009 7<br />
Table 5. Coal production <strong>and</strong> recoverable reserves in <strong>Utah</strong> by <strong>coal</strong> mine, 2001–2010.<br />
Thous<strong>and</strong> short tons<br />
Company Mine County Coalfield 2001 2002 2003 2004 2005 2006 2007 2008 2009 2010*<br />
Estimated recoverable<br />
reserves currently<br />
under lease at active<br />
mines<br />
<strong>Utah</strong>American Energy, Inc. -<br />
Murray Energy Corp.<br />
Aberdeen 1<br />
Pinnacle 1<br />
Lila Canyon<br />
Carbon<br />
Carbon<br />
Emery<br />
Book Cliffs<br />
Book Cliffs<br />
Book Cliffs<br />
531<br />
296<br />
--<br />
37<br />
662<br />
--<br />
444<br />
584<br />
--<br />
1,984<br />
419<br />
--<br />
1,519<br />
189<br />
--<br />
2,103<br />
8<br />
--<br />
1,044<br />
--<br />
--<br />
242<br />
--<br />
--<br />
--<br />
--<br />
--<br />
--<br />
--<br />
45<br />
--<br />
--<br />
26,000<br />
Canyon Fuel, LLC -<br />
Arch Coal, Inc.<br />
Dugout Canyon<br />
Skyline #3 2<br />
SUFCO<br />
Carbon<br />
Emery/Carbon<br />
Sevier<br />
Book Cliffs<br />
Wasatch Plateau<br />
Wasatch Plateau<br />
1,981<br />
3,822<br />
7,001<br />
2,080<br />
3,477<br />
7,600<br />
2,941<br />
2,771<br />
7,126<br />
3,811<br />
551<br />
7,568<br />
4,592<br />
405<br />
7,567<br />
4,335<br />
1,759<br />
7,908<br />
3,816<br />
2,558<br />
6,712<br />
4,135<br />
3,120<br />
6,946<br />
3,291<br />
2,910<br />
6,748<br />
2,800<br />
2,900<br />
6,600<br />
19,800<br />
19,200<br />
66,200<br />
CONSOL Energy Emery Emery Emery -- 26 243 256 1,187 1,054 1,026 1,050 1,238 1,100 16,900<br />
C.W. Mining 3 Bear Canyon #3<br />
Bear Canyon #4<br />
Bear Canyon #1<br />
Emery<br />
Emery<br />
Emery<br />
Wasatch Plateau<br />
Wasatch Plateau<br />
Wasatch Plateau<br />
--<br />
--<br />
1,254<br />
4<br />
--<br />
953<br />
310<br />
--<br />
403<br />
227<br />
112<br />
--<br />
304<br />
151<br />
--<br />
27<br />
462<br />
--<br />
--<br />
653<br />
--<br />
--<br />
868<br />
--<br />
--<br />
651<br />
--<br />
--<br />
--<br />
--<br />
--<br />
--<br />
--<br />
Energy West Mining Co. Deer Creek<br />
Trail Mountain<br />
Emery<br />
Emery<br />
Wasatch Plateau<br />
Wasatch Plateau<br />
4,338<br />
924<br />
3,984<br />
--<br />
3,938<br />
--<br />
3,356<br />
--<br />
3,910<br />
--<br />
3,748<br />
--<br />
3,685<br />
--<br />
3,878<br />
--<br />
3,833<br />
--<br />
2,800 26,600<br />
--<br />
GENWAL Resources, Inc. -<br />
<strong>Utah</strong>American Energy, Inc.,<br />
Intermountain Power Agency<br />
Cr<strong>and</strong>all Canyon 4<br />
Emery<br />
South Cr<strong>and</strong>all Canyon 4 Emery<br />
Wasatch Plateau<br />
Wasatch Plateau<br />
3,996<br />
--<br />
3,248<br />
--<br />
1,161<br />
26<br />
872<br />
103<br />
1,593<br />
225<br />
613<br />
759<br />
400<br />
--<br />
--<br />
--<br />
--<br />
--<br />
--<br />
--<br />
--<br />
--<br />
Hidden Splendor<br />
Resources, Inc. -<br />
America West Resources, Inc.<br />
Horizon 5 Carbon Wasatch Plateau 23 110 108 293 286 257 233 229 194 250 13,800<br />
Lodestar Energy, Inc. Whisky Creek #1<br />
White Oak #2<br />
Carbon<br />
Carbon<br />
Wasatch Plateau<br />
Wasatch Plateau<br />
--<br />
560<br />
278<br />
--<br />
25<br />
--<br />
--<br />
--<br />
--<br />
--<br />
--<br />
--<br />
--<br />
--<br />
--<br />
--<br />
--<br />
--<br />
--<br />
--<br />
--<br />
--<br />
WEST RIDGE Resources, Inc. -<br />
<strong>Utah</strong> American Energy, Inc.,<br />
Intermountain Power Agency<br />
West Ridge 4 Carbon Book Cliffs 2,298 2,840 2,989 2,265 2,627 3,098 4,160 3,807 3,063 2,600 14,000<br />
Total 27,024 25,299 23,069 21,818 24,556 26,131 24,288 24,275 21,927 19,095 202,500<br />
Source: UGS <strong>coal</strong> company questionnaires<br />
1 Owned by Andalex Resources, Inc., until fall 2006<br />
2 Mined in Emery County in 2004 <strong>and</strong> before <strong>and</strong> in Carbon County in 2005 <strong>and</strong> beyond<br />
3 Currently in bankruptcy <strong>and</strong> in the process <strong>of</strong> being sold<br />
4 Partially owned by Andalex Resources, Inc., until fall 2006<br />
5 Owned by Lodestar in 2001<br />
*Forecast
8<br />
<strong>Utah</strong> <strong>Geological</strong> <strong>Survey</strong><br />
Table 6. Coal production in <strong>Utah</strong> by county, 1870–2010.<br />
Thous<strong>and</strong> short tons<br />
Year Carbon Emery Sevier Summit Iron Kane Others Total<br />
1870–1959 211,028 49,166 4,046 4,012 521 45 3,608 272,426<br />
1960 3,698 1,137 49 20 50 0 1 4,955<br />
1961 3,916 1,124 47 20 52 0 0 5,159<br />
1962 3,105 1,077 49 20 46 0 0 4,297<br />
1963 3,493 752 47 18 48 1 0 4,359<br />
1964 3,752 848 47 17 54 2 0 4,720<br />
1965 3,779 1,101 61 13 36 2 0 4,992<br />
1966 3,380 1,170 65 15 4 2 0 4,636<br />
1967 2,971 1,113 72 13 3 2 0 4,174<br />
1968 3,062 1,167 70 13 3 2 0 4,317<br />
1969 3,367 1,200 72 12 4 2 0 4,657<br />
1970 3,349 1,292 79 13 0 0 0 4,733<br />
1971 3,347 1,097 158 12 0 12 0 4,626<br />
1972 2,956 1,656 184 6 0 0 0 4,802<br />
1973 2,866 2,445 339 0 0 0 0 5,650<br />
1974 2,754 2,901 391 0 0 0 0 6,046<br />
1975 2,984 3,126 827 0 0 0 0 6,937<br />
1976 3,868 3,057 1,043 0 0 0 0 7,968<br />
1977 4,390 3,107 1,337 0 0 0 4 8,838<br />
1978 4,005 3,640 1,558 0 0 0 50 9,253<br />
1979 5,292 5,147 1,657 0 0 0 0 12,096<br />
1980 5,096 6,319 1,821 0 0 0 0 13,236<br />
1981 6,123 5,609 2,076 0 0 0 0 13,808<br />
1982 8,335 6,329 2,248 0 0 0 0 16,912<br />
1983 4,194 5,404 2,231 0 0 0 0 11,829<br />
1984 5,293 4,825 2,141 0 0 0 0 12,259<br />
1985 6,518 4,516 1,797 0 0 0 0 12,831<br />
1986 6,505 5,404 2,360 0 0 0 0 14,269<br />
1987 7,495 6,765 2,228 33 0 0 0 16,521<br />
1988 7,703 7,801 2,625 35 0 0 0 18,164<br />
1989 8,927 8,531 3,059 0 0 0 0 20,517<br />
1990 8,810 10,315 2,887 0 0 0 0 22,012<br />
1991 5,816 12,980 3,079 0 0 0 0 21,875<br />
1992 3,386 15,049 2,580 0 0 0 0 21,015<br />
1993 2,642 15,528 3,553 0 0 0 0 21,723<br />
1994 4,523 16,330 3,569 0 0 0 0 24,422<br />
1995 3,801 17,344 3,906 0 0 0 0 25,051<br />
1996 5,985 16,872 4,214 0 0 0 0 27,071<br />
1997 6,956 14,533 4,939 0 0 0 0 26,428<br />
1998 7,206 13,675 5,719 0 0 0 0 26,600<br />
1999 4,514 16,214 5,763 0 0 0 0 26,491<br />
2000 4,615 16,399 5,906 0 0 0 0 26,920<br />
2001 5,689 14,334 7,001 0 0 0 0 27,024<br />
2002 6,007 11,692 7,600 0 0 0 0 25,299<br />
2003 7,091 8,852 7,126 0 0 0 0 23,069<br />
2004 8,772 5,477 7,568 0 0 0 0 21,818<br />
2005 9,618 7,372 7,567 0 0 0 0 24,556<br />
2006 11,560 6,662 7,908 0 0 0 0 26,131<br />
2007 11,811 5,765 6,712 0 0 0 0 24,288<br />
2008 11,533 5,796 6,946 0 0 0 0 24,275<br />
2009 9,457 5,722 6,748 0 0 0 0 21,927<br />
2010* 8,550 3,945 6,600 0 0 0 0 19,095<br />
Cumulative<br />
Production<br />
487,344 385,737 146,075 4,272 821 70 3,663 1,027,983<br />
Source: UGS <strong>coal</strong> company questionnaires<br />
*Forecast, 2010 values not included in cumulative totals
<strong>Annual</strong> <strong>review</strong> <strong>and</strong> <strong>forecast</strong> <strong>of</strong> <strong>Utah</strong> <strong>coal</strong> production <strong>and</strong> distribution—2009 9<br />
Table 7. Coal production in <strong>Utah</strong> by l<strong>and</strong>ownership, 1980–2010.<br />
Thous<strong>and</strong> short tons<br />
Year<br />
Federal<br />
L<strong>and</strong> % <strong>of</strong> Total State<br />
L<strong>and</strong> % <strong>of</strong> Total County<br />
L<strong>and</strong><br />
% <strong>of</strong> Total Fee L<strong>and</strong> % <strong>of</strong> Total Total<br />
1980 8,663 65.5% 1,105 8.3% 0 0.0% 3,468 26.2% 13,236<br />
1981 8,719 63.1% 929 6.7% 0 0.0% 4,160 30.1% 13,808<br />
1982 10,925 64.6% 998 5.9% 0 0.0% 4,989 29.5% 16,912<br />
1983 6,725 56.9% 419 3.5% 0 0.0% 4,685 39.6% 11,829<br />
1984 8,096 66.0% 285 2.3% 0 0.0% 3,878 31.6% 12,259<br />
1985 9,178 71.5% 510 4.0% 0 0.0% 3,143 24.5% 12,831<br />
1986 11,075 77.6% 502 3.5% 0 0.0% 2,692 18.9% 14,269<br />
1987 13,343 80.8% 488 3.0% 0 0.0% 2,690 16.3% 16,521<br />
1988 15,887 87.5% 263 1.4% 0 0.0% 2,014 11.1% 18,164<br />
1989 16,931 82.5% 375 1.8% 153 0.7% 3,058 14.9% 20,517<br />
1990 17,136 77.8% 794 3.6% 606 2.8% 3,476 15.8% 22,012<br />
1991 18,425 84.2% 942 4.3% 144 0.7% 2,364 10.8% 21,875<br />
1992 17,760 84.5% 1,384 6.6% 136 0.6% 1,735 8.3% 21,015<br />
1993 19,099 87.9% 1,682 7.7% 116 0.5% 826 3.8% 21,723<br />
1994 22,537 92.3% 1,227 5.0% 243 1.0% 415 1.7% 24,422<br />
1995 23,730 94.7% 571 2.3% 289 1.2% 461 1.8% 25,051<br />
1996 25,996 96.0% 446 1.6% 15 0.1% 614 2.3% 27,071<br />
1997 25,161 95.2% 339 1.3% 0 0.0% 928 3.5% 26,428<br />
1998 24,954 93.8% 297 1.1% 37 0.1% 1,312 4.9% 26,600<br />
1999 21,982 83.0% 3,071 11.6% 65 0.2% 1,373 5.2% 26,491<br />
2000 20,812 77.3% 4,021 14.9% 0 0.0% 2,087 7.8% 26,920<br />
2001 18,369 68.0% 5,386 19.9% 331 1.2% 2,939 10.9% 27,024<br />
2002 18,365 72.6% 4,353 17.2% 278 1.1% 2,303 9.1% 25,299<br />
2003 18,815 81.6% 2,192 9.5% 25 0.1% 2,037 8.8% 23,069<br />
2004 20,268 92.9% 849 3.9% 0 0.0% 701 3.2% 21,818<br />
2005 19,602 79.8% 2,665 10.9% 6 0.0% 2,283 9.3% 24,556<br />
2006 17,478 66.9% 6,995 26.8% 0 0.0% 1,657 6.3% 26,131<br />
2007 12,729 52.4% 9,591 39.5% 0 0.0% 1,968 8.1% 24,288<br />
2008 13,788 56.8% 9,295 38.3% 10 0.0% 1,182 4.9% 24,275<br />
2009 10,668 48.7% 10,069 45.9% 50 0.2% 1,140 5.2% 21,927<br />
2010* 9,571 50.1% 8,495 44.5% 50 0.3% 980 5.1% 19,095<br />
Source: UGS <strong>coal</strong> company questionnaires<br />
*Forecast<br />
tons <strong>of</strong> <strong>coal</strong> for 2010 during longwall development—full<br />
production at Lila Canyon is still several years away. In addition,<br />
Alton Coal Development has continued its efforts<br />
to open a surface mine on private l<strong>and</strong> in southern <strong>Utah</strong>’s<br />
Alton <strong>coal</strong>field while work is performed on an Environmental<br />
Impact Statement (EIS), which is needed before<br />
the company can lease surrounding federal <strong>coal</strong>.<br />
<strong>Utah</strong>American Energy, Inc. –<br />
Murray Energy Corporation<br />
In August <strong>of</strong> 2006, Murray Energy Corporation, the largest<br />
independent, family-owned <strong>coal</strong> producer in the United<br />
States, acquired ANDALEX Resources <strong>and</strong> its four subsidiary<br />
companies: the Tower Division, consisting <strong>of</strong> the Aberdeen<br />
<strong>and</strong> Pinnacle mines; GENWAL Resources, Inc., which<br />
manages the Cr<strong>and</strong>all Canyon <strong>and</strong> South Cr<strong>and</strong>all Canyon<br />
mines; WEST RIDGE Resources, Inc., which manages the<br />
West Ridge mine; <strong>and</strong> the Carbon County-based Wildcat<br />
loadout. <strong>Utah</strong>American Energy, a Murray Energy subsidiary,<br />
wholly owns <strong>and</strong> operates the Tower Division <strong>and</strong><br />
the Wildcat loadout, whereas GENWAL <strong>and</strong> WEST RIDGE<br />
are half-owned by the Intermountain Power Agency (IPA).<br />
IPA owns <strong>and</strong> operates the Intermountain Power Project<br />
near Delta, which is the largest single <strong>coal</strong> consumer in<br />
the state. <strong>Utah</strong>American Energy also owns the Lila Canyon<br />
mine, which is currently being developed in the Emery<br />
County portion <strong>of</strong> the Book Cliffs <strong>coal</strong>field.<br />
Tower Division – Aberdeen <strong>and</strong> Pinnacle Mines<br />
The Tower Division is located in Deadman Canyon about<br />
7 miles north <strong>of</strong> Price. The Aberdeen mine closed indefinitely<br />
on March 28, 2008, due to depth-related mining difficulties.<br />
Peak production at the Aberdeen mine, which is<br />
located in the Aberdeen bed, reached 2.1 million tons in
10<br />
2006; production during 2008 totaled 242,000 tons before<br />
the mine closed. Tower’s second operation, the Pinnacle<br />
mine, was closed in January <strong>of</strong> 2006 after producing<br />
from both the Gilson <strong>and</strong> Centennial beds.<br />
Dry Canyon Coal Tract<br />
In mid-2009, <strong>Utah</strong>American nominated for leasing the<br />
federally-owned Dry Canyon Coal tract, which is located<br />
on 4325 acres west <strong>of</strong> the company’s Aberdeen mine. This<br />
tract has three potentially minable <strong>coal</strong> beds: the Aberdeen<br />
bed, which averages roughly 10 feet thick; the Kenilworth<br />
bed, which averages 8 feet thick; <strong>and</strong> the D bed, which averages<br />
about 6 feet thick. Total recoverable <strong>coal</strong> reserves<br />
within the three beds are estimated at 42 million tons.<br />
Lila Canyon Mine<br />
The new Lila Canyon mine is located south <strong>of</strong> Horse Canyon<br />
in the Book Cliffs <strong>coal</strong>field in Emery County. In spring<br />
<strong>of</strong> 2010, the company finished construction on 1200-foot<br />
long rock slopes <strong>and</strong> began development work in the Sunnyside<br />
<strong>coal</strong> bed, producing 6600 tons <strong>of</strong> <strong>coal</strong> in the second<br />
quarter <strong>of</strong> 2010. Development work will continue until<br />
about 2014 when the first longwall mining is scheduled<br />
to begin. Coal production during the first few years <strong>of</strong> development<br />
will total about 45,000 tons in 2010 <strong>and</strong> about<br />
190,000 tons in 2011. By the time the mine is at full capacity,<br />
it could employ up to 200 people <strong>and</strong> produce up to 4.5<br />
million tons <strong>of</strong> <strong>coal</strong> per year. Coal will be mined from federal<br />
leases where the merged upper <strong>and</strong> lower Sunnyside<br />
bed is about 13 feet thick. Between 26 <strong>and</strong> 40 million tons<br />
<strong>of</strong> recoverable <strong>coal</strong> are under lease, with recovery largely<br />
dependent on the cutting height <strong>of</strong> the equipment that will<br />
be used. Approximately 50 million tons <strong>of</strong> additional federal<br />
<strong>coal</strong> is available to the south <strong>of</strong> current leases.<br />
GENWAL Resources, Inc. – Cr<strong>and</strong>all Canyon <strong>and</strong><br />
South Cr<strong>and</strong>all Canyon Mines<br />
<strong>Utah</strong>American Energy <strong>and</strong> IPA share equally in ownership<br />
<strong>of</strong> the Cr<strong>and</strong>all Canyon <strong>and</strong> South Cr<strong>and</strong>all Canyon mines,<br />
which are located in the Wasatch Plateau. The mines were<br />
operated by GENWAL Resources, Inc., a wholly owned subsidiary<br />
<strong>of</strong> <strong>Utah</strong>American Energy.<br />
Production from the Hiawatha bed at the Cr<strong>and</strong>all Canyon<br />
mine ceased in August 2007 after a major ro<strong>of</strong> collapse.<br />
As recently as 2001, annual production at Cr<strong>and</strong>all Canyon<br />
totaled nearly 4.0 million tons, but only 400,000 tons<br />
were produced in 2007 before the mine closed. The South<br />
Cr<strong>and</strong>all Canyon mine, located within the Blind Canyon<br />
bed, was closed by <strong>Utah</strong>American in August <strong>of</strong> 2006 after<br />
producing only 1.1 million tons <strong>of</strong> <strong>coal</strong> in four years.<br />
<strong>Utah</strong> <strong>Geological</strong> <strong>Survey</strong><br />
WEST RIDGE Resources, Inc. – West Ridge Mine<br />
The West Ridge mine began operation in 1999 in the Book<br />
Cliffs <strong>coal</strong>field with production from the lower Sunnyside<br />
bed. The mine is operated by WEST RIDGE Resources,<br />
while mine assets are co-owned equally by IPA <strong>and</strong> <strong>Utah</strong>American<br />
Energy. The West Ridge mine produced 3.1 million<br />
tons <strong>of</strong> <strong>coal</strong> in 2009, down from 3.8 million tons in<br />
2008. Production in 2010 is expected to decline further<br />
to 2.6 million tons. <strong>Utah</strong>American estimates that the West<br />
Ridge mine has 14 million tons <strong>of</strong> recoverable <strong>coal</strong> under<br />
lease.<br />
Canyon Fuel Company – Arch Coal<br />
Dugout Canyon Mine<br />
The Dugout Canyon mine, located in the Book Cliffs <strong>coal</strong>field,<br />
produced 3.3 million tons <strong>of</strong> <strong>coal</strong> from the Gilson bed<br />
in 2009, down 20.4% from the 4.1 million tons produced<br />
in 2008. Dugout’s production is expected to decrease even<br />
further in 2009 to roughly 2.8 million tons. Coal production<br />
from the Rock Canyon bed ended in February <strong>of</strong> 2004,<br />
after which longwall equipment was moved to the stratigraphically<br />
lower Gilson bed. Canyon Fuel estimates that<br />
the Dugout mine has 20 million tons <strong>of</strong> recoverable <strong>coal</strong><br />
remaining under lease.<br />
Skyline Mine<br />
Canyon Fuel Company’s Skyline mine, located in the Wasatch<br />
Plateau <strong>coal</strong>field, is currently mining in the Lower<br />
O’Connor ‘A’ bed on their North lease (Winter Quarters<br />
lease) in Carbon County. Production from this bed decreased<br />
slightly in 2009 to 2.9 million tons with 2010 production<br />
expected to be about the same. Canyon Fuel estimates<br />
that 19 million tons <strong>of</strong> <strong>coal</strong> can be recovered from<br />
current leases.<br />
SUFCO Mine<br />
SUFCO is <strong>Utah</strong>’s largest <strong>coal</strong> producer <strong>and</strong> the seventhlargest<br />
underground <strong>coal</strong> mine in the United States. It is<br />
also the only active <strong>coal</strong> mine in Sevier County. SUFCO<br />
produced 6.7 million tons <strong>of</strong> <strong>coal</strong> in 2009 from the upper<br />
Hiawatha bed, 14.7% less than record high production<br />
<strong>of</strong> 7.9 million tons achieved during 2006. Production at<br />
SUFCO is expected to decrease again in 2010 to 6.6 million<br />
tons. Canyon Fuel estimates that roughly 66 million tons<br />
<strong>of</strong> reserves remain under lease in the upper <strong>and</strong> lower Hiawatha<br />
beds.
<strong>Annual</strong> <strong>review</strong> <strong>and</strong> <strong>forecast</strong> <strong>of</strong> <strong>Utah</strong> <strong>coal</strong> production <strong>and</strong> distribution—2009 11<br />
Greens Hollow Tract<br />
Canyon Fuel has nominated for leasing the federal Greens<br />
Hollow tract, located northwest <strong>of</strong> the already acquired<br />
Quitchupah lease. A draft EIS was issued in the spring <strong>of</strong><br />
2009 <strong>and</strong> the BLM is currently addressing comments received<br />
in preparation for the final EIS, expected to be released<br />
during summer 2010. The Greens Hollow tract is<br />
thought to contain approximately 73 million tons <strong>of</strong> reserves<br />
within the lower Hiawatha bed.<br />
Cottonwood Tract<br />
On December 31, 2007, the <strong>Utah</strong> School <strong>and</strong> Institutional<br />
Trust L<strong>and</strong>s Administration (SITLA) held a sale <strong>of</strong> the<br />
Cottonwood Competitive Coal Leasing Unit. The tract was<br />
awarded to Ark L<strong>and</strong> Company, which is a subsidiary <strong>of</strong><br />
Arch Coal, Inc., also the owner <strong>of</strong> the Canyon Fuel Company.<br />
Two <strong>coal</strong> leases were issued, one for 8204 acres covering<br />
l<strong>and</strong>s within the 1998 l<strong>and</strong> exchange Cottonwood Coal<br />
Tract <strong>and</strong> the other for 600 acres within an adjacent SITLA<br />
section. Total recoverable <strong>coal</strong> in the Hiawatha bed for the<br />
combined leases is estimated to equal 49 million tons.<br />
Emery Mine<br />
CONSOL Energy<br />
CONSOL Energy’s Emery mine, its only mine in the western<br />
United States, has produced just over one million tons<br />
each year from the Ferron S<strong>and</strong>stone I bed since being<br />
restarted in 2005 (1.2 million tons produced in 2009).<br />
Emery <strong>coal</strong> miners use a combination <strong>of</strong> three continuous<br />
miners to produce the shallow cover <strong>coal</strong>. CONSOL estimates<br />
recoverable reserves under lease to total 17 million<br />
tons, but significant unleased reserves can be found adjacent<br />
to the mine. In addition, the company owns <strong>coal</strong> near<br />
the undeveloped Hidden Valley mine to the south.<br />
Bear Canyon Mines<br />
C.W. Mining (Co-op)<br />
C.W. Mining Company commenced longwall mining within<br />
the Tank bed in November <strong>of</strong> 2007. Production totaled<br />
868,000 tons in 2008 as difficult mining conditions hampered<br />
longwall operation. The mine produced 651,000<br />
tons <strong>of</strong> <strong>coal</strong> in 2009 before it closed due to financial <strong>and</strong><br />
legal problems <strong>and</strong> is now in the process <strong>of</strong> being sold.<br />
Several million tons <strong>of</strong> recoverable reserves are still available<br />
in the Tank, Blind Canyon, <strong>and</strong> Hiawatha beds in the<br />
surrounding area.<br />
Energy West Mining Company (PacifiCorp)<br />
Deer Creek Mine<br />
<strong>Annual</strong> production at Energy West Mining Company’s<br />
Deer Creek mine averaged 3.8 million tons over the past<br />
20 years <strong>and</strong> produced the same amount in 2009. Operators<br />
scheduled longwall maintenance for the second half<br />
<strong>of</strong> 2010, which will result in annual production only reaching<br />
2.8 million tons—production should be back to normal<br />
levels in 2011. Energy West estimates that the stateowned<br />
Mill Fork tract, where production began in 2005,<br />
contains roughly 27 million tons <strong>of</strong> remaining <strong>coal</strong> in two<br />
beds, the Blind Canyon <strong>and</strong> the Hiawatha. Five longwall<br />
panels were successfully developed within the Hiawatha<br />
bed before production shifted in February 2008 to the<br />
stratigraphically higher Blind Canyon bed. Production in<br />
the Blind Canyon will be completed in mid-2010, when<br />
mining will return to the Hiawatha bed.<br />
America West Resources, Inc.<br />
Hidden Splendor Resources, Inc. – Horizon Mine<br />
The Horizon mine, located approximately 11 miles west<br />
<strong>of</strong> Helper in the Wasatch Plateau <strong>coal</strong>field, is owned <strong>and</strong><br />
operated by Hidden Splendor Resources, a fully owned<br />
subsidiary <strong>of</strong> America West Resources. Since Hidden<br />
Splendor’s acquisition <strong>of</strong> the mine in 2003, annual production<br />
with one continuous miner has averaged 260,000<br />
tons, with 2009 production down slightly to 194,000 tons.<br />
Estimates indicate that the Horizon mine will produce<br />
250,000 tons in 2010 from the 14 million tons <strong>of</strong> <strong>coal</strong> remaining<br />
under lease.<br />
Columbia Property<br />
The Columbia property is south <strong>of</strong> the town <strong>of</strong> Sunnyside<br />
in the Book Cliffs <strong>coal</strong>field in Carbon County. The property<br />
was developed by the U.S. Steel Corporation who operated<br />
the Columbia mine from 1923 to 1966 to supply metallurgical<br />
<strong>coal</strong> to its steel-making operations. In July <strong>of</strong> 2008,<br />
America West Resources entered a Coal Mining Lease <strong>and</strong><br />
Option to Purchase Agreement with C&P Coal Resources<br />
for the Columbia property, which covers approximately<br />
5200 acres.<br />
Reserves on the Columbia property are east <strong>and</strong> down dip<br />
<strong>of</strong> the old Columbia mine workings in the merged upper<br />
<strong>and</strong> lower Sunnyside bed, which averages 15 feet thick<br />
<strong>and</strong> is under 1500 to 3500 feet <strong>of</strong> cover. America West estimates<br />
that 35 to 50 million tons <strong>of</strong> recoverable <strong>coal</strong> are<br />
located on company-owned l<strong>and</strong>.
12<br />
<strong>Utah</strong> <strong>Geological</strong> <strong>Survey</strong><br />
Coal Hollow Mine<br />
Alton Coal Development, LLC<br />
Alton Coal Development, LLC has proposed opening a new<br />
<strong>coal</strong> mine in the Alton <strong>coal</strong>field in southern <strong>Utah</strong>’s Kane<br />
County. Alton Coal plans to produce 2 million tons <strong>of</strong> <strong>coal</strong><br />
annually from a surface mine on 440 acres <strong>of</strong> private l<strong>and</strong><br />
<strong>and</strong> 3600 acres <strong>of</strong> unleased federal l<strong>and</strong> located south <strong>of</strong><br />
the town <strong>of</strong> Alton. The <strong>coal</strong> would be transported by truck<br />
on U.S. Highway 89 to State Route 20 <strong>and</strong> then on Interstate<br />
15 to a <strong>coal</strong> loadout facility west <strong>of</strong> Cedar City. BLM<br />
is preparing a draft EIS for the proposed federal leasing<br />
action.<br />
In June <strong>of</strong> 2006, the <strong>Utah</strong> Division <strong>of</strong> Oil, Gas, <strong>and</strong> Mining<br />
(DOGM) began processing Alton Coal Development’s application<br />
to start mining on private l<strong>and</strong>. On October 15,<br />
2009, DOGM declared the company’s permit application<br />
complete, but subsequent legal challenges have delayed<br />
the permit. In early August 2010, the DOGM board upheld<br />
the original decision, clearing the way for a permit<br />
as soon as the company provides an adequate reclamation<br />
bond, <strong>and</strong> if no other legal challenges are brought forth.<br />
After a permit is granted, mine construction <strong>and</strong> production<br />
could start on private l<strong>and</strong>, where reserves are estimated<br />
at 5 million tons. Recoverable reserves within the<br />
combined private <strong>and</strong> federal mining area are estimated<br />
between 40 <strong>and</strong> 45 million tons. The proposed surface<br />
mine would produce subbituminous Dakota Formation<br />
<strong>coal</strong> from the Smirl bed, which ranges from 9500 to 10,000<br />
Btu per pound, <strong>and</strong> averages about 1% sulfur <strong>and</strong> 9% ash.<br />
DISTRIBUTION OF UTAH COAL<br />
The total amount <strong>of</strong> <strong>Utah</strong> <strong>coal</strong> distributed to market is proportional<br />
to the amount <strong>of</strong> <strong>Utah</strong> <strong>coal</strong> produced. With production<br />
dropping in 2009, distribution <strong>of</strong> <strong>Utah</strong> <strong>coal</strong> also<br />
declined to 20.6 million tons (table 8). As a result <strong>of</strong> the<br />
slowed U.S. economy, dem<strong>and</strong> for electricity decreased,<br />
resulting in a 16% drop in the dem<strong>and</strong> for <strong>coal</strong> at electric<br />
generating facilities. The economic recession also slowed<br />
dem<strong>and</strong> for <strong>coal</strong> in the industrial sector, with deliveries<br />
dropping from 3.2 million tons in 2008 to 2.5 million tons<br />
in 2009, the lowest level since 1987. With the effects <strong>of</strong> the<br />
recession lingering into 2010, <strong>and</strong> a further 13% decrease<br />
predicted for <strong>Utah</strong> <strong>coal</strong> production, distribution <strong>of</strong> <strong>Utah</strong><br />
<strong>coal</strong> is <strong>forecast</strong> to drop to 17.9 million tons, a 23-year low.<br />
Over the past 25 years, <strong>Utah</strong> <strong>coal</strong> mines sent an average <strong>of</strong><br />
40% <strong>of</strong> their <strong>coal</strong> to other states <strong>and</strong> countries. The overseas<br />
market dramatically declined in 2002, but the domestic<br />
U.S. market remained strong <strong>and</strong> is a vital source <strong>of</strong> dem<strong>and</strong><br />
for <strong>Utah</strong> <strong>coal</strong>.<br />
Electric Utility Market<br />
During 2009, 87.9% <strong>of</strong> <strong>Utah</strong> <strong>coal</strong> distribution (18.1 million<br />
tons) was delivered to the electric utility market in<br />
both <strong>Utah</strong> <strong>and</strong> other states (table 8, table 9). In 2009, <strong>coal</strong><br />
fueled 82.5% <strong>of</strong> the electricity generated in <strong>Utah</strong>, which<br />
is substantially more than the U.S. average <strong>of</strong> 44.7%. This<br />
percentage has significantly decreased since 2005 when<br />
<strong>coal</strong> accounted for 94.2% <strong>of</strong> <strong>Utah</strong>’s electric generation (see<br />
appendix table A6). The decrease in <strong>coal</strong>’s contribution to<br />
<strong>Utah</strong>’s electricity mix was due not to a reduction in <strong>coal</strong>fired<br />
generation, but rather to the addition <strong>of</strong> 1300 megawatts<br />
(MW) <strong>of</strong> new natural-gas fired electric capacity.<br />
<strong>Utah</strong>’s Electric Utility Market<br />
The amount <strong>of</strong> <strong>coal</strong> delivered to electric utilities within<br />
<strong>Utah</strong> totaled 13.3 million tons in 2009, a 9.5% decrease<br />
from 14.7 million tons in 2008 (table 8). <strong>Utah</strong>’s three PacifiCorp-owned<br />
<strong>coal</strong>-fired power plants—Hunter, with a net<br />
capacity <strong>of</strong> 1320 MW; Huntington, with a net capacity <strong>of</strong><br />
895 MW; <strong>and</strong> Carbon, with a net capacity <strong>of</strong> 182 MW—are<br />
expected to continue to use only <strong>Utah</strong> <strong>coal</strong>, about 8.4 million<br />
tons in 2009 (table 10). However, the Intermountain<br />
Power Plant (IPP) near Delta, <strong>Utah</strong> (net capacity <strong>of</strong> 1800<br />
MW), which burns about 6 million tons <strong>of</strong> <strong>coal</strong> a year,<br />
has begun purchasing a portion <strong>of</strong> their <strong>coal</strong> from Wyoming—405,000<br />
tons in 2008, 1.9 million tons in 2009,<br />
<strong>and</strong> an estimated 1.4 million tons in 2010. With IPP looking<br />
elsewhere for 25% <strong>of</strong> their <strong>coal</strong> needs, <strong>and</strong> with the<br />
economic slowdown reducing the dem<strong>and</strong> for electricity,<br />
in-state <strong>coal</strong> deliveries to electric utilities are predicted to<br />
decrease another 14.2% in 2010 to 11.4 million tons, the<br />
lowest level since 1988. Table 11 displays total <strong>coal</strong> consumption<br />
(different than purchases shown in table 10)<br />
<strong>and</strong> net generation at each <strong>of</strong> <strong>Utah</strong>’s six <strong>coal</strong>-fired power<br />
plants, including the Sunnyside plant that burns waste<br />
<strong>coal</strong>.<br />
Out-<strong>of</strong>-State Electric Utility Market<br />
Electric utility companies outside <strong>of</strong> <strong>Utah</strong> received 4.8 million<br />
tons <strong>of</strong> <strong>Utah</strong> <strong>coal</strong> in 2009, 29.2% lower than the 6.8<br />
million tons delivered in 2008 (table 8). Nevada received<br />
the majority <strong>of</strong> that <strong>coal</strong>, 1.8 million tons, while 808,000<br />
tons went to electric plants in California, 666,000 tons<br />
went to electric utility markets in Alabama, <strong>and</strong> 525,000<br />
tons went to electric plants in Tennessee. The remaining<br />
tonnage went to Florida, Kentucky, Missouri, Nebraska,<br />
<strong>and</strong> Wisconsin (table 9).
<strong>Annual</strong> <strong>review</strong> <strong>and</strong> <strong>forecast</strong> <strong>of</strong> <strong>Utah</strong> <strong>coal</strong> production <strong>and</strong> distribution—2009 13<br />
Table 8. Distribution <strong>of</strong> <strong>Utah</strong> <strong>coal</strong>, 1981–2010.<br />
Thous<strong>and</strong> short tons<br />
Year Production Distribution <strong>of</strong> <strong>Utah</strong> Coal<br />
Electric Utilities 1 Coke Plants Industrial 2 Residential & Commercial<br />
Exports -<br />
Domestic<br />
Exports 3 -<br />
Foreign<br />
Total<br />
Outside<br />
<strong>Utah</strong><br />
In<br />
<strong>Utah</strong><br />
Total<br />
Outside<br />
<strong>Utah</strong><br />
In<br />
<strong>Utah</strong><br />
Total<br />
Outside<br />
<strong>Utah</strong><br />
In<br />
<strong>Utah</strong><br />
Total<br />
Outside<br />
<strong>Utah</strong><br />
In<br />
<strong>Utah</strong><br />
Total<br />
1981 13,808 2,688 4,829 7,517 779 267 1,046 1,645 493 2,138 180 197 377 5,292 3,472 14,550<br />
1982 16,912 3,643 6,135 9,778 859 136 995 1,349 728 2,077 233 177 410 6,084 2,177 15,437<br />
1983 11,829 3,404 5,220 8,624 0 32 32 1,091 581 1,672 292 191 483 4,787 1,346 12,157<br />
1984 12,259 3,730 4,688 8,418 0 163 163 1,542 466 2,008 311 257 568 5,583 849 12,006<br />
1985 12,831 3,746 7,192 10,938 0 39 39 1,866 352 2,218 312 252 564 5,924 625 14,384<br />
1986 14,269 2,989 6,955 9,944 0 485 485 1,745 271 2,016 81 191 272 4,815 551 13,268<br />
1987 16,521 3,182 10,772 13,954 0 131 131 1,813 249 2,062 83 204 287 5,078 555 16,989<br />
1988 18,164 2,797 11,233 14,030 0 171 171 1,996 679 2,675 88 236 324 4,881 1,044 18,244<br />
1989 20,517 2,623 11,563 14,186 0 355 355 2,401 765 3,166 84 323 407 5,108 2,175 20,289<br />
1990 22,012 3,373 12,604 15,977 0 617 617 2,327 612 2,939 59 380 439 5,759 1,708 21,680<br />
1991 21,875 3,608 12,162 15,770 0 615 615 2,158 622 2,780 76 320 396 5,842 2,112 21,673<br />
1992 21,015 4,000 11,619 15,619 0 553 553 2,006 488 2,494 81 347 428 6,087 2,245 21,339<br />
1993 21,723 3,914 11,842 15,756 0 510 510 2,146 594 2,740 134 228 362 6,194 2,567 21,935<br />
1994 24,422 4,841 12,344 17,185 0 109 109 2,322 643 2,965 308 157 465 7,471 2,717 23,441<br />
1995 25,051 6,570 11,771 18,341 0 0 0 2,399 642 3,041 68 182 250 9,037 3,811 25,443<br />
1996 27,071 7,258 11,923 19,181 0 0 0 2,339 517 2,856 51 260 311 9,648 5,468 27,816<br />
1997 26,428 5,638 13,271 18,909 0 0 0 2,164 665 2,829 60 96 156 7,862 3,513 25,407<br />
1998 26,600 7,704 12,812 20,516 0 0 0 2,749 680 3,429 82 212 294 10,535 2,735 26,974<br />
1999 26,491 6,910 13,162 20,072 0 0 0 2,529 830 3,359 75 107 182 9,514 2,567 26,180<br />
2000 26,920 6,639 14,276 20,915 0 5 5 2,892 634 3,526 141 82 223 9,672 2,960 27,629<br />
2001 27,024 7,419 12,480 19,899 0 0 0 3,055 792 3,847 254 394 648 10,728 2,404 26,798<br />
2002 25,299 5,562 13,009 18,571 0 0 0 3,543 735 4,278 282 372 654 9,387 875 24,378<br />
2003 23,069 6,318 12,691 19,009 0 0 0 3,185 760 3,945 81 61 142 9,584 222 23,318<br />
2004 21,818 6,084 13,313 19,397 0 0 0 3,163 587 3,750 26 213 239 9,273 295 23,681<br />
2005 24,556 5,528 14,136 19,664 0 0 0 2,718 785 3,503 27 45 72 8,273 212 23,451<br />
2006 26,131 6,221 14,382 20,603 0 0 0 2,962 878 3,840 10 35 45 9,193 34 24,522<br />
2007 24,288 6,242 14,999 21,241 0 0 0 2,594 773 3,367 42 22 64 8,878 173 24,845<br />
2008 24,275 6,804 14,724 21,528 0 0 0 2,416 797 3,213 9 0 9 9,229 312 25,062<br />
2009 21,927 4,819 13,330 18,149 0 0 0 1,816 664 2,480 7 0 7 6,642 0 20,636<br />
2010* 19,095 4,023 11,434 15,457 0 0 0 1,545 799 2,344 10 0 10 5,577 100 17,910<br />
Source: EIA, 2008 <strong>Annual</strong> Coal Distribution <strong>and</strong> 2009 Quarterly Coal Distribution, UGS <strong>coal</strong> company questionnaires<br />
1 Includes cogeneration facilities<br />
2 A large portion <strong>of</strong> out-<strong>of</strong>-state industrial deliveries are most likely going to cogeneration plants, which are only required to use 5.0% <strong>of</strong> their power for industrial use;<br />
the remainder typically goes into the consumer power grid.<br />
3 Exports from 1981 to 2003 went overseas to the Pacific Rim; from 2004 to 2006 exports went to Canada; in 2007–2010 exports went to several different countries.<br />
*Forecast
14<br />
<strong>Utah</strong> <strong>Geological</strong> <strong>Survey</strong><br />
Table 9. Distribution <strong>of</strong> <strong>Utah</strong> <strong>coal</strong> by state, 2009.<br />
Thous<strong>and</strong> short tons<br />
Destination<br />
Residential &<br />
Commercial<br />
Coke Plants<br />
Industrial<br />
Electric<br />
Utility<br />
Total<br />
Alabama -- -- -- 666 666<br />
Arizona -- -- 48 -- 48<br />
California -- -- 1,352 808 2,160<br />
Colorado -- -- 13 -- 13<br />
Florida -- -- -- 238 238<br />
Idaho 7 -- 14 -- 21<br />
Indiana -- -- 56 -- 56<br />
Kentucky -- -- -- 461 461<br />
Michigan -- -- 92 -- 92<br />
Minnesota -- -- * -- *<br />
Missouri -- -- -- 326 326<br />
Nebraska -- -- -- 12 12<br />
Nevada -- -- 145 1,771 1,917<br />
Oregon -- -- 71 -- 71<br />
Tennessee -- -- -- 525 525<br />
Texas -- -- 13 -- 13<br />
<strong>Utah</strong> -- -- 664 13,330 13,994<br />
Wisconsin -- -- 12 12 24<br />
Total 7 -- 2,480 18,149 20,637<br />
Source: U.S. Energy Information Administration, Quarterly Coal Distribution, 2009; <strong>Utah</strong> data from<br />
UGS <strong>coal</strong> company questionnaires<br />
*Amount less than 500 tons<br />
Industrial Market<br />
<strong>Utah</strong>’s Industrial Market<br />
The amount <strong>of</strong> <strong>coal</strong> delivered to industrial users within the<br />
state <strong>of</strong> <strong>Utah</strong> totaled 664,000 tons in 2009, down 16.7%<br />
from the 797,000 tons delivered in 2008 (table 8). However,<br />
purchases are expected to rebound in 2010, reaching<br />
an estimated 799,000 tons. Typically, 60% <strong>of</strong> industrialuse,<br />
in-state <strong>coal</strong> is purchased by Kennecott <strong>Utah</strong> Copper<br />
<strong>and</strong> used to generate electricity for copper smelting; the<br />
remaining <strong>coal</strong> is delivered to companies that produce cement,<br />
lime, <strong>and</strong> other construction products (table 10).<br />
Out-<strong>of</strong>-State Industrial Market<br />
Deliveries <strong>of</strong> <strong>Utah</strong> <strong>coal</strong> to industrial plants in other states<br />
declined 24.8% in 2009 to 1.8 million tons, mostly likely<br />
due to the reduced dem<strong>and</strong> resulting from the slow economy<br />
(table 8). Deliveries for 2009 are expected to decrease<br />
even further to 1.5 million tons. California is the largest<br />
industrial consumer <strong>of</strong> <strong>Utah</strong> <strong>coal</strong>, with deliveries <strong>of</strong> 1.4<br />
million tons in 2009 (table 9). Other states receiving significant<br />
amounts <strong>of</strong> <strong>Utah</strong> <strong>coal</strong> for industrial use were Arizona,<br />
Colorado, Idaho, Indiana, Michigan, Nevada, Oregon,<br />
Texas, <strong>and</strong> Wisconsin. It is important to note that a large<br />
portion <strong>of</strong> out-<strong>of</strong>-state industrial deliveries could be going<br />
to cogeneration plants. These plants are only required to<br />
use 5.0% <strong>of</strong> their power generation for industrial use, with<br />
the remainder typically sold to the power grid.<br />
Cogeneration Market<br />
Typical cogeneration (“cogen”) facilities provide process<br />
steam <strong>and</strong> power for industry, but many also generate<br />
electricity for consumer markets, providing a maximum<br />
allowable 95% <strong>of</strong> total net capacity to the grid. Many such<br />
plants, primarily in California, are major customers <strong>of</strong><br />
<strong>Utah</strong> <strong>coal</strong> (table 10).<br />
<strong>Utah</strong>’s Sunnyside Cogeneration plant was originally designed<br />
as a true cogen plant, which would have supplied<br />
a minimum <strong>of</strong> 5.0% <strong>of</strong> its power to a commercial greenhouse.<br />
However, since the plant burns waste <strong>coal</strong>, it is designated<br />
as a qualifying facility, which under the Federal<br />
Public Utility Regulatory Policy Act is exempt from the<br />
cogeneration requirement, <strong>and</strong> the proposed commercial<br />
greenhouse was never developed. Subsequently, all <strong>of</strong> the<br />
power from the Sunnyside cogen plant goes directly to the<br />
grid.<br />
The Sunnyside plant is rated at 51 net MW <strong>and</strong> uses circulating<br />
fluidized-bed combustion technology to burn about<br />
400,000 tons <strong>of</strong> waste <strong>coal</strong> annually supplied from the<br />
closed Sunnyside <strong>coal</strong> washing operation, as well as waste<br />
<strong>coal</strong> from the closed Star Point wash plant (table 11). The<br />
heating value <strong>of</strong> the Sunnyside fuel varies from 4000 to
<strong>Annual</strong> <strong>review</strong> <strong>and</strong> <strong>forecast</strong> <strong>of</strong> <strong>Utah</strong> <strong>coal</strong> production <strong>and</strong> distribution—2009 15<br />
Table 10. <strong>Utah</strong> <strong>and</strong> non-<strong>Utah</strong> <strong>coal</strong> purchases by select companies, 2003–2010.<br />
Thous<strong>and</strong> short tons<br />
Company<br />
Plant<br />
Location<br />
Coal purchased in<br />
2003 from:<br />
Coal purchased in<br />
2004 from:<br />
Coal purchased in<br />
2005 from:<br />
Coal purchased in<br />
2006 from:<br />
UT WY CO UT WY CO MT UT WY CO UT WY CO<br />
PacifiCorp - Carbon UT 657 -- -- 567 -- -- -- 677 -- -- 637 -- --<br />
PacifiCorp - Hunter UT 3,839 -- -- 4,150 -- -- -- 4,967 -- -- 5,186 -- --<br />
PacifiCorp - Huntington UT 2,891 -- -- 3,326 -- -- -- 3,035 -- -- 2,485 -- --<br />
DG&T - Bonanza UT -- -- 2,036 -- -- 2,553 -- -- -- 2,142 -- -- 1,723<br />
IPP UT 5,304 -- -- 5,270 468 -- -- 5,457 634 -- 6,074 167 --<br />
Ash Grove Cement UT 124 -- -- 123 -- -- -- 123 -- -- 127 -- --<br />
Graymont UT 150 -- -- 166 -- -- -- 156 -- -- 184 -- --<br />
Holcim UT 70 -- -- 79 7 -- -- 84 0.5 -- 59 31 --<br />
Kennecott <strong>Utah</strong> Copper UT 400 -- -- 207 175 -- 3 398 -- -- 495 -- --<br />
Utelite Corp. UT 16 0.2 -- 12 3 -- -- 25 9 -- 13 8 --<br />
ACE Cogen. Plant 1 CA 222 300 351 397<br />
Mt. Poso Cogen. 1 CA 150 114 156 126<br />
Rio Bravo Jasmin Cogen. 1 CA 66 41 33 60<br />
Rio Bravo Poso Cogen. 1 CA 66 49 49 59<br />
North Valmy Power Plant NV 1,220 58 -- 1,356 487 -- -- 1,611 527 10 1,119 645 --<br />
Reid Gardner Power Plant NV 1,756 -- 48 1,721 -- 187 -- 1,490 -- 330 1,510 -- 356<br />
Company<br />
Plant<br />
Location<br />
Coal purchased in<br />
2007 from:<br />
Coal purchased in<br />
2008 from:<br />
Coal purchased in<br />
2009 from:<br />
Coal purchased in 2010*<br />
from:<br />
UT WY CO UT WY CO UT WY CO UT WY CO<br />
PacifiCorp - Carbon UT 625 -- -- 585 -- -- 579 -- -- 651 -- --<br />
PacifiCorp - Hunter UT 4,613 -- -- 5,455 -- -- 5,162 -- -- 4,478 -- --<br />
PacifiCorp - Huntington UT 3,344 -- -- 3,257 -- -- 2,637 -- -- 2,715 -- --<br />
DG&T - Bonanza UT 86 -- 1,428 11 -- 2,059 -- -- 2,200 -- -- 1,923<br />
IPP UT 6,331 -- -- 5,417 405 -- 4,952 1,945 -- 3,590 1,410 --<br />
Ash Grove Cement UT 102 -- -- 113 -- -- 82 -- -- 88 -- --<br />
Graymont UT 183 -- -- 180 -- -- 87 -- -- 200 -- --<br />
Holcim UT 37 56 1 27 40 -- 16 47 -- 29 36 --<br />
Kennecott <strong>Utah</strong> Copper UT 441 -- -- 466 -- -- 469 -- -- 470 -- --<br />
Utelite Corp. UT 10 11 -- 10 9 -- 10 6 -- 13 2 --<br />
ACE Cogen. Plant 1 CA 291 409 411 333<br />
Mt. Poso Cogen. 1 CA 136 192 147 148<br />
Rio Bravo Jasmin Cogen. 1 CA 60 74 74 126<br />
Rio Bravo Poso Cogen. 1 CA 69 70 74 138<br />
North Valmy Power Plant NV 928 855 -- 920 750 -- 955 1,079 -- 1,000 600 --<br />
Reid Gardner Power Plant NV 1,458 -- 313 1,306 -- 301 842 129 440 1,070 300 250<br />
Source: UGS <strong>coal</strong> company questionnaires<br />
Note: This table includes all <strong>Utah</strong> companies that use <strong>coal</strong>, but only a sampling <strong>of</strong> non-<strong>Utah</strong> companies that use <strong>Utah</strong> <strong>coal</strong>.<br />
1<br />
Reports only <strong>Utah</strong> <strong>coal</strong> purchases<br />
*Forecast
16<br />
<strong>Utah</strong> <strong>Geological</strong> <strong>Survey</strong><br />
Table 11. Electricity generation <strong>and</strong> <strong>coal</strong> consumption at <strong>coal</strong> burning power plants in <strong>Utah</strong>, 1990–2010.<br />
Year Deseret Generation & Transmission Co. Intermountain Power Agency<br />
Bonanza Plant<br />
Intermountain Power Project (IPP)<br />
Coal Consumption Net Generation MWh per Ton Coal Consumption Net Generation MWh per Ton<br />
Short tons MWh Short tons MWh<br />
1990 1,237,312 2,577,271 2.08 4,967,883 12,410,005 2.50<br />
1991 1,309,770 2,764,208 2.11 4,145,585 10,106,144 2.44<br />
1992 1,511,878 3,201,401 2.12 4,959,568 12,264,308 2.47<br />
1993 1,414,980 3,132,999 2.21 4,856,527 11,936,833 2.46<br />
1994 1,533,363 3,242,413 2.11 4,916,555 12,171,664 2.48<br />
1995 1,125,003 2,344,439 2.08 4,248,623 10,306,059 2.43<br />
1996 1,341,076 2,831,105 2.11 4,350,752 10,711,308 2.46<br />
1997 1,532,158 2,947,675 1.92 5,158,831 12,762,721 2.47<br />
1998 1,734,613 3,456,787 1.99 5,278,344 12,973,101 2.46<br />
1999 1,598,296 3,227,344 2.02 5,266,047 13,069,535 2.48<br />
2000 1,510,407 2,931,869 1.94 5,301,096 13,176,578 2.49<br />
2001 2,013,770 3,932,642 1.95 5,365,021 13,383,601 2.49<br />
2002 2,092,485 3,921,576 1.87 5,429,620 13,479,234 2.48<br />
2003 1,893,338 3,512,734 1.86 5,518,129 13,554,882 2.46<br />
2004 1,996,868 3,734,811 1.87 5,996,797 14,429,288 2.41<br />
2005 1,978,718 3,712,862 1.88 5,689,660 13,657,657 2.40<br />
2006 2,127,658 3,893,733 1.83 5,910,423 14,445,440 2.44<br />
2007 1,860,133 3,446,577 1.85 5,898,096 14,420,805 2.44<br />
2008 2,076,286 3,731,300 1.80 6,097,775 14,444,378 2.37<br />
2009 1,766,082 3,354,006 1.90 5,943,436 13,555,580 2.28<br />
2010* 1,946,020 3,316,522 1.70 6,000,000 13,880,000 2.31<br />
Year PacifiCorp Constellation<br />
Huntington plant<br />
Sunnyside Cogeneration Plant<br />
Coal Consumption Net Generation MWh per Ton Waste Coal Consumption Net Generation MWh per Ton<br />
Short tons MWh Short tons MWh<br />
1990 2,753,717 6,253,702 2.27 -- -- --<br />
1991 2,701,376 5,907,238 2.19 -- -- --<br />
1992 2,655,409 6,164,281 2.32 -- -- --<br />
1993 2,837,819 6,339,069 2.23 214,580 184,187 0.86<br />
1994 2,919,715 6,660,541 2.28 386,800 348,287 0.90<br />
1995 2,968,886 6,803,932 2.29 368,550 332,194 0.90<br />
1996 2,927,155 6,402,742 2.19 378,230 392,483 1.04<br />
1997 2,686,976 6,136,491 2.28 402,040 385,829 0.96<br />
1998 2,910,474 6,445,954 2.21 430,000 376,057 0.87<br />
1999 2,952,484 7,126,340 2.41 421,230 398,945 0.95<br />
2000 3,021,448 7,047,404 2.33 476,170 430,408 0.90<br />
2001 2,670,253 6,226,810 2.33 502,490 387,382 0.77<br />
2002 2,686,747 5,964,496 2.22 494,715 390,985 0.79<br />
2003 3,155,334 7,207,036 2.28 514,564 399,490 0.78<br />
2004 2,878,761 6,379,605 2.22 508,950 395,307 0.78<br />
2005 2,960,952 6,373,756 2.15 487,854 415,939 0.85<br />
2006 2,793,793 6,131,487 2.19 467,364 386,149 0.83<br />
2007 3,227,226 7,121,757 2.21 417,998 404,184 0.97<br />
2008 3,022,710 7,144,370 2.36 410,209 414,164 1.01<br />
2009 2,743,700 6,753,764 2.46 417,215 410,935 0.98<br />
2010* 2,826,800 6,274,486 2.22 423,189 411,968 0.97<br />
Source: UGS <strong>coal</strong> company questionnaires<br />
*Forecast
<strong>Annual</strong> <strong>review</strong> <strong>and</strong> <strong>forecast</strong> <strong>of</strong> <strong>Utah</strong> <strong>coal</strong> production <strong>and</strong> distribution—2009 17<br />
Table 11. continued<br />
PacifiCorp<br />
PacifiCorp<br />
Carbon Plant<br />
Hunter Plant<br />
Coal Consumption Net Generation MWh per Ton Coal Consumption Net Generation MWh per Ton<br />
Short tons MWh Short tons MWh<br />
582,320 1,260,497 2.16 4,022,009 9,019,470 2.24<br />
547,905 1,192,091 2.18 4,124,260 8,915,149 2.16<br />
623,178 1,307,598 2.10 4,107,391 8,605,835 2.10<br />
631,909 1,358,949 2.15 4,253,731 9,151,459 2.15<br />
622,621 1,366,103 2.19 4,277,130 9,323,744 2.18<br />
605,712 1,351,984 2.23 4,376,632 9,453,500 2.16<br />
622,126 1,410,369 2.27 4,343,571 9,337,663 2.15<br />
653,833 1,403,936 2.15 4,220,568 8,893,113 2.11<br />
600,317 1,286,805 2.14 4,140,205 9,044,084 2.18<br />
552,590 1,217,838 2.20 4,220,721 9,483,957 2.25<br />
628,623 1,371,586 2.18 4,226,218 9,518,367 2.25<br />
632,124 1,371,822 2.17 3,722,062 8,289,465 2.23<br />
612,539 1,322,047 2.16 4,327,402 9,393,626 2.17<br />
657,111 1,369,884 2.08 4,563,686 9,934,622 2.18<br />
556,458 1,133,139 2.04 4,668,586 9,957,531 2.13<br />
673,436 1,348,569 2.00 4,692,991 9,732,018 2.07<br />
632,468 1,310,932 2.07 4,677,662 9,885,959 2.11<br />
625,970 1,337,783 2.14 4,563,096 9,583,991 2.10<br />
583,859 1,203,437 2.06 4,735,769 10,238,479 2.16<br />
561,400 1,211,875 2.16 4,429,000 9,438,683 2.13<br />
635,700 1,308,211 2.06 4,486,800 9,648,640 2.15<br />
Total<br />
Coal Consumption Net Generation MWh per Ton<br />
Short tons<br />
MWh<br />
13,563,241 31,520,945 2.32<br />
12,828,896 28,884,830 2.25<br />
13,857,424 31,543,423 2.28<br />
14,209,546 32,103,496 2.26<br />
14,656,184 33,112,752 2.26<br />
13,693,406 30,592,108 2.23<br />
13,962,910 31,085,670 2.23<br />
14,654,406 32,529,765 2.22<br />
15,093,953 33,582,788 2.22<br />
15,011,368 34,523,959 2.30<br />
15,163,962 34,476,212 2.27<br />
14,905,720 33,591,722 2.25<br />
15,643,508 34,471,964 2.20<br />
16,302,162 35,978,648 2.21<br />
16,606,420 36,029,681 2.17<br />
16,483,611 35,240,801 2.14<br />
16,609,368 36,053,700 2.17<br />
16,592,519 36,315,097 2.19<br />
16,926,608 37,176,128 2.20<br />
15,860,833 34,724,843 2.19<br />
16,318,509 34,839,827 2.13<br />
5500 Btu per pound, which is less than half the heating<br />
value <strong>of</strong> typical <strong>Utah</strong> <strong>coal</strong>. The sulfur content <strong>of</strong> the fuel<br />
averages about 1.5%. The Star Point waste <strong>coal</strong> is <strong>of</strong> higher<br />
quality than that from Sunnyside, <strong>and</strong> averages 5700 to<br />
6000 Btu per pound with 0.7% sulfur. Total reserves from<br />
both sources will be enough to last through 2023 when<br />
Sunnyside’s power purchase agreement with Rocky Mountain<br />
Power expires.<br />
<strong>Utah</strong>’s Coking Coal Market<br />
The coking <strong>coal</strong> market was once a major <strong>Utah</strong> industry<br />
in support <strong>of</strong> steel-making <strong>and</strong> other industrial processes.<br />
During the early 1980s, an annual average <strong>of</strong> 1.0 million<br />
tons <strong>of</strong> <strong>Utah</strong> coking <strong>coal</strong> was delivered to companies, the<br />
majority <strong>of</strong> which was shipped out-<strong>of</strong>-state (table 8). By<br />
1983, <strong>Utah</strong> stopped delivering coking <strong>coal</strong> to out-<strong>of</strong>-state<br />
customers, <strong>and</strong> deliveries ceased altogether in 1994, except<br />
for a one-time delivery <strong>of</strong> 5000 tons in 2000. <strong>Utah</strong><br />
stopped importing coking <strong>coal</strong> in 2001 when the Geneva<br />
Steel plant ceased operation (table 12).<br />
Residential <strong>and</strong> Commercial Markets<br />
About 7000 tons <strong>of</strong> <strong>Utah</strong> <strong>coal</strong> was shipped to out-<strong>of</strong>-state<br />
businesses <strong>and</strong> residences during 2009 (table 8). This is<br />
substantially less than the 654,000 tons delivered in 2002
18<br />
<strong>Utah</strong> <strong>Geological</strong> <strong>Survey</strong><br />
Table 12. Consumption <strong>of</strong> <strong>coal</strong> in <strong>Utah</strong> by end use, 1960–2010.<br />
Thous<strong>and</strong> short tons<br />
Year Electric Utilities 1 Coke Plant Other Industrial Residential & Commercial Transportation Total<br />
1960 515 2,195 445 249 45 3,449<br />
1961 563 1,910 383 243 10 3,110<br />
1962 462 1,414 338 275 7 2,497<br />
1963 447 1,351 342 228 6 2,374<br />
1964 411 1,676 392 204 8 2,690<br />
1965 363 1,892 414 181 8 2,857<br />
1966 440 1,961 409 185 7 3,003<br />
1967 410 1,829 330 180 5 2,753<br />
1968 417 1,903 359 119 5 2,803<br />
1969 375 1,951 496 161 4 2,988<br />
1970 435 1,959 518 109 4 3,025<br />
1971 417 1,841 545 240 3 3,047<br />
1972 571 1,705 586 161 2 3,024<br />
1973 984 1,890 811 199 2 3,886<br />
1974 1,296 1,984 627 355 1 4,263<br />
1975 2,026 1,932 546 131 0 4,636<br />
1976 1,267 1,959 683 208 0 4,117<br />
1977 2,511 1,991 644 282 0 5,429<br />
1978 3,148 1,700 826 281 0 5,954<br />
1979 4,151 1,569 842 542 0 7,104<br />
1980 4,895 1,473 501 237 0 7,106<br />
1981 4,956 1,477 804 196 0 7,432<br />
1982 4,947 845 818 177 0 6,787<br />
1983 5,223 831 627 191 0 6,873<br />
1984 5,712 1,326 608 259 0 7,905<br />
1985 6,325 1,254 472 252 0 8,303<br />
1986 6,756 785 380 191 0 8,112<br />
1987 11,175 0 507 124 0 11,807<br />
1988 12,544 1,176 597 196 0 14,513<br />
1989 12,949 1,178 686 231 0 15,044<br />
1990 13,563 1,231 676 267 0 15,738<br />
1991 12,829 1,192 508 305 0 14,834<br />
1992 13,857 1,114 525 223 0 15,719<br />
1993 14,210 1,005 727 121 0 16,063<br />
1994 14,656 1,007 835 105 0 16,603<br />
1995 13,693 990 915 77 0 15,675<br />
1996 13,963 1,047 512 94 0 15,615<br />
1997 14,654 1,020 709 123 0 16,507<br />
1998 15,094 971 1,304 113 0 17,482<br />
1999 15,011 741 744 114 0 16,611<br />
2000 15,164 984 1,166 59 0 17,373<br />
2001 14,906 806 1,235 60 0 17,007<br />
2002 15,644 0 592 198 0 16,434<br />
2003 16,302 0 611 61 0 16,974<br />
2004 16,606 0 795 213 0 17,614<br />
2005 16,484 0 800 45 0 17,329<br />
2006 16,609 0 871 35 0 17,515<br />
2007 16,593 0 870 23 0 17,486<br />
2008 16,927 0 852 0 0 17,779<br />
2009 15,861 0 722 0 0 16,583<br />
2010* 16,319 0 735 0 0 17,054<br />
Source: U.S. Energy Information Administration, <strong>Annual</strong> Coal Report, 2008; UGS<br />
Note: Consumption differs from distribution (table 8) because <strong>of</strong> additional consumption from consumer stockpiles.<br />
1<br />
Includes waste <strong>coal</strong> burned at Sunnyside Cogeneration<br />
*Forecast
<strong>Annual</strong> <strong>review</strong> <strong>and</strong> <strong>forecast</strong> <strong>of</strong> <strong>Utah</strong> <strong>coal</strong> production <strong>and</strong> distribution—2009 19<br />
<strong>and</strong> 648,000 tons delivered in 2001. The recent large<br />
swings in total residential <strong>and</strong> commercial <strong>coal</strong> deliveries<br />
are partly due to changing reporting methods, <strong>and</strong> purchases<br />
by commercial <strong>coal</strong> brokers. Commercial brokers<br />
buy <strong>and</strong> sell substantial amounts <strong>of</strong> <strong>coal</strong> each year, with<br />
most <strong>of</strong> their volumes going to utilities for power generation.<br />
These transactions may be logged as commercial<br />
deliveries, but are probably not going to homes or businesses.<br />
There is little market evidence <strong>of</strong> <strong>coal</strong> use by businesses<br />
<strong>and</strong> residences in <strong>Utah</strong>. Approximately 20 wholesale <strong>and</strong><br />
retail outlets for <strong>coal</strong> have been identified in the state, but<br />
these sources have dwindled in number, <strong>and</strong> few proprietors<br />
report useful customer information, except to say<br />
that a few customers, mostly in rural areas, continue to use<br />
<strong>coal</strong> as a backup fuel or for decorative fireplaces. In addition,<br />
a few tons <strong>of</strong> Pennsylvania anthracite <strong>coal</strong> is distributed<br />
in <strong>Utah</strong> <strong>and</strong> nearby states as boutique fuel. Due to the<br />
expansion <strong>of</strong> natural gas pipeline networks, there are only<br />
a few remote locations in <strong>Utah</strong> where <strong>coal</strong> still competes<br />
favorably with propane, electricity, or renewable sources<br />
<strong>of</strong> energy for residential <strong>and</strong> commercial applications.<br />
Foreign Exports<br />
Dem<strong>and</strong> for <strong>Utah</strong> <strong>coal</strong> by foreign countries peaked in the<br />
early 1980s <strong>and</strong> again in the mid-1990s, reaching a record<br />
5.5 million tons in 1996, matching peaks in both production<br />
<strong>and</strong> total distribution (table 8). Through 2003, as deliveries<br />
dwindled to 222,000 tons, all exported <strong>coal</strong> went to<br />
Asian markets. In 2004, 295,000 tons <strong>of</strong> <strong>Utah</strong> <strong>coal</strong> went to<br />
Canadian markets, followed by 212,000 tons in 2005 <strong>and</strong><br />
only 34,000 tons in 2006. Exports increased again in 2007<br />
<strong>and</strong> 2008 as companies reported that a total <strong>of</strong> 173,000<br />
<strong>and</strong> 312,000 tons <strong>of</strong> <strong>Utah</strong> <strong>coal</strong> went to Canada, Mexico, <strong>and</strong><br />
Korea. No <strong>Utah</strong> <strong>coal</strong> was reported to have been shipped to<br />
other counties in 2009.<br />
COAL IMPORTED INTO UTAH<br />
Coal imports into <strong>Utah</strong> increased 67.0% in 2009 from 2.5<br />
million tons in 2008 to 4.2 million tons in 2009 (table<br />
13). In previous years, the vast majority <strong>of</strong> imported <strong>coal</strong><br />
(roughly 2 million tons a year) went to the Bonanza power<br />
plant in eastern <strong>Utah</strong>, which primarily uses <strong>coal</strong> from a<br />
company-owned mine in Colorado. However, the IPP <strong>coal</strong>fired<br />
power plant imported 1.9 million tons <strong>of</strong> Wyoming<br />
<strong>coal</strong> in 2009, nearly doubling <strong>Utah</strong>’s total <strong>coal</strong> imports, <strong>and</strong><br />
plans to import 1.4 million tons in 2010 (table 10). Holcim<br />
<strong>and</strong> Utelite, two <strong>Utah</strong> industrial users, also import minor<br />
amounts <strong>of</strong> <strong>coal</strong> from out-<strong>of</strong>-state.<br />
Table 13. <strong>Utah</strong> <strong>coal</strong> imports, 1981–2010.<br />
Thous<strong>and</strong> short tons<br />
Year<br />
Electric<br />
Utilities<br />
Coke<br />
Plants<br />
After a relatively successful year in 2006, when <strong>coal</strong> production<br />
totaled 26.1 million tons, <strong>Utah</strong>’s <strong>coal</strong> industry has<br />
suffered a few setbacks due to mine closures <strong>and</strong> difficult<br />
mining conditions, dropping production to 24.3 million<br />
tons for both 2007 <strong>and</strong> 2008. With the 2009 closure <strong>of</strong> the<br />
Bear Canyon mine, <strong>and</strong> low dem<strong>and</strong> due to the economic<br />
recession, <strong>Utah</strong>’s total <strong>coal</strong> production for 2009 dropped<br />
to 21.9 million tons, the lowest level since 1993. With dem<strong>and</strong><br />
slow to recover, <strong>and</strong> with several mines facing difficult<br />
conditions, production for 2010 is estimated to drop<br />
below 20 million tons (19.1 million tons) for the first time<br />
since 1988. On a more positive note, after a 10-year effort<br />
to secure the necessary permits, <strong>Utah</strong>American Energy<br />
has finally begun construction on the Lila Canyon mine.<br />
The rock slopes were completed in the spring <strong>of</strong> 2010<br />
<strong>and</strong> development in the <strong>coal</strong> bed started shortly thereaf-<br />
Industrial<br />
Res./<br />
Com.<br />
OUTLOOK FOR UTAH’S COAL INDUSTRY<br />
Total<br />
1981 8 1,030 98 0 1,136<br />
1982 18 695 84 0 797<br />
1983 0 854 83 0 937<br />
1984 224 1,229 85 1 1,539<br />
1985 193 1,289 98 0 1,580<br />
1986 659 383 103 0 1,145<br />
1987 905 160 100 0 1,165<br />
1988 1,300 1,088 60 0 2,448<br />
1989 1,400 922 45 0 2,367<br />
1990 1,449 679 7 2 2,137<br />
1991 1,310 695 2 0 2,007<br />
1992 1,517 629 9 0 2,155<br />
1993 1,501 579 20 0 2,100<br />
1994 1,495 1,089 4 0 2,588<br />
1995 779 1,062 0 0 1,841<br />
1996 805 1,120 0 0 1,925<br />
1997 1,509 1,106 0 0 2,615<br />
1998 1,733 982 0 0 2,715<br />
1999 1,431 728 0 0 2,159<br />
2000 1,531 936 0 0 2,467<br />
2001 2,028 648 0 0 2,676<br />
2002 2,074 0 16 0 2,090<br />
2003 2,036 0 0 0 2,036<br />
2004 3,021 0 185 0 3,206<br />
2005 2,776 0 10 0 2,786<br />
2006 1,890 0 38 0 1,928<br />
2007 1,428 0 68 0 1,496<br />
2008 2,464 0 49 0 2,513<br />
2009 4,145 0 52 0 4,197<br />
2010* 3,333 0 38 0 3,370<br />
Source: UGS <strong>coal</strong> company questionnaires<br />
*Forecast
20<br />
ter. Mine development will produce about 45,000 tons in<br />
2010, while full-scale longwall mining is slated to start in<br />
2014. Coal produced from Lila Canyon should help reverse<br />
production losses from recent mine closures <strong>and</strong> increasingly<br />
difficult mining conditions at other mines.<br />
<strong>Utah</strong>’s long-term (50+ years) <strong>coal</strong> future is less certain. As<br />
the high-quality reserves are being rapidly depleted in the<br />
Book Cliffs <strong>and</strong> Wasatch Plateau <strong>coal</strong>fields, <strong>coal</strong> companies<br />
will have to look to other <strong>Utah</strong> <strong>coal</strong>fields to meet future<br />
dem<strong>and</strong>. The BLM <strong>and</strong> <strong>Utah</strong> <strong>Geological</strong> <strong>Survey</strong> (UGS) estimate<br />
that only 1.2 billion tons <strong>of</strong> <strong>coal</strong> reserves are left<br />
in the Wasatch Plateau, Book Cliffs, <strong>and</strong> Emery <strong>coal</strong>fields,<br />
which is sufficient for roughly 45 to 50 years at current<br />
production levels. In addition, the long-term use <strong>of</strong> <strong>coal</strong><br />
for electric generation remains uncertain as questions <strong>of</strong><br />
global warming <strong>and</strong> carbon mitigation, whether through<br />
carbon taxes, caps, <strong>of</strong>fsets, or sequestration, receive increased<br />
attention.<br />
In 2009, <strong>coal</strong>-fired power generation satisfied more than a<br />
third <strong>of</strong> global electricity dem<strong>and</strong>, about half <strong>of</strong> the United<br />
State’s electricity needs, <strong>and</strong> about 82% <strong>of</strong> <strong>Utah</strong>’s electricity<br />
generation. In spite <strong>of</strong> <strong>coal</strong>’s present dominance in<br />
electric generation, emission st<strong>and</strong>ards remain a major<br />
undefined regulatory issue for future <strong>coal</strong>-fired generation.<br />
New legislation <strong>and</strong> research on clean <strong>coal</strong> technology,<br />
including <strong>coal</strong> gasification <strong>and</strong> <strong>coal</strong>-to-liquid plants, are<br />
being vigorously debated <strong>and</strong> pursued both globally <strong>and</strong><br />
domestically. Also, research continues on carbon sequestration,<br />
including several projects in <strong>Utah</strong>; for additional<br />
information about current local sequestration research,<br />
visit the <strong>Utah</strong> <strong>Geological</strong> <strong>Survey</strong>’s Web site at geology.utah.<br />
gov/emp/co2sequest/.<br />
Production<br />
EIA’s <strong>Annual</strong> Energy Outlook for 2010 predicts that U.S.<br />
<strong>coal</strong> production will increase by an average <strong>of</strong> 1.1% each<br />
year until 2015, when total production will equal 1155<br />
million tons. Coal production growth should slow between<br />
2015 <strong>and</strong> 2035, averaging only 0.4% per year, reflecting<br />
the uncertain future <strong>of</strong> <strong>coal</strong> in the electric utility sector.<br />
Notably, <strong>forecast</strong>ed <strong>coal</strong> production growth is anticipated<br />
to grow much more slowly than suggested by previous<br />
<strong>forecast</strong>s as future electricity dem<strong>and</strong> is expected to be<br />
met by increased renewable, natural gas, <strong>and</strong> nuclear energy<br />
generation. The EIA <strong>forecast</strong> also assumes that <strong>coal</strong>to-liquids<br />
plants will begin operating by 2011, a scenario<br />
that seems optimistic. Cheap, low-sulfur <strong>coal</strong> from western<br />
mines, especially those in Wyoming’s Powder River<br />
Basin, is expected to furnish nearly all <strong>of</strong> the new <strong>coal</strong> production<br />
predicted for the United States. Production from<br />
the Powder River Basin is expected to increase from 418<br />
million tons in 2009 to about 551 million tons in 2035. Interior<br />
Region <strong>coal</strong> production is also projected to increase<br />
<strong>Utah</strong> <strong>Geological</strong> <strong>Survey</strong><br />
from 144 million tons in 2009 to about 208 million tons<br />
in 2035, while Appalachian Region production is expected<br />
to decrease from 351 to about 277 million tons over the<br />
same period (figure 1). EIA predicts that Rocky Mountain<br />
(<strong>Utah</strong> <strong>and</strong> Colorado) <strong>coal</strong> production will remain between<br />
40 <strong>and</strong> 50 million tons throughout the next two decades,<br />
possibly rising over 50 million tons starting in 2030.<br />
The UGS estimates that <strong>Utah</strong>’s <strong>coal</strong> production for 2010 will<br />
decline to 19.1 million tons, the lowest level since 1988.<br />
Production should rebound in 2011 to about 22 million<br />
tons, assuming full-year longwall operation at Deer Creek<br />
(Deer Creek’s longwall was refurbished in 2010, eliminating<br />
three months <strong>of</strong> mining) <strong>and</strong> a return by Dugout <strong>and</strong><br />
West Ridge to producing closer to their past annual average<br />
tonnage. Because <strong>of</strong> the recent closures <strong>of</strong> the Cr<strong>and</strong>all<br />
Canyon, Aberdeen, <strong>and</strong> Bear Canyon mines, production<br />
will remain in the low 20-millions until at least 2014 when<br />
the Lila Canyon mine is expected to begin longwall mining.<br />
Declining reserves at many existing mines suggest that the<br />
future <strong>of</strong> <strong>Utah</strong> <strong>coal</strong> production will depend on new mines<br />
opening in new areas.<br />
Prices<br />
EIA projects that the average U.S. mine-mouth <strong>coal</strong> price<br />
will increase annually by 1.2% from $32.13 per ton in<br />
2009 to $33.86 per ton in 2015 (figure 2). Between 2015<br />
<strong>and</strong> 2035, the average U.S. <strong>coal</strong> price is projected to increase<br />
by 1.7% each year to about $47 per ton as mining<br />
becomes more difficult in many regions <strong>of</strong> the United<br />
States. The average mine-mouth price <strong>of</strong> Rocky Mountain<br />
Region (<strong>Utah</strong> <strong>and</strong> Colorado) <strong>coal</strong> was $32.96 per ton in<br />
2009 <strong>and</strong> is predicted to steadily increase at an average<br />
rate <strong>of</strong> 2.7% to roughly $61 per ton in 2035 (figure 3). In<br />
comparison, Powder River Basin <strong>coal</strong> is predicted to rise<br />
from $11.12 per ton to $25 at an average rate <strong>of</strong> 3.1% per<br />
year; Appalachian <strong>coal</strong> should rise from $60.95 to $88 at<br />
an average rate <strong>of</strong> 1.6% per year; <strong>and</strong> Interior <strong>coal</strong> should<br />
rise from $31.45 to $60 at an average rate <strong>of</strong> 2.4% per year.<br />
Responses to UGS questionnaires indicate that the average<br />
mine-mouth price for <strong>Utah</strong> <strong>coal</strong> decreased from $18.47<br />
per ton in 2002 to $16.64 in 2003, the lowest price in the<br />
past 30 years. Since 2003, prices have increased by 71%<br />
to an average <strong>of</strong> $28.40 per ton in 2009 (table 2; figure<br />
4). The average price <strong>of</strong> <strong>Utah</strong> <strong>coal</strong> is strongly influenced<br />
by long-term contracts; some <strong>Utah</strong> mines were selling <strong>coal</strong><br />
in 2009 for only about $20.00 per ton. Conversely, current<br />
spot prices for <strong>Utah</strong> <strong>coal</strong> are as high as $40.00 per ton,<br />
which indicates upward pressure on the price <strong>of</strong> <strong>Utah</strong> <strong>coal</strong><br />
as old, low-priced contracts expire. Available information<br />
indicates that the average <strong>Utah</strong> <strong>coal</strong> price will remain near<br />
$28 per ton in 2010. As mining moves to thinner beds, the<br />
out-<strong>of</strong>-bed dilution will cause ash contents to rise, which<br />
may require operators to wash their <strong>coal</strong> to meet contract
<strong>Annual</strong> <strong>review</strong> <strong>and</strong> <strong>forecast</strong> <strong>of</strong> <strong>Utah</strong> <strong>coal</strong> production <strong>and</strong> distribution—2009 21<br />
Million short tons<br />
1500<br />
1200<br />
900<br />
600<br />
Appalachia<br />
Interior<br />
West<br />
Rocky Mountain - UT <strong>and</strong> CO<br />
Powder River Basin<br />
U.S. Total<br />
300<br />
0<br />
1970 1975 1980 1985 1990 1995 2000 2005 2010 2015 2020 2025 2030 2035<br />
Source: U.S. Energy Information Administration, <strong>Annual</strong> Energy Outlook 2010<br />
Note: Data available in appendix table A1<br />
Figure 1. U.S. <strong>coal</strong> production by region, 1970–2035.<br />
Dollars per short ton<br />
$100<br />
$80<br />
$60<br />
$40<br />
Appalachia - nominal $<br />
Appalachia -2008 $<br />
Interior - nominal $<br />
Interior - 2008 $<br />
West - nominal $<br />
West - 2008 $<br />
U.S. Average - nominal $<br />
U.S. Average - 2008 $<br />
$20<br />
$0<br />
1990 1995 2000 2005 2010 2015 2020 2025 2030 2035<br />
Source: U.S. Energy Information Administration, <strong>Annual</strong> Energy Outlook 2010<br />
Note: Data available in appendix table A2<br />
Figure 2. Average mine-mouth price <strong>of</strong> U.S. <strong>coal</strong> by region, 1990–2035.
22<br />
<strong>Utah</strong> <strong>Geological</strong> <strong>Survey</strong><br />
$60<br />
Rocky Mountain Bituminous (UT <strong>and</strong> CO) - nominal $<br />
Rocky Mountain Bituminous (UT <strong>and</strong> CO) - 2008 $<br />
Powder River Basin - nominal $<br />
Powder River Basin - 2008 $<br />
Dollars per short ton<br />
$40<br />
$20<br />
$0<br />
2005 2010 2015 2020 2025 2030 2035<br />
Source: U.S. Energy Information Administration, <strong>Annual</strong> Energy Outlook 2010<br />
Note: Data available in appendix table A2<br />
Figure 3. Average mine-mouth price <strong>of</strong> Rocky Mountain <strong>and</strong> Powder River Basin <strong>coal</strong>, 2005–2035.<br />
$80<br />
nominal $<br />
real 2010 $<br />
$60<br />
Dollars per short ton<br />
$40<br />
$20<br />
$0<br />
1960 1965 1970 1975 1980 1985 1990 1995 2000 2005 2010<br />
Source: U.S. Energy Information Administration, <strong>Annual</strong> Energy Outlook 2010<br />
Note: Data available in appendix table A3<br />
Figure 4. Average mine-mouth price <strong>of</strong> <strong>Utah</strong> <strong>coal</strong>, 1960–2010.
<strong>Annual</strong> <strong>review</strong> <strong>and</strong> <strong>forecast</strong> <strong>of</strong> <strong>Utah</strong> <strong>coal</strong> production <strong>and</strong> distribution—2009 23<br />
quality specifications. Coal washing in <strong>Utah</strong> is already underway<br />
at the Castle Valley Preparation Plant <strong>and</strong> at the<br />
Wellington Cleaning Facility. Washing <strong>coal</strong> adds roughly $2<br />
to $4 per ton to its delivered price. Nevertheless, <strong>Utah</strong> <strong>coal</strong><br />
will always have to compete with lower-cost Powder River<br />
Basin <strong>coal</strong> for market share.<br />
Distribution <strong>and</strong> Consumption<br />
EIA projects that domestic consumption <strong>of</strong> <strong>coal</strong> will drop<br />
to 1015 million tons in 2009, <strong>of</strong> which 952 million tons,<br />
or 93.8%, will be consumed by electric power plants. This<br />
represents a 9.4% drop from 2008 consumption numbers<br />
due to lower dem<strong>and</strong> during the recession. However,<br />
consumption is expected to rebound <strong>and</strong> is projected to<br />
increase by 0.6% per year <strong>and</strong> reach 1319 million tons<br />
by 2035, with 1183 million tons <strong>of</strong> <strong>coal</strong> going to electric<br />
utilities (figure 5). Similar to production estimates, these<br />
<strong>forecast</strong>ed numbers are less than in previous years as<br />
modelers predict a slowdown in the building <strong>of</strong> <strong>coal</strong>-fired<br />
electric plants. EIA also predicts that U.S. consumption at<br />
<strong>coal</strong>-to-liquids plants will begin in 2011 <strong>and</strong> total 68 million<br />
tons by 2035—an optimistic <strong>forecast</strong>.<br />
For 2009 <strong>and</strong> beyond, distribution <strong>of</strong> <strong>Utah</strong> <strong>coal</strong> is expected<br />
to parallel predicted rates <strong>of</strong> production. For example,<br />
with production expected to decrease 12.9% in 2010, distribution<br />
<strong>of</strong> <strong>Utah</strong> <strong>coal</strong> should decrease commensurately by<br />
13.2% to 17.9 million tons (table 8).<br />
Coal consumption in <strong>Utah</strong> remained fairly steady from<br />
2004 to 2008, averaging 17.5 million tons each year, with<br />
most <strong>of</strong> this <strong>coal</strong> (16.6 million tons) burned at electric<br />
power plants (table 12, figure 6). However, due to the slow<br />
economy in 2009, <strong>coal</strong> consumption dropped 6.7% to 16.6<br />
million tons, <strong>of</strong> which 15.9 million tons went to electric<br />
utilities, down from the record-high <strong>of</strong> 16.9 million tons in<br />
2008. Coal consumption is expected to rebound in 2010 to<br />
17.1 million tons as dem<strong>and</strong> for electricity slowly returns.<br />
In the past few years, <strong>Utah</strong> has added over 1300 megawatts<br />
<strong>of</strong> electric capacity from new natural gas-fired power<br />
plants. This new gas-fired capacity has reduced <strong>coal</strong>’s contribution<br />
to <strong>Utah</strong>’s electric generation from 94.2% in 2005<br />
to 82.5% in 2009, while natural gas’ share increased from<br />
3.1% in 2005 to 14.6% in 2009 (see appendix table A6).<br />
Plans for proposed <strong>coal</strong> plants in <strong>Utah</strong> have been delayed<br />
due to lawsuits <strong>and</strong> permit problems stemming from uncertainties<br />
surrounding regulation <strong>of</strong> greenhouse gases,<br />
as well as other air quality issues. In fact, Rocky Mountain<br />
Power has announced that they will not build a new <strong>coal</strong>fired<br />
power plant until carbon mitigation rules are developed<br />
<strong>and</strong> effective strategies identified. Until then, their<br />
<strong>Utah</strong> <strong>coal</strong> consumption will likely remain near current<br />
levels.<br />
One possible exception to steady future dem<strong>and</strong> will be if<br />
a foreign export market develops again. Because <strong>Utah</strong> is a<br />
long distance from <strong>coal</strong> export terminals, this possibility<br />
requires favorable exchange rates or higher <strong>coal</strong> commodity<br />
prices to <strong>of</strong>fset transportation cost.<br />
1500<br />
Electric Utilities<br />
Other<br />
1200<br />
Coal-to-Liquids<br />
U.S. Total<br />
Million short tons<br />
900<br />
600<br />
300<br />
0<br />
1970 1980 1990 2000 2010 2020 2030<br />
Source: U.S. Energy Information Administration, <strong>Annual</strong> Energy Outlook 2010<br />
Note: Data available in appendix table A3<br />
Figure 5. U.S. <strong>coal</strong> consumption by sector, 1970–2035.
24<br />
<strong>Utah</strong> <strong>Geological</strong> <strong>Survey</strong><br />
18,000<br />
Thous<strong>and</strong> short tons<br />
15,000<br />
12,000<br />
9,000<br />
6,000<br />
Transportation<br />
Residential <strong>and</strong> Commercial<br />
Other Industrial<br />
Coke Plates<br />
Electric Utilities<br />
3,000<br />
0<br />
1960 1965 1970 1975 1980 1985 1990 1995 2000 2005 2010<br />
Source: U.S. Energy Information Administration, <strong>Annual</strong> Coal Report, 2008; UGS<br />
Note: 2010 values are estimated, data available in table 12<br />
Figure 6. Consumption <strong>of</strong> <strong>coal</strong> in <strong>Utah</strong> by end use, 1960–2010.<br />
Reserves<br />
The Kaiparowits Plateau <strong>coal</strong>field is estimated to contain<br />
about 9.1 billion tons, or 60.6%, <strong>of</strong> <strong>Utah</strong>’s remaining potentially<br />
recoverable <strong>coal</strong> (figure 7); however, most <strong>of</strong> this<br />
<strong>coal</strong> cannot be developed because it lies within the Gr<strong>and</strong><br />
Staircase-Escalante National Monument. Other nonproducing<br />
<strong>Utah</strong> <strong>coal</strong>fields with good quality resources are far<br />
from transportation networks <strong>and</strong> require higher prices<br />
to justify the higher transportation costs. As a result, <strong>Utah</strong><br />
<strong>coal</strong> production will continue to rely heavily on resources<br />
in the Wasatch Plateau <strong>coal</strong>field, estimated at 1.3 billion<br />
tons; the Emery <strong>coal</strong>field, estimated at 0.8 billion tons;<br />
<strong>and</strong> the Book Cliffs <strong>coal</strong>field, with resources estimated at<br />
0.7 billion tons. (Note: resource estimates are only constrained<br />
by geologic conditions, whereas reserve estimates<br />
are also constrained by economic factors).<br />
Reserves could also be reduced at existing mines if regulators<br />
require companies to modify their mine plans (e.g.,<br />
insertion <strong>of</strong> barrier pillars between longwall sections) as<br />
production gets deeper. <strong>Utah</strong> <strong>coal</strong> mines are working with<br />
state <strong>and</strong> federal regulators to both maximize miner safety<br />
<strong>and</strong> the amount <strong>of</strong> recoverable <strong>coal</strong> in order to maintain a<br />
sustainable industry.<br />
Most <strong>Utah</strong> mining companies have leased <strong>coal</strong> reserves<br />
sufficient for 10 to 15 years <strong>of</strong> production. However, mines<br />
are having a harder time adding new leases to extend their<br />
reserve base. Figure 8 demonstrates this fact; subtracting<br />
cumulative production from cumulative tonnage leased<br />
from 1975 to 2009 shows a general negative trend indicating<br />
that <strong>Utah</strong> production is outpacing tonnage leased. In<br />
fact, the Cottonwood (recently leased to Canyon Fuel Company)<br />
<strong>and</strong> North Horn tracts, both located in the central<br />
Wasatch Plateau, may represent the last large virgin tracts<br />
<strong>of</strong> good quality, accessible <strong>coal</strong> that are not adjacent to an<br />
operating mine. Combined reserves in these two tracts are<br />
estimated to exceed 100 million tons <strong>and</strong> could provide 20<br />
to 30 years <strong>of</strong> production for two longwall operations. In<br />
addition, other reserves exist in the southern Book Cliffs<br />
where <strong>Utah</strong>American has begun development work on the<br />
Lila Canyon mine. In total, the UGS estimated in 2002 that<br />
roughly 275 million tons <strong>of</strong> reserves were available in the<br />
Wasatch Plateau <strong>coal</strong>field, 686 million tons in the Book<br />
Cliffs, <strong>and</strong> 200 million tons in the Emery <strong>coal</strong>field, for a<br />
total <strong>of</strong> 1.16 billion tons (as recorded in Appendix 25 <strong>of</strong> the<br />
BLM Price Field Office Draft Resource Management Plan,<br />
2004). From 2003 to 2009, the reserves in the Wasatch<br />
Plateau <strong>coal</strong>field were diminished by 103 million tons, in<br />
the Book Cliffs by 58 million tons, <strong>and</strong> in the Emery <strong>coal</strong>field<br />
by 6 million tons. Thus, in 2010, the remaining 993<br />
million tons <strong>of</strong> reserves in <strong>Utah</strong>’s three producing fields<br />
could support annual production <strong>of</strong> 25 million tons for<br />
about 40 more years. However, factors such as <strong>coal</strong> quality,<br />
access, <strong>and</strong> other environmental or safety issues were<br />
not considered in the 2002 reserve calculation, so the actual<br />
recoverable reserves may be less than the in-ground<br />
estimate.<br />
The rapid depletion <strong>of</strong> central <strong>Utah</strong> <strong>coal</strong> will require future<br />
operators to consider difficult, lower-quality, or remote<br />
<strong>coal</strong> resources. For example, the Emery mine in the
<strong>Annual</strong> <strong>review</strong> <strong>and</strong> <strong>forecast</strong> <strong>of</strong> <strong>Utah</strong> <strong>coal</strong> production <strong>and</strong> distribution—2009 25<br />
Kolob<br />
5.4%<br />
805 Mst<br />
Emery<br />
5.3%<br />
802 Mst<br />
Book Cliffs<br />
4.5%<br />
677 Mst<br />
Henry Mountains<br />
3.2%<br />
485 Mst<br />
Other<br />
5.5%<br />
825 Mst<br />
Alton<br />
7.0%<br />
1056 Mst<br />
Wasatch Plateau<br />
8.4%<br />
1268 Mst<br />
Kaiparowits<br />
60.6%<br />
9096 Mst<br />
Source: Smith <strong>and</strong> Jahanbani, 1988; Quick <strong>and</strong> others, 2004; Bon <strong>and</strong> others, 2006<br />
Note: Mst – Million short tons, data available in appendix table A4<br />
Figure 7. Remaining estimated recoverable resources in <strong>Utah</strong> by <strong>coal</strong>field, 2009.<br />
40<br />
20<br />
0<br />
Cumulative tonnage leased<br />
minus cumulative production<br />
Reggression line showing<br />
negative trend<br />
Million short tons<br />
-20<br />
-40<br />
-60<br />
-80<br />
-100<br />
1975 1980 1985 1990 1995 2000 2005<br />
Source: BLM, SITLA, UGS<br />
Note: The negative trend indicates <strong>coal</strong> is being produced faster than new tonnage is being leased.<br />
Figure 8. Net increase/loss <strong>of</strong> new <strong>coal</strong> tonnage leased in <strong>Utah</strong> compared to cumulative production,<br />
1975–2009.<br />
southern part <strong>of</strong> the Emery <strong>coal</strong>field is located near unleased<br />
resources that could total more than 100 million<br />
tons, including resources in the Hidden Valley area, but<br />
these resources tend to have higher sulfur contents. Also,<br />
the proposed mine in the Alton <strong>coal</strong>field could produce up<br />
to 2.0 million tons per year <strong>of</strong> subbituminous <strong>coal</strong> from a<br />
projected reserve base <strong>of</strong> 40 to 45 million tons. These resources,<br />
<strong>and</strong> others, may become more attractive if prices<br />
keep rising <strong>and</strong> <strong>coal</strong> washing becomes more economic.
26<br />
REFERENCES<br />
Bon, R.L., Quick, J.C., Wakefield, S.I., Hucka, B.P., <strong>and</strong> Tabet,<br />
D.E., 2006, The available <strong>coal</strong> resource for eight<br />
7.5-minute quadrangles in the Alton Coalfield, Kane<br />
County, <strong>Utah</strong>: <strong>Utah</strong> <strong>Geological</strong> <strong>Survey</strong> Special Study<br />
118, 23 p.<br />
Quick, J.C., Tabet, D.E., Hucka, B.P., <strong>and</strong> Wakefield, S.I., 2004,<br />
The available <strong>coal</strong> resource for eight 7.5 minute quadrangles<br />
in the southern Emery Coalfield, Emery <strong>and</strong><br />
Sevier Counties, <strong>Utah</strong>: <strong>Utah</strong> <strong>Geological</strong> <strong>Survey</strong> Special<br />
Study 112, 37 p.<br />
Smith, A.D. <strong>and</strong> Jahanbani, F.R., 1988, <strong>Annual</strong> production<br />
<strong>and</strong> distribution <strong>of</strong> <strong>coal</strong> in <strong>Utah</strong>, 1987: <strong>Utah</strong> <strong>Geological</strong><br />
<strong>and</strong> Mineral <strong>Survey</strong> Circular 80, 8 p.<br />
U.S. Bureau <strong>of</strong> L<strong>and</strong> Management, July 2004, Price Field<br />
Office Resource Management Plan, Appendix 25, Coal<br />
Report: Online, www.blm.gov/ut/st/en/fo/price/<br />
planning/Resource_Management_Plan/Draft_EIS.<br />
html<br />
U.S. Energy Information Administration, January 2010,<br />
Electric Power <strong>Annual</strong>, 2008: Online, www.eia.doe.<br />
gov/cneaf/electricity/epa/epa_sum.html<br />
<strong>Utah</strong> <strong>Geological</strong> <strong>Survey</strong><br />
U.S. Energy Information Administration, September 2009,<br />
<strong>Annual</strong> Coal Report 2008: Online, www.eia.doe.gov/<br />
cneaf/<strong>coal</strong>/page/acr/acr_sum.html<br />
U.S. Energy Information Administration, April 2010, Quarterly<br />
Coal Report—December-October 2009: Online,<br />
tonto.eia.doe.gov/FTPROOT/<strong>coal</strong>/qcrhistory.htm<br />
U.S. Energy Information Administration, May 2010, <strong>Annual</strong><br />
Coal Distribution 2008: Online, www.eia.doe.gov/<br />
cneaf/<strong>coal</strong>/page/<strong>coal</strong>distrib/a_distributions.html<br />
U.S. Energy Information Administration, April 2010, Quarterly<br />
Coal Distribution—December-October 2009:<br />
Online, www.eia.doe.gov/cneaf/<strong>coal</strong>/page/<strong>coal</strong>distrib/qtr/q_distributions.html<br />
U.S. Energy Information Administration, October 2009,<br />
U.S. Crude Oil, Natural Gas, <strong>and</strong> Natural Gas Liquids<br />
Reserves, 2008: Online, www.eia.doe.gov/oil_gas/<br />
natural_gas/data_publications/crude_oil_natural_<br />
gas_reserves/cr.html<br />
U.S. Energy Information Administration, May 2010, <strong>Annual</strong><br />
Energy Outlook 2010: Online, www.eia.doe.gov/<br />
oiaf/aeo/index.html<br />
U.S. Energy Information Administration, March 2010,<br />
Electric Power Monthly: Online, www.eia.doe.gov/<br />
cneaf/electricity/epm/matrix96_2000.html
<strong>Annual</strong> <strong>review</strong> <strong>and</strong> <strong>forecast</strong> <strong>of</strong> <strong>Utah</strong> <strong>coal</strong> production <strong>and</strong> distribution—2009 27<br />
APPENDIX
28<br />
<strong>Utah</strong> <strong>Geological</strong> <strong>Survey</strong><br />
Table A1. U.S. <strong>coal</strong> production by region, 1970–2035.<br />
Million short tons<br />
Year Appalachia Interior West<br />
Rocky<br />
Mountain -<br />
UT <strong>and</strong> CO<br />
Powder<br />
River<br />
Basin<br />
U.S.<br />
Total<br />
Year Appalachia Interior West<br />
Rocky<br />
Mountain -<br />
UT <strong>and</strong> CO<br />
Powder<br />
River<br />
Basin<br />
U.S.<br />
Total<br />
1970 427.6 149.9 35.1 na na 612.6 2003 388.4 146.3 548.7 58.9 363.4 1,083.4<br />
1971 382.3 136.3 42.3 na na 560.9 2004 390.7 146.3 575.2 61.7 381.7 1,112.1<br />
1972 394.4 157.5 50.6 na na 602.5 2005 397.3 149.2 585.0 63.0 390.1 1,131.5<br />
1973 381.6 156.4 60.5 na na 598.5 2006 391.9 151.4 619.4 62.3 431.1 1,162.7<br />
1974 384.3 150.2 75.5 na na 610.0 2007 378.5 147.1 621.0 60.7 436.5 1,146.6<br />
1975 402.7 162.1 89.8 na na 654.6 2008 391.2 147.0 633.6 56.4 451.7 1,171.8<br />
1976 412.4 162.0 110.6 na na 685.0 2009 350.6 144.1 587.4 50.3 417.7 1,082.1<br />
1977 399.7 163.8 133.8 na na 697.3 2010 323.0 147.1 592.1 46.2 434.9 1,062.2<br />
1978 374.9 146.2 149.0 na na 670.1 2011 325.6 150.8 643.9 47.6 480.5 1,120.2<br />
1979 429.5 170.2 181.4 na na 781.1 2012 324.9 162.7 661.4 48.2 485.5 1,148.9<br />
1980 444.3 176.3 209.1 na na 829.7 2013 329.9 165.8 663.1 45.8 487.9 1,158.8<br />
1981 433.0 166.6 224.1 na na 823.7 2014 322.2 179.3 678.3 45.2 499.6 1,179.7<br />
1982 433.2 178.2 226.8 na na 838.2 2015 316.9 184.4 653.6 47.5 470.3 1,154.9<br />
1983 383.1 173.7 225.3 na na 782.1 2016 312.2 191.1 663.5 47.5 477.3 1,166.8<br />
1984 444.0 198.0 253.8 na na 895.8 2017 309.3 197.4 661.0 47.1 473.1 1,167.7<br />
1985 427.2 187.8 268.7 na na 883.7 2018 311.7 200.1 670.8 46.9 480.7 1,182.6<br />
1986 428.5 196.6 265.2 na na 890.3 2019 309.2 198.1 681.5 46.0 489.1 1,188.7<br />
1987 443.3 201.7 273.8 na na 918.8 2020 304.8 198.0 680.6 44.9 487.5 1,183.4<br />
1988 449.4 193.0 307.9 na na 950.3 2021 304.6 199.2 703.3 44.9 506.6 1,207.1<br />
1989 464.5 197.9 318.4 na na 980.8 2022 295.2 200.1 713.4 43.5 516.0 1,208.6<br />
1990 489.0 205.7 334.4 40.9 151.0 1,029.1 2023 294.1 195.3 725.7 43.3 527.1 1,215.1<br />
1991 457.8 195.4 342.8 39.7 161.9 996.0 2024 291.6 195.6 720.0 43.0 519.9 1,207.2<br />
1992 462.6 195.7 345.3 40.2 158.8 1,003.5 2025 291.4 198.7 744.1 42.8 539.0 1,234.2<br />
1993 416.1 167.2 368.5 43.6 184.2 951.8 2026 281.6 197.5 737.6 42.1 531.5 1,216.8<br />
1994 453.3 179.9 408.3 49.7 199.1 1,041.4 2027 281.5 198.4 752.3 41.8 543.2 1,232.1<br />
1995 443.4 168.5 429.6 50.8 228.6 1,041.5 2028 280.3 199.1 761.1 44.4 548.9 1,240.5<br />
1996 460.7 172.8 439.1 52.0 244.0 1,072.7 2029 276.2 190.2 766.8 47.0 547.7 1,233.2<br />
1997 475.9 170.9 451.3 53.8 260.0 1,098.0 2030 278.0 197.3 784.7 49.7 559.1 1,260.1<br />
1998 469.4 168.4 488.8 56.2 293.4 1,126.5 2031 268.2 197.6 784.0 51.8 553.7 1,249.8<br />
1999 435.2 162.5 512.3 56.5 316.9 1,110.0 2032 272.1 200.9 788.7 53.1 553.5 1,261.8<br />
2000 429.5 143.5 510.7 56.0 323.0 1,083.7 2033 270.3 197.9 793.2 54.8 555.1 1,261.4<br />
2001 443.4 147.0 547.9 60.4 354.0 1,138.3 2034 271.6 203.0 790.8 57.7 548.9 1,265.4<br />
2002 408.1 146.9 550.4 60.4 359.5 1,105.4 2035 277.1 207.8 799.9 60.3 550.7 1,284.8<br />
Source: U.S. Energy Information Administration, <strong>Annual</strong> Energy Outlook, 2010<br />
Note: The 2009 total is <strong>forecast</strong>, hence it does not match the actual 2009 total recorded in table 1
<strong>Annual</strong> <strong>review</strong> <strong>and</strong> <strong>forecast</strong> <strong>of</strong> <strong>Utah</strong> <strong>coal</strong> production <strong>and</strong> distribution—2009 29<br />
Table A2. Average mine-mouth price <strong>of</strong> U.S. <strong>coal</strong> by region, 1990–2035.<br />
Dollars per short ton<br />
Year Appalachia Interior West<br />
Nominal<br />
dollars<br />
Real<br />
2008<br />
dollars<br />
Nominal<br />
dollars<br />
Real<br />
2008<br />
dollars<br />
Nominal<br />
dollars<br />
Real<br />
2008<br />
dollars<br />
Rocky Mountain -<br />
<strong>Utah</strong> <strong>and</strong> Colorado<br />
(bituminous)<br />
Nominal<br />
dollars<br />
Real<br />
2008<br />
dollars<br />
Powder River Basin<br />
Nominal<br />
dollars<br />
Real<br />
2008<br />
dollars<br />
U.S. Average<br />
Nominal<br />
dollars<br />
Real<br />
2008<br />
dollars<br />
1990 28.89 47.59 21.45 35.33 11.60 19.11 na na na na 21.76 35.84<br />
1991 28.69 45.35 21.86 34.56 11.71 18.51 na na na na 21.49 33.97<br />
1992 27.94 42.88 21.61 33.16 11.60 17.80 na na na na 21.03 32.27<br />
1993 27.64 41.19 20.03 29.84 11.14 16.60 na na na na 19.85 29.58<br />
1994 27.36 39.75 19.87 28.87 10.57 15.36 na na na na 19.41 28.20<br />
1995 27.45 38.78 18.81 26.58 10.15 14.34 na na na na 18.83 26.60<br />
1996 26.79 36.76 18.41 25.27 10.03 13.77 na na na na 18.50 25.39<br />
1997 26.55 35.62 17.91 24.03 9.52 12.78 na na na na 18.14 24.33<br />
1998 26.85 35.46 18.45 24.37 8.76 11.58 na na na na 17.67 23.34<br />
1999 25.58 33.06 18.52 23.94 8.59 11.10 na na na na 16.63 21.49<br />
2000 25.99 32.50 18.37 22.96 8.72 10.91 na na na na 16.78 20.98<br />
2001 27.55 33.49 20.14 24.49 9.06 11.01 na na na na 17.59 21.38<br />
2002 28.68 34.33 20.12 24.07 9.55 11.43 na na na na 17.90 21.42<br />
2003 29.02 33.96 19.65 22.99 9.84 11.52 na na na na 17.93 20.98<br />
2004 34.31 39.11 20.66 23.55 10.24 11.67 18.35 20.92 6.85 7.80 20.07 22.87<br />
2005 41.62 45.88 22.82 25.16 11.01 12.14 21.25 23.43 7.25 8.00 23.32 25.71<br />
2006 44.37 47.39 24.96 26.65 11.99 12.80 23.68 25.28 7.65 8.17 24.59 26.26<br />
2007 46.16 47.94 27.18 28.23 13.10 13.61 26.01 27.02 9.92 10.30 25.82 26.82<br />
2008 58.37 58.37 31.40 31.40 14.49 14.49 29.91 29.91 10.92 10.92 31.26 31.26<br />
2009 60.95 60.03 31.45 30.98 15.10 14.87 32.96 32.47 11.12 10.96 32.13 31.65<br />
2010 59.69 57.94 32.74 31.79 15.07 14.63 34.84 33.82 11.46 11.13 31.08 30.17<br />
2011 59.45 56.96 33.57 32.16 15.38 14.74 34.86 33.40 12.17 11.66 30.64 29.36<br />
2012 60.95 57.58 35.87 33.88 15.91 15.03 35.11 33.17 12.55 11.85 31.47 29.73<br />
2013 62.31 57.85 36.71 34.08 16.29 15.13 35.37 32.84 12.93 12.00 32.31 30.00<br />
2014 63.39 57.85 38.91 35.51 16.73 15.26 35.63 32.52 13.37 12.20 32.84 29.97<br />
2015 64.32 57.72 40.38 36.23 17.25 15.48 36.26 32.54 13.52 12.13 33.86 30.38<br />
2016 65.64 57.86 41.97 37.00 17.63 15.54 36.92 32.55 13.86 12.22 34.46 30.38<br />
2017 67.02 58.01 42.91 37.14 18.07 15.64 37.55 32.51 14.19 12.28 35.23 30.50<br />
2018 68.55 58.25 43.59 37.04 18.50 15.72 38.16 32.43 14.62 12.42 35.94 30.54<br />
2019 69.63 58.10 44.05 36.76 18.68 15.58 38.44 32.07 14.82 12.37 36.16 30.17<br />
2020 70.98 58.08 44.60 36.49 19.00 15.55 38.89 31.82 15.13 12.38 36.67 30.01<br />
2021 72.29 57.92 44.64 35.77 19.43 15.57 39.56 31.70 15.70 12.58 36.92 29.59<br />
2022 73.15 57.36 44.92 35.22 19.95 15.64 40.24 31.55 16.32 12.80 37.07 29.07<br />
2023 74.64 57.29 45.07 34.59 20.42 15.67 40.95 31.43 16.86 12.94 37.50 28.78<br />
2024 75.27 56.60 45.46 34.18 20.93 15.74 41.55 31.24 17.33 13.03 38.03 28.60<br />
2025 75.28 55.47 46.52 34.28 21.55 15.88 42.19 31.09 18.01 13.27 38.25 28.19<br />
2026 75.29 54.35 47.47 34.26 22.10 15.95 43.01 31.05 18.53 13.38 38.53 27.81<br />
2027 76.55 54.12 48.48 34.27 22.71 16.05 43.85 31.00 19.22 13.59 39.16 27.68<br />
2028 77.66 53.73 49.70 34.39 23.36 16.16 45.05 31.18 19.89 13.77 39.86 27.58<br />
2029 78.71 53.30 50.18 33.98 24.20 16.39 46.58 31.55 20.58 13.94 40.42 27.37<br />
2030 80.24 53.17 51.64 34.21 25.06 16.60 48.40 32.07 21.38 14.17 41.40 27.43<br />
2031 81.46 52.79 52.87 34.27 25.98 16.84 50.64 32.82 22.11 14.33 42.14 27.31<br />
2032 82.94 52.58 54.56 34.59 26.85 17.02 52.98 33.59 22.80 14.45 43.36 27.49<br />
2033 84.25 52.28 55.60 34.50 27.77 17.23 55.37 34.36 23.58 14.63 44.24 27.45<br />
2034 86.05 52.29 57.54 34.96 28.75 17.47 58.26 35.40 24.24 14.73 45.67 27.75<br />
2035 88.40 52.60 59.84 35.61 29.69 17.67 60.51 36.01 24.96 14.85 47.23 28.10<br />
Source: U.S. Energy Information Administration, <strong>Annual</strong> Energy Outlook, 2010
30<br />
<strong>Utah</strong> <strong>Geological</strong> <strong>Survey</strong><br />
Table A3. U.S. <strong>coal</strong> consumption by sector, 1970–2035.<br />
Million short tons<br />
Year<br />
Electric<br />
Utilities<br />
Other<br />
Coal-to- U.S. Total Year Electric<br />
Liquids 1 Utilities<br />
Other<br />
Coal-to-<br />
Liquids 1<br />
1970 320 203 -- 523 2003 1,005 90 -- 1,095<br />
1971 327 174 -- 502 2004 1,016 91 -- 1,107<br />
1972 352 172 -- 524 2005 1,037 88 -- 1,126<br />
1973 389 173 -- 563 2006 1,027 86 -- 1,112<br />
1974 392 167 -- 558 2007 1,045 83 0 1,128<br />
1975 406 157 -- 563 2008 1,041 80 0 1,121<br />
1976 448 155 -- 604 2009 952 63 0 1,015<br />
1977 477 148 -- 625 2010 971 64 0 1,035<br />
1978 481 144 -- 625 2011 1,026 67 0 1,094<br />
1979 527 153 -- 681 2012 1,049 71 2 1,122<br />
1980 569 133 -- 703 2013 1,058 74 5 1,137<br />
1981 597 136 -- 733 2014 1,069 76 18 1,163<br />
1982 594 113 -- 707 2015 1,044 76 21 1,141<br />
1983 625 111 -- 737 2016 1,054 76 23 1,153<br />
1984 664 127 -- 791 2017 1,052 77 26 1,155<br />
1985 694 124 -- 818 2018 1,063 77 28 1,167<br />
1986 685 119 -- 804 2019 1,072 77 30 1,179<br />
1987 718 119 -- 837 2020 1,073 77 32 1,183<br />
1988 758 125 -- 884 2021 1,091 77 35 1,202<br />
1989 772 123 -- 895 2022 1,099 76 37 1,211<br />
1990 783 122 -- 904 2023 1,103 76 39 1,217<br />
1991 784 115 -- 899 2024 1,096 75 41 1,213<br />
1992 795 113 -- 908 2025 1,116 75 44 1,235<br />
1993 832 112 -- 944 2026 1,111 75 47 1,233<br />
1994 838 113 -- 951 2027 1,121 74 49 1,245<br />
1995 850 112 -- 962 2028 1,132 74 52 1,257<br />
1996 897 109 -- 1,006 2029 1,129 73 54 1,256<br />
1997 921 108 -- 1,030 2030 1,147 72 57 1,276<br />
1998 937 100 -- 1,037 2031 1,150 72 60 1,281<br />
1999 941 98 -- 1,039 2032 1,161 71 62 1,294<br />
2000 986 98 -- 1,084 2033 1,157 70 64 1,291<br />
2001 964 96 -- 1,060 2034 1,161 69 67 1,297<br />
2002 978 89 -- 1,066 2035 1,183 68 68 1,319<br />
Source: U.S. Energy Information Administration, <strong>Annual</strong> Energy Outlook, 2010<br />
1<br />
Liquids production <strong>and</strong> liquids used for heat <strong>and</strong> power<br />
U.S.<br />
Total
<strong>Annual</strong> <strong>review</strong> <strong>and</strong> <strong>forecast</strong> <strong>of</strong> <strong>Utah</strong> <strong>coal</strong> production <strong>and</strong> distribution—2009 31<br />
Table A4. <strong>Utah</strong> <strong>coal</strong> resources by <strong>coal</strong>field, 2009.<br />
Million short tons<br />
Coalfield<br />
Original<br />
Principal<br />
Resource 1<br />
Original Estimated<br />
Recoverable Resource 2<br />
Cumulative<br />
Production<br />
1870–2009<br />
Remaining Estimated<br />
Recoverable Resource<br />
% <strong>of</strong> Total Remaining<br />
Estimated Recoverable<br />
Resource<br />
Kaiparowits 22,740.0 9,096.0 0.1 9,095.9 60.6%<br />
Wasatch Plateau 6,378.9 1,913.7 645.9 1,267.8 8.4%<br />
Alton 2,155.0 1,055.7 0.0 1,055.7 7.0%<br />
Kolob 2,014.3 805.9 0.9 805.0 5.4%<br />
Emery 2,336.0 817.6 15.6 802.0 5.3%<br />
Book Cliffs 3,527.3 1,033.5 356.4 677.1 4.5%<br />
Henry Mountains 925.5 484.7 0.0 484.7 3.2%<br />
Sego 1,144.0 343.2 2.7 340.5 2.3%<br />
Salina Canyon 692.7 207.8 0.5 207.3 1.4%<br />
Mt. Pleasant 249.1 99.6 0.0 99.6 0.7%<br />
Tabby Mountain 231.7 69.4 0.0 69.4 0.5%<br />
Vernal 177.1 53.2 0.5 52.7 0.4%<br />
Coalville 186.0 55.8 4.3 51.5 0.3%<br />
Wales 12.2 3.7 0.8 2.9 *<br />
Harmony 1.3 0.4 0.0 0.4 *<br />
Lost Creek 1.1 0.4 0.0 0.4 *<br />
Sterling 2.0 0.6 0.3 0.3 *<br />
Total 42,774.2 16,041.2 1,028.0 15,013.2<br />
Source: Smith <strong>and</strong> Jahanbani, 1988; Quick <strong>and</strong> others, 2004; Bon <strong>and</strong> others, 2006; production data from UGS <strong>coal</strong> company questionnaires<br />
Note: Estimated recoverable resources do not take into account economic or l<strong>and</strong> use constraints.<br />
1<br />
Total <strong>coal</strong> resource with no economic, l<strong>and</strong> use, or geologic constraints.<br />
2<br />
For Wasatch Plateau, Alton, Emery, Book Cliffs, <strong>and</strong> Henry Mountains; resources were constrained by a seam height minimum <strong>of</strong> four feet, with no more<br />
than 3000 feet <strong>of</strong> cover. For the remaining fields, resources were constrained by an estimated resource factor ranging from 30% to 40% <strong>of</strong> principal resources.<br />
* Value less than 0.1%<br />
Table A5. <strong>Utah</strong> <strong>coal</strong> resources by county, 2009.<br />
Million short tons<br />
County<br />
Original<br />
Principal<br />
Resource 1<br />
Original Estimated<br />
Recoverable Resource 2<br />
Cumulative<br />
Production<br />
1870–2009<br />
Remaining Estimated<br />
Recoverable Resource<br />
% <strong>of</strong> Total Remaining<br />
Estimated Recoverable<br />
Resource<br />
Kane 19,579.6 8,025.6 0.1 8,025.5 53.5%<br />
Garfield 7,493.1 3,106.3 0.0 3,106.3 20.7%<br />
Emery 4,457.7 1,392.9 385.7 1,007.1 6.7%<br />
Carbon 4,993.6 1,475.8 487.3 988.5 6.6%<br />
Sevier 3,257.4 1,036.0 146.1 889.9 5.9%<br />
Gr<strong>and</strong> 1,144.0 343.2 2.7 340.5 2.3%<br />
Iron 650.8 260.2 0.8 259.4 1.7%<br />
Sanpete 489.5 171.8 0.7 171.1 1.1%<br />
Wasatch 177.3 53.2 0.0 53.2 0.4%<br />
Uintah 177.1 53.2 0.3 52.9 0.4%<br />
Summit 186.0 55.8 4.3 51.5 0.3%<br />
Washington 86.1 34.4 0.0 34.4 0.2%<br />
Duchesne 53.9 16.2 0.0 16.2 0.1%<br />
Wayne 27.0 16.2 0.0 16.2 0.1%<br />
Morgan 1.1 0.4 0.0 0.4 *<br />
Total 42,774.2 16,041.2 1,028.0 15,013.2<br />
Source: Smith <strong>and</strong> Jahanbani, 1988; Quick <strong>and</strong> others, 2004; Bon <strong>and</strong> others, 2006; production data from UGS <strong>coal</strong> company questionnaires<br />
Note: Estimated recoverable resources do not take into account economic or l<strong>and</strong> use constraints.<br />
1<br />
Total <strong>coal</strong> resource with no economic, l<strong>and</strong> use, or geologic constraints.<br />
2<br />
For Emery, Sevier, Kane, Carbon, <strong>and</strong> Garfield Counties; resources were constrained by a seam height minimum <strong>of</strong> four feet, with no more than 3000 feet <strong>of</strong><br />
cover. For the remaining counties, resources were constrained by an estimated resource factor ranging from 30% to 40% <strong>of</strong> principal resources.<br />
* Value less than 0.1%
32<br />
<strong>Utah</strong> <strong>Geological</strong> <strong>Survey</strong><br />
Table A6. Net generation <strong>of</strong> electricity in <strong>Utah</strong> by energy source, 1960–2010.<br />
Gigawatthours<br />
Year Coal Petroleum<br />
Natural<br />
Gas<br />
Other<br />
Gases 1 Hydroelectric Geothermal 2 Wind<br />
L<strong>and</strong>fill<br />
Gas<br />
1960 1,130 1,314 290 na 304 0 0 0 0 3,038<br />
1961 1,210 1,236 374 na 231 0 0 0 0 3,051<br />
1962 998 934 433 na 391 0 0 0 0 2,756<br />
1963 923 876 413 na 350 0 0 0 0 2,562<br />
1964 855 824 324 na 762 0 0 0 0 2,765<br />
1965 779 866 392 na 910 0 0 0 0 2,947<br />
1966 1,001 765 700 na 788 0 0 0 0 3,254<br />
1967 909 748 611 na 1,071 0 0 0 0 3,339<br />
1968 931 758 444 na 1,014 0 0 0 0 3,147<br />
1969 806 872 287 na 1,114 0 0 0 0 3,079<br />
1970 948 956 307 na 738 0 0 0 0 2,949<br />
1971 894 905 287 na 981 0 0 0 0 3,067<br />
1972 1,165 657 320 na 1,220 0 0 0 0 3,362<br />
1973 2,007 146 342 na 1,111 0 0 0 0 3,606<br />
1974 2,678 69 312 na 941 0 0 0 0 4,000<br />
1975 4,366 82 283 na 1,074 0 0 0 0 5,805<br />
1976 2,739 32 183 na 1,130 0 0 0 0 4,084<br />
1977 5,533 116 421 na 757 0 0 0 0 6,827<br />
1978 7,238 90 565 na 734 0 0 0 0 8,627<br />
1979 9,408 122 458 na 802 0 0 0 0 10,790<br />
1980 10,870 63 358 na 821 0 0 0 0 12,112<br />
1981 10,869 40 230 na 623 0 0 0 0 11,762<br />
1982 10,635 29 203 na 1,024 0 0 0 0 11,891<br />
1983 10,921 40 69 na 1,394 0 0 0 0 12,424<br />
1984 12,321 30 8 na 1,391 38 0 0 0 13,788<br />
1985 14,229 40 14 na 1,019 110 0 0 0 15,412<br />
1986 15,155 74 6 na 1,413 172 0 0 0 16,820<br />
1987 25,221 92 13 na 856 164 0 0 0 26,346<br />
1988 28,806 59 5 na 593 174 0 0 0 29,637<br />
1989 29,676 48 37 na 562 173 0 0 0 30,496<br />
1990 31,524 52 146 182 508 152 0 0 0 32,564<br />
1991 28,889 51 550 204 627 186 0 0 0 30,507<br />
1992 31,553 34 631 230 602 233 0 0 0 33,283<br />
1993 32,126 37 606 281 860 187 0 0 0 34,097<br />
1994 33,131 33 807 281 750 233 0 0 0 35,235<br />
1995 30,611 36 791 261 969 168 0 0 0 32,836<br />
1996 31,101 47 324 239 1,049 223 0 0 0 32,983<br />
1997 32,544 47 328 281 1,344 203 0 0 0 34,747<br />
1998 33,588 35 528 285 1,315 195 0 0 0 35,946<br />
1999 34,534 31 610 191 1,255 186 0 0 8 36,815<br />
2000 34,491 58 890 258 746 186 0 0 9 36,638<br />
2001 33,679 58 1,446 0 508 186 0 0 10 35,887<br />
2002 34,488 54 1,380 0 458 218 0 0 11 36,609<br />
2003 35,979 33 1,383 0 421 198 0 0 9 38,023<br />
2004 36,618 33 910 0 450 195 0 0 7 38,213<br />
2005 35,970 41 1,178 0 784 185 0 0 7 38,165<br />
2006 36,856 62 3,389 0 747 191 0 9 11 41,265<br />
2007 37,172 39 7,424 0 539 164 0 25 11 45,374<br />
2008 38,020 44 7,366 36 668 254 24 25 142 46,579<br />
2009* 35,653 42 6,324 35 622 264 72 24 191 43,227<br />
2010** 36,156 45 6,059 35 508 285 415 25 152 43,680<br />
Source: EIA, 2008 Electric Power <strong>Annual</strong>, 2009 Electric Power Monthly<br />
Note: Includes electric utilities; independent power producers; <strong>and</strong> combined heat <strong>and</strong> power for commercial, industrial, <strong>and</strong> electric sectors.<br />
1<br />
Blast furnace gas, propane gas, <strong>and</strong> other manufactured <strong>and</strong> waste gases derived from fossil fuels<br />
2<br />
EIA only records data from the Blundell Geothermal Plant <strong>and</strong> not the Cove Fort Plant. Cove Fort’s generation data have been added to the overall geothermal<br />
total for 1992 to 2002 (data obtained from company interviews).<br />
3<br />
Municipal solid waste - includes biogenic <strong>and</strong> non-biogenic<br />
*Preliminary<br />
**Forecast<br />
MSW 3<br />
Total
<strong>Annual</strong> <strong>review</strong> <strong>and</strong> <strong>forecast</strong> <strong>of</strong> <strong>Utah</strong> <strong>coal</strong> production <strong>and</strong> distribution—2009 33<br />
Table A7. Average <strong>coal</strong> quality at <strong>Utah</strong> mines, 2009.<br />
Company Mine Coalfield Bed(s)<br />
Heat<br />
Content<br />
Btu/lb<br />
%<br />
Sulfur<br />
%<br />
Ash<br />
%<br />
Moisture<br />
Canyon Fuel, LLC Skyline #3 Wasatch Lower O’Connor ‘A’ 11,600 0.4% 9.6% 8.3%<br />
Canyon Fuel, LLC SUFCO Wasatch Upper Hiawatha 10,942 0.4% 11.2% 9.9%<br />
Canyon Fuel, LLC Dugout Canyon Book Cliffs Gilson 12,076 1.0% na na<br />
CONSOL Energy Emery Emery I 12,260 na na na<br />
C.W. Mining Bear Canyon #4 Wasatch Tank 10,737 0.7% 18.3% 7.7%<br />
Energy West<br />
Mining Co.<br />
Hidden Splendor<br />
Resources, Inc.<br />
WEST RIDGE<br />
Resources, Inc.<br />
Source: UGS <strong>coal</strong> company questionnaires<br />
Deer Creek Wasatch Hiawatha/Blind Canyon 12,062 0.5% 9.1% 9.0%<br />
Horizon Wasatch Hiawatha 11,700 0.5% 9.0% 5.0%<br />
West Ridge Book Cliffs Lower Sunnyside 11,994 1.2% 12.8% 6.3%
34<br />
<strong>Utah</strong> <strong>Geological</strong> <strong>Survey</strong><br />
Figure A1. Location <strong>and</strong> significance <strong>of</strong> <strong>Utah</strong> <strong>coal</strong>fields.
<strong>Annual</strong> <strong>review</strong> <strong>and</strong> <strong>forecast</strong> <strong>of</strong> <strong>Utah</strong> <strong>coal</strong> production <strong>and</strong> distribution—2009 35<br />
Figure A2. Location <strong>and</strong> status (at time <strong>of</strong> printing) <strong>of</strong> <strong>Utah</strong> <strong>coal</strong> mining operations.