Annual review and forecast of Utah coal - Utah Geological Survey ...
Annual review and forecast of Utah coal - Utah Geological Survey ...
Annual review and forecast of Utah coal - Utah Geological Survey ...

Create successful ePaper yourself
Turn your PDF publications into a flip-book with our unique Google optimized e-Paper software.
30<br />
<strong>Utah</strong> <strong>Geological</strong> <strong>Survey</strong><br />
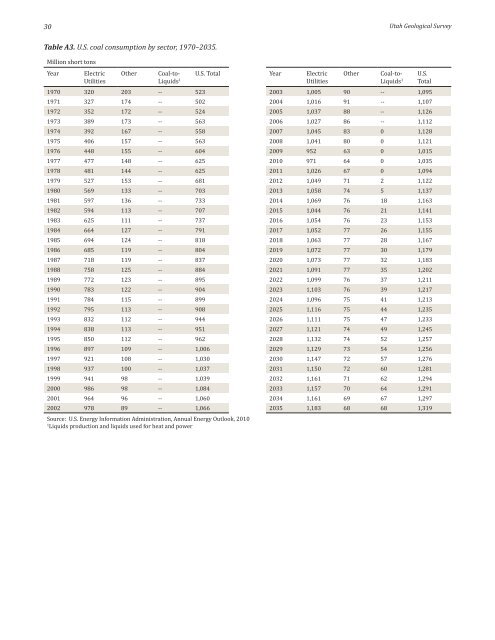
Table A3. U.S. <strong>coal</strong> consumption by sector, 1970–2035.<br />
Million short tons<br />
Year<br />
Electric<br />
Utilities<br />
Other<br />
Coal-to- U.S. Total Year Electric<br />
Liquids 1 Utilities<br />
Other<br />
Coal-to-<br />
Liquids 1<br />
1970 320 203 -- 523 2003 1,005 90 -- 1,095<br />
1971 327 174 -- 502 2004 1,016 91 -- 1,107<br />
1972 352 172 -- 524 2005 1,037 88 -- 1,126<br />
1973 389 173 -- 563 2006 1,027 86 -- 1,112<br />
1974 392 167 -- 558 2007 1,045 83 0 1,128<br />
1975 406 157 -- 563 2008 1,041 80 0 1,121<br />
1976 448 155 -- 604 2009 952 63 0 1,015<br />
1977 477 148 -- 625 2010 971 64 0 1,035<br />
1978 481 144 -- 625 2011 1,026 67 0 1,094<br />
1979 527 153 -- 681 2012 1,049 71 2 1,122<br />
1980 569 133 -- 703 2013 1,058 74 5 1,137<br />
1981 597 136 -- 733 2014 1,069 76 18 1,163<br />
1982 594 113 -- 707 2015 1,044 76 21 1,141<br />
1983 625 111 -- 737 2016 1,054 76 23 1,153<br />
1984 664 127 -- 791 2017 1,052 77 26 1,155<br />
1985 694 124 -- 818 2018 1,063 77 28 1,167<br />
1986 685 119 -- 804 2019 1,072 77 30 1,179<br />
1987 718 119 -- 837 2020 1,073 77 32 1,183<br />
1988 758 125 -- 884 2021 1,091 77 35 1,202<br />
1989 772 123 -- 895 2022 1,099 76 37 1,211<br />
1990 783 122 -- 904 2023 1,103 76 39 1,217<br />
1991 784 115 -- 899 2024 1,096 75 41 1,213<br />
1992 795 113 -- 908 2025 1,116 75 44 1,235<br />
1993 832 112 -- 944 2026 1,111 75 47 1,233<br />
1994 838 113 -- 951 2027 1,121 74 49 1,245<br />
1995 850 112 -- 962 2028 1,132 74 52 1,257<br />
1996 897 109 -- 1,006 2029 1,129 73 54 1,256<br />
1997 921 108 -- 1,030 2030 1,147 72 57 1,276<br />
1998 937 100 -- 1,037 2031 1,150 72 60 1,281<br />
1999 941 98 -- 1,039 2032 1,161 71 62 1,294<br />
2000 986 98 -- 1,084 2033 1,157 70 64 1,291<br />
2001 964 96 -- 1,060 2034 1,161 69 67 1,297<br />
2002 978 89 -- 1,066 2035 1,183 68 68 1,319<br />
Source: U.S. Energy Information Administration, <strong>Annual</strong> Energy Outlook, 2010<br />
1<br />
Liquids production <strong>and</strong> liquids used for heat <strong>and</strong> power<br />
U.S.<br />
Total