Annual review and forecast of Utah coal - Utah Geological Survey ...
Annual review and forecast of Utah coal - Utah Geological Survey ...
Annual review and forecast of Utah coal - Utah Geological Survey ...

You also want an ePaper? Increase the reach of your titles
YUMPU automatically turns print PDFs into web optimized ePapers that Google loves.
<strong>Annual</strong> <strong>review</strong> <strong>and</strong> <strong>forecast</strong> <strong>of</strong> <strong>Utah</strong> <strong>coal</strong> production <strong>and</strong> distribution—2009 23<br />
quality specifications. Coal washing in <strong>Utah</strong> is already underway<br />
at the Castle Valley Preparation Plant <strong>and</strong> at the<br />
Wellington Cleaning Facility. Washing <strong>coal</strong> adds roughly $2<br />
to $4 per ton to its delivered price. Nevertheless, <strong>Utah</strong> <strong>coal</strong><br />
will always have to compete with lower-cost Powder River<br />
Basin <strong>coal</strong> for market share.<br />
Distribution <strong>and</strong> Consumption<br />
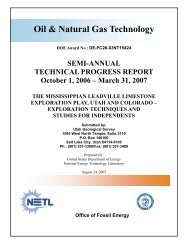
EIA projects that domestic consumption <strong>of</strong> <strong>coal</strong> will drop<br />
to 1015 million tons in 2009, <strong>of</strong> which 952 million tons,<br />
or 93.8%, will be consumed by electric power plants. This<br />
represents a 9.4% drop from 2008 consumption numbers<br />
due to lower dem<strong>and</strong> during the recession. However,<br />
consumption is expected to rebound <strong>and</strong> is projected to<br />
increase by 0.6% per year <strong>and</strong> reach 1319 million tons<br />
by 2035, with 1183 million tons <strong>of</strong> <strong>coal</strong> going to electric<br />
utilities (figure 5). Similar to production estimates, these<br />
<strong>forecast</strong>ed numbers are less than in previous years as<br />
modelers predict a slowdown in the building <strong>of</strong> <strong>coal</strong>-fired<br />
electric plants. EIA also predicts that U.S. consumption at<br />
<strong>coal</strong>-to-liquids plants will begin in 2011 <strong>and</strong> total 68 million<br />
tons by 2035—an optimistic <strong>forecast</strong>.<br />
For 2009 <strong>and</strong> beyond, distribution <strong>of</strong> <strong>Utah</strong> <strong>coal</strong> is expected<br />
to parallel predicted rates <strong>of</strong> production. For example,<br />
with production expected to decrease 12.9% in 2010, distribution<br />
<strong>of</strong> <strong>Utah</strong> <strong>coal</strong> should decrease commensurately by<br />
13.2% to 17.9 million tons (table 8).<br />
Coal consumption in <strong>Utah</strong> remained fairly steady from<br />
2004 to 2008, averaging 17.5 million tons each year, with<br />
most <strong>of</strong> this <strong>coal</strong> (16.6 million tons) burned at electric<br />
power plants (table 12, figure 6). However, due to the slow<br />
economy in 2009, <strong>coal</strong> consumption dropped 6.7% to 16.6<br />
million tons, <strong>of</strong> which 15.9 million tons went to electric<br />
utilities, down from the record-high <strong>of</strong> 16.9 million tons in<br />
2008. Coal consumption is expected to rebound in 2010 to<br />
17.1 million tons as dem<strong>and</strong> for electricity slowly returns.<br />
In the past few years, <strong>Utah</strong> has added over 1300 megawatts<br />
<strong>of</strong> electric capacity from new natural gas-fired power<br />
plants. This new gas-fired capacity has reduced <strong>coal</strong>’s contribution<br />
to <strong>Utah</strong>’s electric generation from 94.2% in 2005<br />
to 82.5% in 2009, while natural gas’ share increased from<br />
3.1% in 2005 to 14.6% in 2009 (see appendix table A6).<br />
Plans for proposed <strong>coal</strong> plants in <strong>Utah</strong> have been delayed<br />
due to lawsuits <strong>and</strong> permit problems stemming from uncertainties<br />
surrounding regulation <strong>of</strong> greenhouse gases,<br />
as well as other air quality issues. In fact, Rocky Mountain<br />
Power has announced that they will not build a new <strong>coal</strong>fired<br />
power plant until carbon mitigation rules are developed<br />
<strong>and</strong> effective strategies identified. Until then, their<br />
<strong>Utah</strong> <strong>coal</strong> consumption will likely remain near current<br />
levels.<br />
One possible exception to steady future dem<strong>and</strong> will be if<br />
a foreign export market develops again. Because <strong>Utah</strong> is a<br />
long distance from <strong>coal</strong> export terminals, this possibility<br />
requires favorable exchange rates or higher <strong>coal</strong> commodity<br />
prices to <strong>of</strong>fset transportation cost.<br />
1500<br />
Electric Utilities<br />
Other<br />
1200<br />
Coal-to-Liquids<br />
U.S. Total<br />
Million short tons<br />
900<br />
600<br />
300<br />
0<br />
1970 1980 1990 2000 2010 2020 2030<br />
Source: U.S. Energy Information Administration, <strong>Annual</strong> Energy Outlook 2010<br />
Note: Data available in appendix table A3<br />
Figure 5. U.S. <strong>coal</strong> consumption by sector, 1970–2035.