Annual review and forecast of Utah coal - Utah Geological Survey ...
Annual review and forecast of Utah coal - Utah Geological Survey ...
Annual review and forecast of Utah coal - Utah Geological Survey ...

Create successful ePaper yourself
Turn your PDF publications into a flip-book with our unique Google optimized e-Paper software.
14<br />
<strong>Utah</strong> <strong>Geological</strong> <strong>Survey</strong><br />
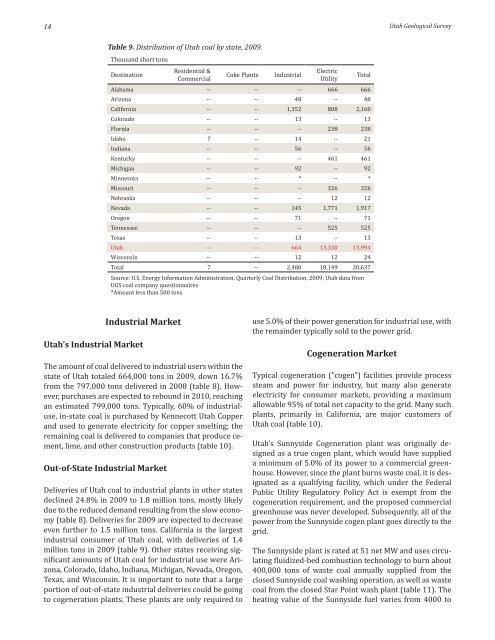
Table 9. Distribution <strong>of</strong> <strong>Utah</strong> <strong>coal</strong> by state, 2009.<br />
Thous<strong>and</strong> short tons<br />
Destination<br />
Residential &<br />
Commercial<br />
Coke Plants<br />
Industrial<br />
Electric<br />
Utility<br />
Total<br />
Alabama -- -- -- 666 666<br />
Arizona -- -- 48 -- 48<br />
California -- -- 1,352 808 2,160<br />
Colorado -- -- 13 -- 13<br />
Florida -- -- -- 238 238<br />
Idaho 7 -- 14 -- 21<br />
Indiana -- -- 56 -- 56<br />
Kentucky -- -- -- 461 461<br />
Michigan -- -- 92 -- 92<br />
Minnesota -- -- * -- *<br />
Missouri -- -- -- 326 326<br />
Nebraska -- -- -- 12 12<br />
Nevada -- -- 145 1,771 1,917<br />
Oregon -- -- 71 -- 71<br />
Tennessee -- -- -- 525 525<br />
Texas -- -- 13 -- 13<br />
<strong>Utah</strong> -- -- 664 13,330 13,994<br />
Wisconsin -- -- 12 12 24<br />
Total 7 -- 2,480 18,149 20,637<br />
Source: U.S. Energy Information Administration, Quarterly Coal Distribution, 2009; <strong>Utah</strong> data from<br />
UGS <strong>coal</strong> company questionnaires<br />
*Amount less than 500 tons<br />
Industrial Market<br />
<strong>Utah</strong>’s Industrial Market<br />
The amount <strong>of</strong> <strong>coal</strong> delivered to industrial users within the<br />
state <strong>of</strong> <strong>Utah</strong> totaled 664,000 tons in 2009, down 16.7%<br />
from the 797,000 tons delivered in 2008 (table 8). However,<br />
purchases are expected to rebound in 2010, reaching<br />
an estimated 799,000 tons. Typically, 60% <strong>of</strong> industrialuse,<br />
in-state <strong>coal</strong> is purchased by Kennecott <strong>Utah</strong> Copper<br />
<strong>and</strong> used to generate electricity for copper smelting; the<br />
remaining <strong>coal</strong> is delivered to companies that produce cement,<br />
lime, <strong>and</strong> other construction products (table 10).<br />
Out-<strong>of</strong>-State Industrial Market<br />
Deliveries <strong>of</strong> <strong>Utah</strong> <strong>coal</strong> to industrial plants in other states<br />
declined 24.8% in 2009 to 1.8 million tons, mostly likely<br />
due to the reduced dem<strong>and</strong> resulting from the slow economy<br />
(table 8). Deliveries for 2009 are expected to decrease<br />
even further to 1.5 million tons. California is the largest<br />
industrial consumer <strong>of</strong> <strong>Utah</strong> <strong>coal</strong>, with deliveries <strong>of</strong> 1.4<br />
million tons in 2009 (table 9). Other states receiving significant<br />
amounts <strong>of</strong> <strong>Utah</strong> <strong>coal</strong> for industrial use were Arizona,<br />
Colorado, Idaho, Indiana, Michigan, Nevada, Oregon,<br />
Texas, <strong>and</strong> Wisconsin. It is important to note that a large<br />
portion <strong>of</strong> out-<strong>of</strong>-state industrial deliveries could be going<br />
to cogeneration plants. These plants are only required to<br />
use 5.0% <strong>of</strong> their power generation for industrial use, with<br />
the remainder typically sold to the power grid.<br />
Cogeneration Market<br />
Typical cogeneration (“cogen”) facilities provide process<br />
steam <strong>and</strong> power for industry, but many also generate<br />
electricity for consumer markets, providing a maximum<br />
allowable 95% <strong>of</strong> total net capacity to the grid. Many such<br />
plants, primarily in California, are major customers <strong>of</strong><br />
<strong>Utah</strong> <strong>coal</strong> (table 10).<br />
<strong>Utah</strong>’s Sunnyside Cogeneration plant was originally designed<br />
as a true cogen plant, which would have supplied<br />
a minimum <strong>of</strong> 5.0% <strong>of</strong> its power to a commercial greenhouse.<br />
However, since the plant burns waste <strong>coal</strong>, it is designated<br />
as a qualifying facility, which under the Federal<br />
Public Utility Regulatory Policy Act is exempt from the<br />
cogeneration requirement, <strong>and</strong> the proposed commercial<br />
greenhouse was never developed. Subsequently, all <strong>of</strong> the<br />
power from the Sunnyside cogen plant goes directly to the<br />
grid.<br />
The Sunnyside plant is rated at 51 net MW <strong>and</strong> uses circulating<br />
fluidized-bed combustion technology to burn about<br />
400,000 tons <strong>of</strong> waste <strong>coal</strong> annually supplied from the<br />
closed Sunnyside <strong>coal</strong> washing operation, as well as waste<br />
<strong>coal</strong> from the closed Star Point wash plant (table 11). The<br />
heating value <strong>of</strong> the Sunnyside fuel varies from 4000 to