Annual review and forecast of Utah coal - Utah Geological Survey ...
Annual review and forecast of Utah coal - Utah Geological Survey ...
Annual review and forecast of Utah coal - Utah Geological Survey ...

You also want an ePaper? Increase the reach of your titles
YUMPU automatically turns print PDFs into web optimized ePapers that Google loves.
16<br />
<strong>Utah</strong> <strong>Geological</strong> <strong>Survey</strong><br />
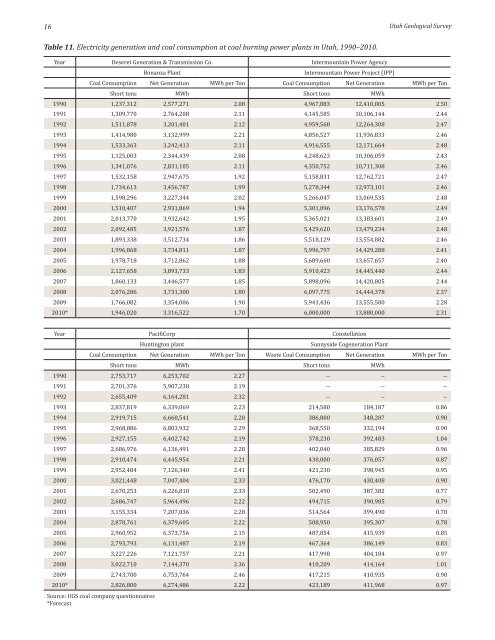
Table 11. Electricity generation <strong>and</strong> <strong>coal</strong> consumption at <strong>coal</strong> burning power plants in <strong>Utah</strong>, 1990–2010.<br />
Year Deseret Generation & Transmission Co. Intermountain Power Agency<br />
Bonanza Plant<br />
Intermountain Power Project (IPP)<br />
Coal Consumption Net Generation MWh per Ton Coal Consumption Net Generation MWh per Ton<br />
Short tons MWh Short tons MWh<br />
1990 1,237,312 2,577,271 2.08 4,967,883 12,410,005 2.50<br />
1991 1,309,770 2,764,208 2.11 4,145,585 10,106,144 2.44<br />
1992 1,511,878 3,201,401 2.12 4,959,568 12,264,308 2.47<br />
1993 1,414,980 3,132,999 2.21 4,856,527 11,936,833 2.46<br />
1994 1,533,363 3,242,413 2.11 4,916,555 12,171,664 2.48<br />
1995 1,125,003 2,344,439 2.08 4,248,623 10,306,059 2.43<br />
1996 1,341,076 2,831,105 2.11 4,350,752 10,711,308 2.46<br />
1997 1,532,158 2,947,675 1.92 5,158,831 12,762,721 2.47<br />
1998 1,734,613 3,456,787 1.99 5,278,344 12,973,101 2.46<br />
1999 1,598,296 3,227,344 2.02 5,266,047 13,069,535 2.48<br />
2000 1,510,407 2,931,869 1.94 5,301,096 13,176,578 2.49<br />
2001 2,013,770 3,932,642 1.95 5,365,021 13,383,601 2.49<br />
2002 2,092,485 3,921,576 1.87 5,429,620 13,479,234 2.48<br />
2003 1,893,338 3,512,734 1.86 5,518,129 13,554,882 2.46<br />
2004 1,996,868 3,734,811 1.87 5,996,797 14,429,288 2.41<br />
2005 1,978,718 3,712,862 1.88 5,689,660 13,657,657 2.40<br />
2006 2,127,658 3,893,733 1.83 5,910,423 14,445,440 2.44<br />
2007 1,860,133 3,446,577 1.85 5,898,096 14,420,805 2.44<br />
2008 2,076,286 3,731,300 1.80 6,097,775 14,444,378 2.37<br />
2009 1,766,082 3,354,006 1.90 5,943,436 13,555,580 2.28<br />
2010* 1,946,020 3,316,522 1.70 6,000,000 13,880,000 2.31<br />
Year PacifiCorp Constellation<br />
Huntington plant<br />
Sunnyside Cogeneration Plant<br />
Coal Consumption Net Generation MWh per Ton Waste Coal Consumption Net Generation MWh per Ton<br />
Short tons MWh Short tons MWh<br />
1990 2,753,717 6,253,702 2.27 -- -- --<br />
1991 2,701,376 5,907,238 2.19 -- -- --<br />
1992 2,655,409 6,164,281 2.32 -- -- --<br />
1993 2,837,819 6,339,069 2.23 214,580 184,187 0.86<br />
1994 2,919,715 6,660,541 2.28 386,800 348,287 0.90<br />
1995 2,968,886 6,803,932 2.29 368,550 332,194 0.90<br />
1996 2,927,155 6,402,742 2.19 378,230 392,483 1.04<br />
1997 2,686,976 6,136,491 2.28 402,040 385,829 0.96<br />
1998 2,910,474 6,445,954 2.21 430,000 376,057 0.87<br />
1999 2,952,484 7,126,340 2.41 421,230 398,945 0.95<br />
2000 3,021,448 7,047,404 2.33 476,170 430,408 0.90<br />
2001 2,670,253 6,226,810 2.33 502,490 387,382 0.77<br />
2002 2,686,747 5,964,496 2.22 494,715 390,985 0.79<br />
2003 3,155,334 7,207,036 2.28 514,564 399,490 0.78<br />
2004 2,878,761 6,379,605 2.22 508,950 395,307 0.78<br />
2005 2,960,952 6,373,756 2.15 487,854 415,939 0.85<br />
2006 2,793,793 6,131,487 2.19 467,364 386,149 0.83<br />
2007 3,227,226 7,121,757 2.21 417,998 404,184 0.97<br />
2008 3,022,710 7,144,370 2.36 410,209 414,164 1.01<br />
2009 2,743,700 6,753,764 2.46 417,215 410,935 0.98<br />
2010* 2,826,800 6,274,486 2.22 423,189 411,968 0.97<br />
Source: UGS <strong>coal</strong> company questionnaires<br />
*Forecast