International Construction Cost Commentary - Rider Levett Bucknall
International Construction Cost Commentary - Rider Levett Bucknall
International Construction Cost Commentary - Rider Levett Bucknall

You also want an ePaper? Increase the reach of your titles
YUMPU automatically turns print PDFs into web optimized ePapers that Google loves.
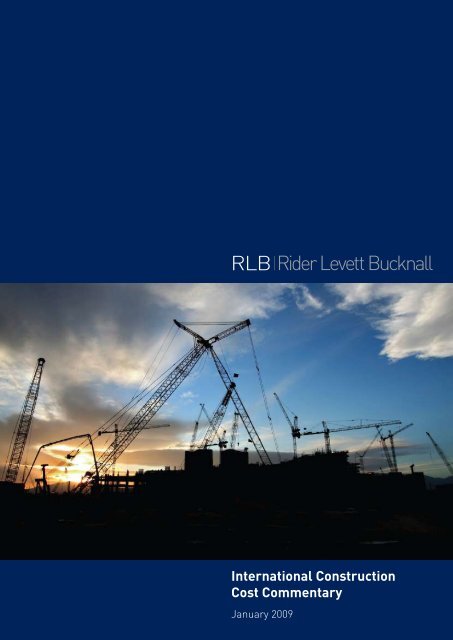
<strong>International</strong> <strong>Construction</strong><br />
<strong>Cost</strong> <strong>Commentary</strong><br />
January 2009
Offices around the world<br />
AMERICAS<br />
CANADA<br />
Calgary<br />
Toronto<br />
CARIBBEAN<br />
Grand Cayman<br />
USA<br />
Boston<br />
Chicago<br />
Denver<br />
Honolulu<br />
Kona<br />
Las Vegas<br />
Los Angeles<br />
New York<br />
Orlando<br />
Phoenix<br />
Portland<br />
San Francisco<br />
Seattle<br />
Washington DC<br />
ASIA<br />
CHINA<br />
Beijing<br />
Chengdu<br />
Dalian<br />
Guangzhou<br />
Guiyang<br />
Hong Kong<br />
Macau<br />
Sanya<br />
Shanghai<br />
Shenyang<br />
Shenzhen<br />
Tianjin<br />
Wuhan<br />
Wuxi<br />
Xian<br />
Zhuhai<br />
INDONESIA<br />
Jakarta<br />
MALAYSIA<br />
Kota Kinabalu<br />
Kuala Lumpur<br />
PHILIPPINES<br />
Manila<br />
SINGAPORE<br />
Singapore<br />
SOUTH KOREA<br />
Seoul<br />
THAILAND<br />
Bangkok<br />
VIETNAM<br />
Ho Chi Minh City<br />
EMEA<br />
MIDDLE EAST<br />
Abu Dhabi<br />
Dubai<br />
Muscat<br />
United Kingdom<br />
Birchwood, Warrington<br />
Birmingham<br />
Bristol<br />
Edinburgh<br />
Liverpool<br />
London<br />
Manchester<br />
Newcastle Upon Tyne<br />
Sheffield<br />
Warton<br />
Welwyn Garden City<br />
Wokingham<br />
EUROPE<br />
RLB EuroAlliance<br />
Austria<br />
Belgium<br />
Bulgaria<br />
Czech Republic<br />
Estonia<br />
France<br />
Germany<br />
Greece<br />
Hungary<br />
Ireland<br />
Italy<br />
Kazakhstan<br />
Latvia<br />
Luxembourg<br />
Malta<br />
Netherlands<br />
Norway<br />
Poland<br />
Portugal<br />
Romania<br />
Russia<br />
Spain<br />
Sweden<br />
Slovakia<br />
Slovenia<br />
Switzerland<br />
Turkey<br />
Ukraine<br />
OCEANIA<br />
AUSTRALIA<br />
Adelaide<br />
Brisbane<br />
Cairns<br />
Canberra<br />
Darwin<br />
Gold Coast<br />
Melbourne<br />
Newcastle<br />
Northern NSW<br />
Perth<br />
Sunshine Coast<br />
Sydney<br />
Townsville<br />
Western Sydney<br />
NEW ZEALAND<br />
Auckland<br />
Christchurch<br />
Otago<br />
Palmerston North<br />
Tauranga<br />
Wellington<br />
Disclaimer: The <strong>International</strong> <strong>Construction</strong> <strong>Cost</strong> <strong>Commentary</strong> is a twice yearly publication by <strong>Rider</strong> <strong>Levett</strong> <strong>Bucknall</strong>, designed to highlight key factors affecting the global cost of<br />
construction. While the information in this publication is believed to be correct at the time of publishing, no responsibility is accepted for its accuracy. Persons desiring to utilise any<br />
information appearing in the publication should verify its applicability to their specific circumstances. <strong>Cost</strong> information in this publication is indicative and for general guidance only and is<br />
based on rates at January 2009.<br />
Sources: <strong>Rider</strong> <strong>Levett</strong> <strong>Bucknall</strong> Research and Development, Australian Bureau of Statistics (ABS), Department of Foreign Affairs and Trade (DFAT), <strong>International</strong> Monetary Fund (IMF),<br />
Statistics New Zealand.<br />
2<br />
INTERNATIONAL CONSTRUCTION COST COMMENTARY: January 2009
Welcome<br />
Welcome to the January 2009 edition of <strong>Rider</strong> <strong>Levett</strong><br />
<strong>Bucknall</strong>’s <strong>International</strong> <strong>Construction</strong> <strong>Cost</strong> <strong>Commentary</strong><br />
(ICCC). From all of us at <strong>Rider</strong> <strong>Levett</strong> <strong>Bucknall</strong> we hope<br />
you and your family had a safe and enjoyable holiday season.<br />
With the global impacts of the credit squeeze still settling all<br />
around us, this commentary reviewing the global and local<br />
costs of construction is a very apt way for all professionals<br />
to start the new year with a clear understanding of the state<br />
of the various property markets across the globe.<br />
The ICCC uses global cost data to derive indexed measures<br />
of relative costs of construction within and between<br />
markets. In order to set this in the context of the wider<br />
economic environment, analysis is also provided on global,<br />
regional and local issues affecting your markets.<br />
If there’s one thing that we can be certain about in these<br />
uncertain times, it’s that the need for reliable expert advice<br />
and cost management is as essential as ever to assuring<br />
your successes.<br />
To ensure that we are continuously offering you the latest<br />
information on global and local construction costs, we are<br />
now producing electronic updates in between editions of<br />
the ICCC. To ensure you always have the most up-to-date<br />
information on costs in this fast paced industry, please refer<br />
to www.rlb.com for our essential updates.<br />
With our continued expansion across the globe, coupled<br />
with cross-regional collaboration between more than 80<br />
offices, <strong>Rider</strong> <strong>Levett</strong> <strong>Bucknall</strong> is pleased to be in a position<br />
to offer clients a sense of comfort that they are making<br />
sound decisions based on a foundation of reliable data. In<br />
uncertain times, reliable advice can bring you the certainty<br />
that makes all the difference.<br />
At <strong>Rider</strong> <strong>Levett</strong> <strong>Bucknall</strong> we are proud to continue<br />
providing you with a comprehensive suite of both<br />
international and local cost information documents to allow<br />
you to make successful decisions.<br />
If you would like further information on the content of this<br />
publication, or to register to regularly receive your copy,<br />
please visit our website www.rlb.com.<br />
Feedback is important to us. If you have a question, or<br />
would like to make a comment, please feel free to contact<br />
me via brian.dackers@nz.rlb.com or +64 9 309 1074.<br />
I extend my best wishes to you for a productive and<br />
successful start to the new year.<br />
Brian Dackers<br />
Chairman<br />
<strong>Rider</strong> <strong>Levett</strong> <strong>Bucknall</strong><br />
3<br />
INTERNATIONAL CONSTRUCTION COST COMMENTARY: January 2009
World at a Glance<br />
Over the latter half of 2008 the impact of the global credit crunch widened to affect not only the advanced<br />
economies but also the emerging economies. OECD forecasts for 2009 and 2010 suggest extremely subdued<br />
levels of growth and the need for sustained central government inputs across all major economies. The recent<br />
G20 meeting condensed the principles of this intervention, in terms of stimulating liquidity, strengthening capital<br />
and financial institutions, addressing regulatory deficiencies, unfreezing credit markets and protecting savings<br />
and deposits, as well as the implementation of fiscal measures to stimulate domestic demand and assistance to<br />
emerging economies to gain access to finance markets.<br />
For construction, this process will be somewhat time-consuming as the freeing-up of financial markets and<br />
credit availability will run before the re-establishment of confidence in residential, commercial and retail sectors,<br />
which may only then be reflected in more projects coming to market. Conversely though, the very fact of difficult<br />
market conditions is providing an excellent tendering environment for clients of the industry who do have<br />
liquidity of funding.<br />
Streamline Tower, Las Vegas.<br />
Photographer: Tom Craig, Opulence Studios.<br />
Project Management by <strong>Rider</strong> <strong>Levett</strong> <strong>Bucknall</strong>.<br />
Oriental Plaza, Beijing.<br />
Quantity Surveying by <strong>Rider</strong> <strong>Levett</strong> <strong>Bucknall</strong>.<br />
Americas<br />
The US residential construction market<br />
continues its decline and has now been<br />
joined, in many States, by the commercial<br />
market, which has been very adversely<br />
affected by the credit crunch, liquidity<br />
problems and the general retreat of<br />
confidence in markets. Continued stock<br />
market volatility has so far provided several<br />
false dawns as investors struggle to identify<br />
the bottom of this particular downturn.<br />
The end of the bear market should coincide<br />
with the resurrection of confidence across<br />
the economy generally, but its timing is as<br />
yet open to debate.<br />
As a subset of the wider economy, the<br />
construction market is currently reflective<br />
of general market conditions, in which<br />
confidence has dissipated and awaits the<br />
return of consumer activity. This has<br />
had, and is having, considerable effects<br />
on large speculative projects as they face<br />
credit availability problems, with lenders<br />
backing away from lower levels of risk than<br />
they would have coped with hitherto, or<br />
alternatively imposing a cost burden of<br />
higher interest rates. The knock-on effect<br />
for contractors and subcontractors is that<br />
they are now exposed to trawling for work<br />
in a much smaller pool of possible projects,<br />
with consequent effects on margins and<br />
profitability.<br />
Asia<br />
The rapid expansion which characterised<br />
performance in Asian markets until the<br />
middle of 2008, has been supplanted by<br />
the impact of global economic downturn,<br />
as market-overlap has impacted upon<br />
overseas demand for products and the<br />
financial ills of the developed economies<br />
have been visited upon emerging markets.<br />
Overall, according to the IMF’s Regional<br />
Economic Outlook released in November<br />
2008, Asian growth is projected to have<br />
slowed from 7.6% in 2007, to 6.0% in 2008<br />
and then to 4.9% in 2009. Although the<br />
softening of international and domestic<br />
demand is evident, as noted by the IMF,<br />
most Asian countries are emerging from<br />
a period of relatively high inflation, so any<br />
monetary easing to stimulate markets will<br />
have to be closely monitored to avoid the<br />
initiation of a new inflation cycle. However,<br />
rapid responses have been made in, for<br />
example, China, where interest rates have<br />
been slashed in response to falling domestic<br />
and external demand, which have in their<br />
turn driven down GDP growth projections.<br />
The formerly rapidly inflating growth of<br />
the mainland Chinese construction market<br />
has been significantly curtailed by falling<br />
demand and also by falling values in the<br />
property market. Similarly, in Hong Kong,<br />
price inflation in the construction market<br />
has been damped by the reduction in<br />
workload in Macau, where several major<br />
projects have been shelved, the result<br />
being that contractor and subcontractor<br />
markets have become more competitive<br />
in a market which is shrinking not only in<br />
its own terms, but relative to an increasing<br />
productive capacity to build.<br />
4<br />
INTERNATIONAL CONSTRUCTION COST COMMENTARY: January 2009
EMEA<br />
Economies throughout the EMEA region<br />
have been seriously affected by the<br />
economic situation foreseen in the first<br />
half of the year. Although the downturn<br />
was expected to take effect in the later<br />
part of the year, the potential depth and<br />
severity are now becoming clearer. The<br />
effects have now percolated through to the<br />
Middle East, although it was the developed<br />
economies in northern Europe which first<br />
experienced the impacts. These effects<br />
were due to global financial and economic<br />
linkages which saw banking and financial<br />
systems exposed to sub-prime problems<br />
and then the downstream consequences<br />
of credit difficulties and waning confidence<br />
across all sectors. Share markets across all<br />
of Europe have been taken back by sudden<br />
and dramatic falls, while retailers are having<br />
to cope with falling sales and absence<br />
of consumer demand. Add to this the<br />
looming spectre of rising unemployment<br />
and the picture looks decidedly gloomy.<br />
Governments have reacted by attempting<br />
to stimulate market demand, with deep<br />
cuts in interest rates and promises to invest<br />
in public sector construction projects.<br />
However, in the UK housing market, home<br />
buyers are either unable or unwilling to<br />
return to the market while doubts remain<br />
on the jobs front. In construction, major<br />
projects have, in many cases, been shelved<br />
to await better times, with the result that<br />
construction prices are now falling back.<br />
Though materials costs are falling, this is<br />
partially offset by a fall in the relative value<br />
of sterling to other currencies. Clearly this<br />
margin-compression cannot last indefinitely,<br />
but whilst it does, there are opportunities<br />
for clients with funds to invest in<br />
construction for the long haul - if they<br />
have the confidence to do so. Although<br />
new build projects have been severely hit,<br />
many clients continue to invest in their<br />
existing assets, with specialist services such<br />
as whole life costs, RElifing, risk and value<br />
management become increasingly important<br />
in this market. Even the Middle East is not<br />
immune from the now global turmoil, as<br />
recent events of projects’ deferrals and<br />
suspensions clearly demonstrate.<br />
Oceania<br />
The Australian economy has lurched from<br />
a seeming inflationary spiral, towards a<br />
steep downswing, all in the space of just a<br />
few months. Although the shadow of this<br />
impact existed in the second quarter of<br />
the year, it was only in the third quarter<br />
that the turnaround began to gather pace.<br />
Australian GDP growth for 2009 is now<br />
expected to further weaken from a revised<br />
forecast of only 2.5% in 2008, before<br />
reviving in 2010. Unemployment is also<br />
forecast to rise, though throughout 2008 it<br />
stood at extremely low levels. Successive<br />
reductions of the interest rate by the<br />
Reserve Bank of Australia are running in<br />
parallel with the Federal Government’s<br />
commitment to stimulating the domestic<br />
economy, as the former fight to control<br />
inflation has been abruptly set aside.<br />
Additional federal commitment to spending<br />
on large infrastructure works will help<br />
to stimulate domestic economic activity,<br />
as money feeds through the layers of the<br />
economy, but will take time to build up a<br />
head of steam. In private sector building,<br />
much depends on a return of consumer<br />
and developer confidence, which has taken<br />
a battering recently with the combined<br />
impacts of the falling exchange rate, share<br />
market reverses and talk of a recession for<br />
the first time in almost twenty years.<br />
In New Zealand, the credit squeeze<br />
continues to stifle the general economy,<br />
presenting challenging times for the<br />
construction industry. Despite continued<br />
lowering of interest rates, the economy<br />
remains in recession, with consumer and<br />
business confidence extremely low and<br />
the trough not expected to be reached<br />
until sometime in 2009. Although there<br />
have been significant falls in international<br />
commodity prices, the falling NZ$ is<br />
outweighing any cost benefits on imported<br />
materials and this may be the biggest risk<br />
to building cost inflation in the short term.<br />
<strong>Construction</strong> markets are forecast to<br />
be weak through the next period, other<br />
than in infrastructure and other central<br />
government backed projects, which will<br />
provide some consistent work.<br />
Egg data centre, United Kingdom.<br />
<strong>Cost</strong> Management by <strong>Rider</strong> <strong>Levett</strong> <strong>Bucknall</strong>.<br />
The Queensland Gallery of Modern Art, Australia.<br />
Quantity Surveying by <strong>Rider</strong> <strong>Levett</strong> <strong>Bucknall</strong>.<br />
5<br />
INTERNATIONAL CONSTRUCTION COST COMMENTARY: January 2009
<strong>Construction</strong> Activity Cycle<br />
Kuala Lumpur<br />
Dubai<br />
Washington DC<br />
Manila<br />
San Francisco<br />
Canberra<br />
Perth<br />
Brisbane<br />
Adelaide<br />
New York<br />
Phoenix<br />
Portland<br />
Melbourne<br />
Denver<br />
Los Angeles<br />
Bangkok<br />
Honolulu<br />
Hong Kong<br />
Singapore<br />
VALUE<br />
UPTURN<br />
Darwin<br />
Tokyo<br />
Ho Chi Minh City<br />
Beijing<br />
Guangzhou<br />
Shanghai<br />
Shenzhen<br />
Seoul<br />
Seattle<br />
Wellington<br />
Christchurch<br />
London<br />
Birmingham<br />
Boston<br />
Las Vegas<br />
DOWNTURN<br />
Bristol<br />
Manchester<br />
Sheffield<br />
TROUGH<br />
Jakarta<br />
Macau<br />
Sydney<br />
Auckland<br />
TROUGH<br />
TIME<br />
<strong>Construction</strong> Activity Cycle Chart<br />
The <strong>Construction</strong> Activity Cycle chart<br />
depicts the position of each city in a<br />
theoretical construction industry business<br />
cycle. The aim of the chart is to provide<br />
an overview of the relative performance of<br />
each city in the context of its own economy.<br />
Each city has its own industry business<br />
cycle and as such cities’ cycles are not<br />
strictly directly comparable with each<br />
other. As the amplitude and frequency of<br />
the cycle(s) are not expressed in this chart,<br />
there is no direct parameter of extent of<br />
the cycle or of its time period.<br />
7<br />
INTERNATIONAL CONSTRUCTION COST COMMENTARY: January 2009
<strong>International</strong> Tender Price<br />
Relativity Matrix<br />
The ‘<strong>International</strong> Tender Price Relativity Matrix’<br />
shows the changing costs of works between<br />
July 2008 and January 2009.<br />
City Jul-08 Jan-09 % Change<br />
New York 154 154 0.0%<br />
London 151 151 0.0%<br />
Honolulu 141 143 + 1.4%<br />
San Francisco 140 140 0.0%<br />
Boston 135 136 + 0.7%<br />
Perth 129 132 + 2.3%<br />
Bristol 131 128 - 2.3%<br />
Washington D.C. 131 128 - 2.3%<br />
Darwin 123 128 + 4.1%<br />
Manchester 127 124 - 2.4%<br />
Los Angeles 123 124 + 0.8%<br />
Birmingham 125 120 - 4.0%<br />
Sheffield 124 119 - 4.0%<br />
Seattle 121 116 - 4.1%<br />
Singapore 122 112 - 8.2%<br />
Adelaide 109 112 + 2.8%<br />
Dubai 108 110 + 1.9%<br />
Sydney 110 109 - 0.9%<br />
Brisbane 109 109 0.0%<br />
Hong Kong 115 107 - 7.0%<br />
Melbourne 105 106 + 1.0%<br />
Canberra 104 106 + 1.9%<br />
Macau 110 104 - 5.5%<br />
Wellington 102 102 0.0%<br />
Phoenix 101 101 0.0%<br />
Portland 100 100 0.0%<br />
Denver 98 99 + 1.0%<br />
Auckland 99 98 - 1.0%<br />
Orlando 99 98 - 1.0%<br />
Las Vegas 97 98 + 1.0%<br />
Christchurch 92 92 0.0%<br />
Beijing 80 78 - 2.5%<br />
Shanghai 74 73 - 1.4%<br />
Guangzhou 69 67 - 2.9%<br />
Shenzhen 69 67 - 2.9%<br />
Please note: Figures for the above Percentage Change column are for the 6 month period<br />
between the July 2008 ICCC and the January 2009 ICCC.<br />
8<br />
INTERNATIONAL CONSTRUCTION COST COMMENTARY: January 2009
<strong>International</strong> Tender Price Index<br />
The Tender Price Index graph shows the<br />
changing costs of works relative to Hong<br />
Kong’s base of 100 at October 2007<br />
200<br />
180<br />
160<br />
140<br />
120<br />
Index<br />
100<br />
80<br />
60<br />
40<br />
20<br />
January 2009<br />
2005<br />
2006<br />
2007<br />
2008<br />
2009<br />
2010<br />
Year<br />
•Hong Kong •Auckland •Beijing •Dubai •London<br />
•New York •Singapore •Sydney<br />
The <strong>International</strong> Tender Price Index chart<br />
demonstrates clearly the seismic nature of the<br />
impact on the construction industry of global<br />
economic woes.<br />
The longer term effects however are ongoing, as<br />
the shock waves ripple around the world.<br />
9<br />
INTERNATIONAL CONSTRUCTION COST COMMENTARY: January 2009
<strong>Commentary</strong> by region:<br />
Americas<br />
200<br />
180<br />
160<br />
140<br />
120<br />
Index<br />
100<br />
80<br />
60<br />
40<br />
20<br />
January 2009<br />
2005<br />
2006<br />
2007<br />
2008<br />
2009<br />
2010<br />
Year<br />
•New York •Boston •Denver •Honolulu •Las Vegas •Los Angeles<br />
•Orlando •Phoenix •Portland •San Francisco •Seattle •Washington DC<br />
Tender Price Relativity Matrix -<br />
comparative costs of construction<br />
New York 154<br />
Honolulu 143<br />
San Francisco 140<br />
Boston 136<br />
Washington D.C. 128<br />
Los Angeles 124<br />
Seattle 116<br />
Phoenix 101<br />
Portland 100<br />
Denver 99<br />
Orlando 98<br />
Las Vegas 98<br />
The protracted housing downturn and weak domestic growth, combined<br />
with the ongoing credit availability problems, will together ensure that<br />
difficult economic conditions will continue well into 2009. The Federal<br />
Reserve’s December reduction of the US federal funds rate to a range<br />
from zero to 0.25% was unprecedented and further underscored the<br />
existence of a severe financial crisis in the USA. Fiscal stimulus has already<br />
been added to the system, but more may well be required<br />
to further stimulate growth and confidence. In the short term, the need<br />
to re-invigorate the economy has taken precedence over dealing with<br />
the budget deficit and the need to overhaul financial regulation. The key<br />
to revival is the restoration of confidence across all sectors, from<br />
investors through to consumers, which can only begin with the freeing of<br />
the credit lock-up.<br />
Phoenix<br />
Within the Phoenix Metro area,<br />
commercial construction has slowed<br />
significantly which, together with a<br />
continued stagnant residential construction<br />
market, puts the Phoenix Metro area firmly<br />
into a construction cycle downturn which<br />
is expected to last into 2010. Recently,<br />
numerous public and privately funded<br />
construction projects have been placed<br />
on-hold. This indicates that, at least in the<br />
near-term, Phoenix is likely to experience a<br />
continued downward spiral with job losses,<br />
reduced construction volume, investor<br />
and lender fright and further calls for<br />
government support of the construction<br />
industry.<br />
One of the main reasons for the significant<br />
slowing of overall construction, particularly<br />
commercial related construction, is ongoing<br />
significant pressures on both City and State<br />
budgets. The State is facing budget deficits<br />
of over $1.2B in 2009 and potentially over<br />
$2.0B in 2010.<br />
There continues to be much debate<br />
surrounding the higher education<br />
investment/economic stimulus package<br />
(SPEED) which, despite receiving legislature<br />
approvals to spend up to $1.4B to renovate<br />
and build educational facilities within<br />
Arizona, has recently run into final approval<br />
difficulties from within the Joint Committee<br />
on Capital Review (JCCR). At this time<br />
there remains a great deal of uncertainty<br />
10<br />
INTERNATIONAL CONSTRUCTION COST COMMENTARY: January 2009
on the future of all SPEED related projects<br />
which, if implemented in their entirety,<br />
could potentially significantly help Arizona’s<br />
economy, which relies heavily on the<br />
construction industry.<br />
Despite the stagnant housing sector it is<br />
widely anticipated that, with The State<br />
of Arizona continuing to experience<br />
population growth, this current trend will<br />
show signs of a slow recovery in early<br />
2010. It is further anticipated that a slow<br />
recovery within commercial construction<br />
related works may follow behind the<br />
housing sector.<br />
Boston<br />
The Boston market continues its<br />
downward spiral.<br />
The residential construction market<br />
continues to struggle, with no new large<br />
scale condominium projects planned in the<br />
city and single family home construction<br />
effectively stalled. Condominium sales<br />
remain significantly below last year’s<br />
numbers and the median price of a single<br />
family home has now dropped by 14% over<br />
the last 12 months.<br />
The commercial market has suffered<br />
considerably during the credit crisis in the<br />
last 6 months, with all but a handful of the<br />
ongoing city centre developments grinding<br />
to a halt over issues with financing. Lenders<br />
have been reviewing and withdrawing<br />
financing on projects, while developers are<br />
seeking to fill their yet-to-be built office<br />
building before committing to construction.<br />
Office rents remain inflated, but with<br />
vacancy rates rising steadily as businesses<br />
downsize, this should correct over the upcoming<br />
months.<br />
Hospitals and Universities, long considered<br />
the “safe” option in Boston, have also<br />
signalled a cautious approach for the<br />
upcoming year. With issues over bond<br />
financing and reduction in endowments,<br />
the city’s major health and educational<br />
institutions have placed major capital<br />
projects under review and halted a number<br />
of high profile developments.<br />
Contractors are becoming more aggressive,<br />
and the only silver lining currently out<br />
there is that the next 12 months will be a<br />
great time to build - if finance is available.<br />
Los Angeles<br />
Los Angeles experienced significant declines<br />
in construction activity across many sectors<br />
in 2008 with residential permits down<br />
41.7% and non-residential permits down<br />
16.6%.<br />
The devastated national credit market is<br />
reflected in Los Angeles with construction<br />
lending down 52.5% and many projects<br />
struggling to break ground. Most notably,<br />
Los Angeles’ marquee project, the $2.7<br />
billion mixed-use development of Grand<br />
Avenue faces continued delays due to<br />
major financing issues.<br />
The residential market has been significantly<br />
impacted by the credit freeze. Park Fifth, a<br />
$1.3 billion 76-story development; Suncal<br />
Condo Tower, a $400 million dollar<br />
development and 9900 Wilshire Blvd., a<br />
$366 million dollar development have all<br />
been placed on hold. This trend is mirrored<br />
throughout the private sector in Los<br />
Angeles with construction loans becoming<br />
increasingly tougher to obtain.<br />
The one bright light for construction in<br />
Los Angeles is public projects. With funds<br />
already in place, these projects are avoiding<br />
the credit issues plaguing the private sector.<br />
Three major new infrastructure projects<br />
broke ground in 2008 totalling $470 million.<br />
The ongoing $869 million Metro Gold Line<br />
expansion and $504 million Tom Bradley<br />
<strong>International</strong> Terminal are both under<br />
construction until 2010. Public school<br />
construction is pushing forward with the<br />
$391 million Central Los Angeles Learning<br />
Center and two new LAUSD campuses<br />
totalling $218 million.<br />
In 2009 it is anticipated that there will be<br />
a continued reliance on the public sector<br />
to stimulate the Los Angeles construction<br />
economy, with no sign of improvement in<br />
any private sectors expected until 2010.<br />
New York<br />
The New York City area, like most<br />
major urban centres in the United States,<br />
has begun to experience a downturn in<br />
construction activity across all sectors.<br />
While construction continues on priorfunded<br />
privately financed projects, it is<br />
apparent that the area is bracing for a<br />
protracted and severe economic slowdown.<br />
The market for office space as well as<br />
luxury high-rise residences has dropped off.<br />
This, coupled with the dearth of private<br />
financing, has resulted in significant layoffs<br />
among the city’s largest developers.<br />
The hotel and hospitality sector has been<br />
particularly hard hit, experiencing declining<br />
occupancy rates in the 4th quarter of 2008<br />
(traditionally a busy season) for the first<br />
time in recent memory. It is expected that<br />
some 9,000 new rooms will come on line<br />
in 2009, mostly in the three-star and below<br />
category. No new five-star development is<br />
planned and the last of the major five star<br />
renovations is underway.<br />
The State is in the midst of a multi-billion<br />
dollar budget gap and the public sector<br />
will feel the pinch in coming months as<br />
government and agency projects are<br />
shelved. Quasi-public entities such as<br />
colleges and universities, especially privately<br />
endowed institutions, continue to develop<br />
capital projects as well as upgrades,<br />
maintenance, and even investment.<br />
Prices for major durable commodities have<br />
levelled or started to decline, especially<br />
those which are energy sensitive, in the<br />
wake of severely declining crude oil prices.<br />
Gasoline surcharges, in place for most of<br />
2008, are being rescinded.<br />
11<br />
INTERNATIONAL CONSTRUCTION COST COMMENTARY: January 2009
<strong>Commentary</strong> by region:<br />
Asia<br />
200<br />
180<br />
160<br />
140<br />
120<br />
Index<br />
100<br />
80<br />
60<br />
40<br />
20<br />
January 2009<br />
2005<br />
2006<br />
2007<br />
2008<br />
2009<br />
2010<br />
Year<br />
•Beijing •Guangzhou •Hong Kong •Macau •Shanghai •Shenzhen •Singapore<br />
Tender Price Relativity Matrix -<br />
comparative costs of construction<br />
Singapore 112<br />
Hong Kong 107<br />
Macau 104<br />
Beijing 78<br />
Shanghai 73<br />
Guangzhou 67<br />
Shenzhen 67<br />
Chinese GDP has returned to single figures, after peaking at almost 12%.<br />
This is symptomatic of falling demand and softening exports. However,<br />
China’s fiscal position remains strong and further stimulus to the economy<br />
could be derived from income tax reductions, following on from deep<br />
cuts in interest rates. Hong Kong, as a major financial centre has been<br />
particularly hard-hit, with huge losses recorded on the Hang Seng, tensions<br />
in the interbank market due to the credit crunch, depressed local demand<br />
and falling property values, following on from last year’s gains. Macau’s<br />
economy, founded as it is on tourism, entertainment and casinos, has<br />
suffered similarly as a direct consequence of rapidly falling consumer<br />
and investor sentiment. The freezing up of credit markets has severely<br />
strained Macau’s construction boom, resulting in suspension of several<br />
large projects under construction. The slowdown in Asian economies and<br />
property markets has also affected Singapore’s economic performance and<br />
market sentiment in the second half of 2008. Following the construction<br />
boom in Singapore for 2008, overall construction demand for 2009 is likely<br />
to weaken and building tender prices are expected to moderate.<br />
Hong Kong<br />
Tender prices in Hong Kong have risen<br />
continuously since 2005. However, in the<br />
midst of the current global financial crisis,<br />
which has worsened since September 2008,<br />
it has now become evident that the rising<br />
trend in tender prices has reversed and the<br />
<strong>Rider</strong> <strong>Levett</strong> <strong>Bucknall</strong> tender price index has<br />
peaked in the third quarter of 2008. Since<br />
August 2008, there have been fundamental<br />
shifts in two key factors, namely the<br />
surge in commodity prices and the Macau<br />
construction boom, which led to the rapid<br />
rise in tender prices in Hong Kong in the<br />
past two years. Commodity prices have<br />
now fallen rapidly against a much stronger<br />
US dollar, and also a number of major<br />
projects in Macau have been suspended.<br />
The unemployment rate of construction<br />
workers is expected to increase in the early<br />
part of 2009 as a large number of workers<br />
return to Hong Kong from Macau.<br />
Tender prices have fallen dramatically<br />
from the end of third quarter 2008 and<br />
12<br />
INTERNATIONAL CONSTRUCTION COST COMMENTARY: January 2009
are expected to continue to drop in the<br />
first two to three quarters of 2009 before<br />
stabilising. The overall fall could be at least<br />
15% from the peak. Since the Hong Kong<br />
government has pledged to increase capital<br />
expenditure as one of the measures to<br />
combat the financial crisis and there will be<br />
more public sector projects going out to<br />
tender in the second half of 2009, tender<br />
prices are likely to show some mild upward<br />
swing towards the end of 2009. If by that<br />
time the US dollar has weakened again,<br />
as some economists have warned, and as<br />
the Hong Kong dollar is pegged to the US<br />
dollar, the rebound of tender prices may be<br />
more significant.<br />
Macau<br />
The construction boom in Macau has<br />
come to an abrupt end in the aftermath<br />
of the credit crunch, which impacted in<br />
September 2008. <strong>Construction</strong> activities in<br />
Macau have slowed down significantly and<br />
are expected to further deteriorate with<br />
the suspension of major casino and hotel<br />
projects. The overall real wage index of<br />
construction workers fell 11.83% year-onyear<br />
in the third quarter of 2008 and will<br />
decline further in the coming quarters as<br />
the remaining few projects in the gaming<br />
industry are progressively completed.<br />
With very few new projects available in<br />
the market and the fall in materials prices<br />
due to weak demand, construction cost in<br />
Macau is expected to fall substantially in the<br />
early part of 2009.<br />
Beijing, Shanghai, Guangzhou,<br />
Shenzhen<br />
Year-on-year growth in GDP slowed to 9%<br />
in the third quarter of 2008 from 10.6% in<br />
the first and 10.1% in the second, signifying<br />
that China’s economy is rapidly cooling<br />
down in the midst of the global financial<br />
crisis. The consumer price index rose 4%<br />
year-on-year in October 2008, which was<br />
significantly lower than the 8.7% recorded in<br />
February. Although construction activities<br />
have continued to expand, recording a yearon-year<br />
growth of 22.8% in construction<br />
output value in the first three quarters of<br />
2008, construction costs have began to<br />
decline as materials prices are falling due to<br />
weak demand country-wide.<br />
Many developers have suspended projects<br />
as a result of the fall in property values and<br />
the credit crunch.. The declining trend of<br />
construction cost will continue in the early<br />
part of 2009 when the central government’s<br />
4 trillion Yuan economic stimulus package is<br />
expected to gradually produce the desired<br />
effect.<br />
Singapore<br />
Singapore entered economic recession<br />
in the third quarter of 2008, as the global<br />
financial crisis began to impact upon the<br />
local economy in most sectors. Singapore’s<br />
GDP contracted by 0.6% year-on-year,<br />
with the construction industry registering<br />
a slower but double-digit growth of 12.8%<br />
for the same period. The government<br />
has adjusted its GDP growth forecast<br />
downwards to 2.5% in 2008 from the earlier<br />
forecast of 3%; and -1% to 2% in 2009.<br />
The Singapore property market has been<br />
affected by the global financial uncertainty,<br />
with declines in private residential sale<br />
prices and office rentals. The government<br />
has reduced the availability of land sites<br />
in view of the weakening outlook for the<br />
economy and the subdued property market.<br />
Data from the Building and <strong>Construction</strong><br />
Authority (BCA) showed a contraction<br />
of private sector construction demand by<br />
37.5% for the third quarter of 2008 over<br />
the preceding quarter. As construction<br />
demand from the private sector reduces, the<br />
authorities have advised that it is monitoring<br />
the situation closely and public sector<br />
projects that were previously deferred may<br />
be brought forward.<br />
Underpinned by high construction demand<br />
for 2008, the BCA has estimated that<br />
construction demand could reach an alltime<br />
high of around S$30 billion. The BCA<br />
All Buildings Tender Price Index (TPI) for<br />
the third quarter registered a 14% yearon-year<br />
increase. <strong>Rider</strong> <strong>Levett</strong> <strong>Bucknall</strong>’s<br />
TPI remained at an average tender price<br />
escalation of 18.3% for the first 9 months<br />
of 2008 as compared with 2007. However<br />
for the fourth quarter, building tender<br />
prices eased, arising from a significant<br />
fall in tendering activity, and declines in<br />
contracting margins and building material<br />
prices. This declining trend is anticipated to<br />
continue through 2009, as the property and<br />
construction markets consolidate further.<br />
<strong>International</strong> Finance Centre Two, Hong Kong.<br />
Quantity Surveying by <strong>Rider</strong> <strong>Levett</strong> <strong>Bucknall</strong>.<br />
LASALLE College of the Arts, Singapore.<br />
Photo courtesy of RSP Architects Planners &<br />
Engineers (Pte) Ltd.<br />
Project Management by <strong>Rider</strong> <strong>Levett</strong> <strong>Bucknall</strong>.<br />
13<br />
INTERNATIONAL CONSTRUCTION COST COMMENTARY: January 2009
<strong>Commentary</strong> by region:<br />
EMEA<br />
200<br />
180<br />
160<br />
140<br />
120<br />
Index<br />
100<br />
80<br />
60<br />
40<br />
20<br />
January 2009<br />
2005<br />
2006<br />
2007<br />
2008<br />
2009<br />
2010<br />
Year<br />
•Birmingham •Bristol •Dubai •London •Sheffield •Manchester<br />
Tender Price Relativity Matrix -<br />
comparative costs of construction<br />
London 151<br />
Bristol 128<br />
Manchester 124<br />
Birmingham 120<br />
Sheffield 119<br />
14<br />
INTERNATIONAL CONSTRUCTION COST COMMENTARY: January 2009<br />
European and particularly UK construction markets continue to be badly<br />
affected by the global downturn, the key symptoms being cancelled or<br />
deferred projects and extremely competitive conditions in the tendering<br />
marketplace. The extraction from Europe of skilled management and<br />
site labour to the UAE is now drying up as the UAE is also now being<br />
affected by global economic events. In the final quarter of 2008 several<br />
major projects in Dubai were brought to a standstill by falling demand and<br />
declining property values, mirroring the events which unfolded in Europe<br />
from the middle of the second quarter.<br />
Dubai 110 London<br />
pricing levels are currently extremely<br />
As the world economy continues to competitive. <strong>Rider</strong> <strong>Levett</strong> <strong>Bucknall</strong> forecast<br />
stagnate, London has seen in the last all-in tender price levels in London to<br />
quarter a significant fall in the demand for decrease by between 2.5% and 5.0% during<br />
building materials generally and in the price 2009 and up to 2.0% in 2010.<br />
of steel in particular. With the falling price<br />
of oil and waning demand for raw materials, Bristol<br />
the previously forecast inflationary pressure <strong>Construction</strong> activity levels are forecast<br />
on material prices has disappeared. The to deteriorate even further in the South<br />
recently announced Government capital West region over the next 12 months,<br />
construction spend package of £3bn is set following on from the difficulties of the last<br />
to mitigate part of this deficit and provide 6 months. As is the case in most of the<br />
a boost to the education, infrastructure UK, the residential sector is suffering due<br />
and affordable housing sectors. However, to difficulties in obtaining mortgages. We<br />
main contractors’ long term order books have also experienced a delay in enquiries<br />
are showing signs of weakening and to from Registered Social Landlords, as they<br />
win work we are now seeing a return to wait for the market to bottom out prior to<br />
acceptance of more risk averse tendering purchasing available sites.<br />
methods, such as single stage selective<br />
tendering.<br />
Commercial construction, covering offices,<br />
industrial and retail, is also experiencing<br />
The market is also experiencing the a slowdown. Examples are the recent<br />
tightening up of Main Contractor’s<br />
completion of major developments such as<br />
preliminaries and OHP levels. Sub-contract Cabot’s Circus in Bristol City Centre and
St David’s II in Cardiff which will effectively<br />
remove demand for retail development for<br />
some time. A number of key mixed use<br />
developments in the South West region<br />
have also been cancelled or delayed while<br />
confidence remains low.<br />
The South West and Bristol Region is<br />
following the National Trend with the<br />
downturn leading to redundancies among<br />
contractors, construction consultants,<br />
property agents and developers.<br />
Public sector works carries on however,<br />
particularly in the Defence, Education<br />
and Health Sectors, with major projects<br />
development programmes planned over the<br />
next five years, for example the Defence<br />
Training Academy in Wales.<br />
We believe the next 12 months will be<br />
a difficult and challenging period for the<br />
construction market, however the low<br />
levels of activity within the commercial<br />
sector will to some extent be offset by<br />
continued public sector spending.<br />
Manchester<br />
As with other UK and Global markets<br />
the Manchester and North West<br />
market has seen a significant decline in<br />
construction activity in the last 6 months.<br />
As the economy continues to languish,<br />
construction activity is likely to deteriorate<br />
further through 2009.<br />
The residential sector has been hit<br />
particularly hard, with North West house<br />
values suffering more than the UK average<br />
and with a substantial stock of apartments<br />
within Manchester remaining unsold. Local<br />
Registered Social Landlords have revised<br />
their strategies away from constructing<br />
shared ownership homes toward a rental<br />
accommodation bias.<br />
The commercial office market is<br />
experiencing a slowdown, as a number of<br />
major office schemes completing in 2009<br />
and 2010 have yet to secure occupiers,<br />
providing a surplus of accommodation and<br />
deterring developers from progressing new<br />
projects. It is predicted that Manchester<br />
city centre office rents are likely to perform<br />
worse than in any other major centre<br />
outside London. Two major occupiers who<br />
were recently looking for nearly 200,000<br />
square feet of accommodation have put<br />
searches on hold.<br />
A number of key developments in the<br />
North West have been cancelled or<br />
delayed, including Liverpool Football<br />
Club’s new stadium (£350m) and Stockport<br />
town centre redevelopment (£500m).<br />
Other large commercial developments<br />
are rumoured to be in delay or are being<br />
scaled down.<br />
The downturn has now led to redundancies<br />
starting to escalate among contractors,<br />
construction consultants, property agents,<br />
developers and even legal firms, with<br />
insolvencies also starting to rise.<br />
However, quasi public sector schemes<br />
remain a strong contributor to the<br />
market. North West universities such as<br />
Manchester Metropolitan, Liverpool and<br />
University of Cumbria all have significant<br />
capital projects in the pipeline, and the<br />
Government’s Housing Market Renewal<br />
Programme has over £500m of funding<br />
allocated to five key North West regions.<br />
Although the contraction of the market<br />
has led to more competitive levels of<br />
tendering, care should be taken regarding<br />
advising that overall construction prices will<br />
fall significantly due to the continued high<br />
price of materials and the poor levels of<br />
exchange rates.<br />
In summary, whilst the outlook for the<br />
commercial sector is poor, public sector<br />
spending is compensating to some degree,<br />
so it is not all bad news. However, the next<br />
12 months will be a difficult and challenging<br />
period for the North West construction<br />
market.<br />
Sheffield<br />
<strong>Construction</strong> work has slowed down<br />
dramatically across the area. The<br />
Sevenstones retail development, which<br />
will provide 860,000 ft2 in the heart of the<br />
city centre has been delayed until at least<br />
4th Quarter 2009. This has had a knock<br />
on effect on ancilliary demolition projects,<br />
which have also been shelved. The Moor<br />
development, which is set to revive the<br />
main pedestrian shopping area in the city<br />
with its indoor market has also been put<br />
on hold.<br />
Residential, office and hotel developments,<br />
which commenced prior to the global crisis<br />
are continuing to be completed, however<br />
new schemes are slow to reach the market<br />
Birmingham<br />
The Birmingham market has been severely<br />
hit by the credit crunch. Major schemes<br />
have been put on hold due to a lack of<br />
availability of finance and recent cuts in<br />
interest rates have not yet filtered through<br />
to the market.<br />
We envisage a reduction in tender prices<br />
over the next 12 to 18 months driven<br />
by increased competition for a reduced<br />
workload and reducing material prices,<br />
driven down by a sharp reduction in<br />
worldwide demand. However, due to the<br />
decrease in the value of sterling comparable<br />
to currencies used in trading commodities<br />
and construction materials, the full effect of<br />
the reduction in material prices will not be<br />
realised in the UK.<br />
Contractors and subcontractors are<br />
reducing margins in order to secure<br />
workload.<br />
This cannot be sustainable in the long term,<br />
and we see this resulting in a reduction in<br />
the general contracting market if market<br />
conditions and workload do not improve in<br />
the near future.<br />
The upside of the reduction in tender<br />
prices will provide clients with funding<br />
with a window of opportunity to procure<br />
projects at lower cost than has been<br />
recently available.<br />
Dubai<br />
The rapid ascent of the Dubai construction<br />
market has been slowed somewhat by<br />
the fall-out from global economic woes.<br />
Recent announcements of several major<br />
high-profile projects such as the Trump<br />
<strong>International</strong> Hotel and Tower being<br />
deferred or postponed, have followed hard<br />
on news of sharp falls in property values<br />
and the retreat of overseas investors.<br />
These effects are of course demonstrative<br />
of the impact of extremely problematic<br />
global economic conditions, but they<br />
also demonstrate the enormous external<br />
investment in Dubai from around the globe.<br />
However, it has to be said that no-one<br />
could be better-placed to withstand the<br />
economic storm than the Emirates, given<br />
the huge value of natural resources and the<br />
fact that a recovering global economy will<br />
once again demand the key product, namely<br />
oil, reliance on which the UAE is seeking<br />
to diversify away from by building into the<br />
service, tourism and industrial markets.<br />
As the Dubai construction economy<br />
scales back to shelter from the storm,<br />
the outcome will be significant reductions<br />
in the annual levels of construction cost<br />
increase to which we have become<br />
accustomed. Depending on the severity of<br />
the ongoing economic difficulties and the<br />
point at which the bottom is reached, there<br />
is of course the potential for large-scale<br />
deferral of work, as is evidenced by the<br />
sheer volume of currently ongoing work.<br />
That can be very rapidly affected by funding<br />
and viability concerns, which would spill<br />
over into demand for labour and materials.<br />
15<br />
INTERNATIONAL CONSTRUCTION COST COMMENTARY: January 2009
<strong>Commentary</strong> by region:<br />
Oceania<br />
200<br />
180<br />
160<br />
140<br />
120<br />
Index<br />
100<br />
80<br />
60<br />
40<br />
20<br />
January 2009<br />
2005<br />
2006<br />
2007<br />
2008<br />
2009<br />
2010<br />
Year<br />
•Adelaide •Canberra •Brisbane •Auckland •Christchurch<br />
•Darwin •Melbourne •Sydney •Perth •Wellington<br />
The supposed strength of the Australian economy has been challenged recently from several directions, stemming<br />
largely from international trade and finance linkages. Despite deep cuts in interest rates, the prospect looms<br />
of a continuing slide into recession, unless the bottom of the bear market is found and sentiment changes. The<br />
effect on construction has been shelved and cancelled projects and a general retreat from risk. Similar, but more<br />
profound effects are being experienced in New Zealand, where the credit availability problems touched down<br />
earlier, with several mezzanine funders failing, funding became harder to find and swingeing interest rate cuts<br />
designed to stimulate demand. In both Australia and New Zealand however, the silver lining on this particular<br />
cloud is the fact that, in many locations, the time to buy construction is now, as there are many contractors<br />
chasing few projects, creating a strong competitive edge to the contracting environment.<br />
Tender Price Relativity Matrix -<br />
comparative costs of construction<br />
Perth 132<br />
Darwin 128<br />
Adelaide 112<br />
Sydney 109<br />
Brisbane 109<br />
Melbourne 106<br />
Canberra 106<br />
Wellington 102<br />
Auckland 98<br />
Christchurch 92<br />
Adelaide<br />
In Adelaide there are a number of private<br />
projects being put on hold as a response to<br />
difficulties in obtaining funding, which, even<br />
if it is available, is bound into higher equity<br />
commitment on the part of the developer.<br />
The Federal Government’s approach<br />
has been to consider raising spending<br />
to stimulate the economy, whereas the<br />
State Government is debating cutting<br />
spending so as to avoid deficit. At the same<br />
time, costs of construction may show a<br />
modest rise due to labour cost increase<br />
through established enterprise bargaining<br />
agreements and imported materials<br />
increase, which are affected by the fall in<br />
the dollar.<br />
Although ongoing construction projects will<br />
fully utilise the capacity of the industry in<br />
the first half of 2009, we are already seeing<br />
both contractors and sub-contractors<br />
looking to replenish order books in a<br />
suddenly much more circumspect market.<br />
Brisbane<br />
The significant boom in office developments<br />
has slowed and the stalling of several<br />
projects is likely to result in an oversupply<br />
being avoided. Public sector work is<br />
progressing, although forecast tax revenue<br />
shortfalls may result in certain projects<br />
being delayed or deferred. Meanwhile in the<br />
retail sector, low consumer confidence, high<br />
hurdle rates and the reluctance of tenants<br />
to commit has resulted in a significant<br />
slowdown, although we expect this sector to<br />
recover quickly from the downturn, driven<br />
by population growth. Materials costs are<br />
still rising, although they are being subsumed<br />
in falling labour costs and reducing margins.<br />
A clear 2-tier market has emerged, the<br />
cost of major projects continuing to rise<br />
albeit more slowly than in previous years.<br />
However the more general market has<br />
tightened.<br />
16<br />
INTERNATIONAL CONSTRUCTION COST COMMENTARY: January 2009
Canberra<br />
The volume of projects now entering<br />
the marketplace has reduced to a more<br />
sustainable level with the result that more<br />
competitive tendering conditions are now<br />
being felt. With the smaller selection of<br />
projects available, local contractors and<br />
sub-contractors alike are reducing their<br />
overheads and margins in an attempt<br />
to secure future workload, especially<br />
since many Sydney-based companies are<br />
venturing further afield into the Canberra<br />
market. Despite continuing upward<br />
pressure on material and labour costs,<br />
overall prices increases are modest and<br />
have been somewhat camouflaged by the<br />
tighter tendering conditions and eroding<br />
margins.<br />
Contractor sentiment towards the state<br />
of the market is apprehensive and there<br />
are signs of reduced confidence in the<br />
residential and commercial sectors.<br />
However, the public sector continues<br />
to provide a consistent stream of work,<br />
somewhat offsetting the slowdown in<br />
commercial sectors.<br />
The immediate outlook is for extremely<br />
competitive market conditions, offering<br />
potential clients an excellent tendering<br />
environment in the first half of 2009.<br />
Darwin<br />
The recent announcement that<br />
international giant Inpex will be investing<br />
$12bn in a new gas plant in Darwin in two<br />
years time is keeping optimism high and<br />
the economy buoyant in the NT. Front<br />
end engineering and design for the plant<br />
will be starting soon and a Govt. task force<br />
has been formed to ensure adequate social<br />
and economic infrastructure is put in place<br />
in time for the influx of workers and their<br />
families to Darwin over the coming years.<br />
This coupled with intervention works in<br />
remote communities, continuing works on<br />
the Darwin City Waterfront Project, and<br />
continuing and upcoming Defence projects<br />
at all major NT Defence bases will see<br />
tender prices continue their upward trend.<br />
Notwithstanding the current global credit<br />
crunch, with this scale of development<br />
earmarked for Darwin, we expect the<br />
construction industry to remain strong<br />
over the coming period.<br />
Melbourne<br />
Several major commercial projects are<br />
currently running through to completion<br />
in the next six months, amidst an already<br />
tightening overall construction market.<br />
Tendering opportunities have become<br />
scarce as developers have shied away from<br />
marginal projects, due to inability to obtain<br />
finance and lack of tenant certainty. All this<br />
has given rise to cuts in contractor and subcontractor<br />
margins, set alongside increasing<br />
building materials and wages costs and<br />
further fuelled by falling exchange rates,<br />
rising utilities costs and industry awards.<br />
There remains pent-up demand for<br />
residential projects and developers are<br />
exploring options, however these are<br />
dependant upon the return of confidence<br />
in the market and ability to obtain funding.<br />
Industry clients with high liquidity of funding<br />
will find excellent competitive tendering<br />
conditions in the first half of 2009. The<br />
public sector will be particularly well-placed<br />
to obtain good pricing for projects.<br />
Perth<br />
The Western Australian economy is<br />
probably better placed than most States in<br />
Australia to weather the current economic<br />
storms. However, the extent to which<br />
China slows or slips into recession has<br />
potential to initiate a further deterioration.<br />
Most construction sectors have been<br />
similarly affected by the slowdown and<br />
forecasts are for very much reduced<br />
consumer demand in the coming period.<br />
One result has been that, although rents<br />
are at an all time high, uncertainties in the<br />
general economy and a more cautious<br />
new State Government have led to the<br />
cancellation of a number of major projects.<br />
Whilst materials costs are anticipated to<br />
continue rising, labour costs have levelled<br />
and may even be falling in some specific<br />
trades.<br />
Overall, this is the first relief from a<br />
prolonged period of price increases.<br />
Tenders are beginning to show signs of<br />
increased competitiveness returning to the<br />
market.<br />
Sydney<br />
In addition to the global and national<br />
economic problems, there is ongoing<br />
uncertainty in the Sydney market for<br />
both the short and medium term, due to<br />
a State mini budget that raised property<br />
and land taxes and reduced infrastructure<br />
expenditure as well as the Federal proposal<br />
for increased expenditure on undefined<br />
capital works projects. Contractors are<br />
very aware that the number of future<br />
projects is diminishing. Current projects<br />
are nearing completion and it is becoming<br />
increasingly difficult to replace work in<br />
hand, so Contractors and sub contractors<br />
alike are now keen to look at all tender<br />
opportunities. As a consequence, labour<br />
cost increases are being absorbed within<br />
profit margins and materials price rises<br />
are being discounted as contractors<br />
and suppliers look to secure works<br />
commencing in the new year.<br />
Reduced tendered margins are being<br />
experienced and we expect this trend to<br />
continue throughout 2009.<br />
Auckland<br />
Despite interest rate cuts since July, the<br />
Auckland residential market remains flat.<br />
Meanwhile, the other building market<br />
sectors have now become similarly<br />
affected, with demand and access to<br />
development finance rapidly declining.<br />
Only the infrastructure sector has been<br />
unaffected by the downturn, with central<br />
Government funded projects continuing<br />
through the maelstrom. Local government<br />
spending conversely is set to be slashed.<br />
Despite weak demand, building materials<br />
costs for contractors are rising, due<br />
to general cost increases coupled with<br />
the falling New Zealand dollar, which<br />
is offsetting recent falls in international<br />
commodity prices. Highly competitive<br />
market conditions however are set to<br />
remain, with contractors targeting margins<br />
and overheads to secure a limited supply<br />
of work.<br />
The constraint on this process will be the<br />
point at which deeper cuts into profit levels<br />
become unsustainable.<br />
Christchurch<br />
General economic conditions in<br />
Christchurch mirror those in Auckland,<br />
although Christchurch has several<br />
major projects currently either under<br />
construction, recently commenced (AMI<br />
Stadium and New Christchurch Civic<br />
Building) or due to commence shortly<br />
(Christchurch Airport Redevelopment).<br />
Together, they have a combined value<br />
in excess of $300 million, which will be<br />
keeping the industry relatively busy well<br />
into and possibly through 2009. However,<br />
we are noting in recent tenders, greatly<br />
increased competition and associated price<br />
cutting in terms of margins.<br />
These conditions are likely to persist in<br />
the next period as tendering opportunities<br />
continue to be adversely affected by the<br />
lack of confidence in the market and<br />
problems of financing. This is already<br />
apparent in the small to mid-size project<br />
end of the market.<br />
Wellington<br />
Wellington is also feeling the effects of<br />
the credit crunch, but is coming off a 20<br />
year high in construction volume. The<br />
excess of labour supply thus created is<br />
giving rise to competition and price cutting<br />
in the context of fewer new tendering<br />
opportunities. However, Wellington has<br />
at least six major projects commenced<br />
or about to commence, with a total<br />
value of approx $200m. Further, two<br />
major Wellington City Council (WCC)<br />
projects are currently seeking consultant<br />
submissions, with confirmation that they<br />
will proceed, and there is also the new<br />
sports stadium and extensions to the City<br />
Art Gallery.<br />
These projects plus others in mid<br />
construction will keep the workforce busy<br />
through 2009 and into 2010.<br />
17<br />
INTERNATIONAL CONSTRUCTION COST COMMENTARY: January 2009
<strong>International</strong> Building <strong>Cost</strong>s<br />
LOCATION<br />
LOCAL<br />
CURRENCY<br />
OFFICE BUILDING RETAIL HOTELS<br />
PREMIUM<br />
GRADE A<br />
SHOPPING<br />
STRIP<br />
CENTRE SHOPPING<br />
5 STAR 3 STAR<br />
/ m2 / m2 / m2 / m2 / m2 / m2<br />
ASIA<br />
Beijing YUAN 6200-9050 5750-8700 6900-10450 5350-6800 10350-13250 7550-9500<br />
Guangzhou YUAN 5850-8650 5450-8200 6500-9550 4900-6250 9750-12350 7150-8750<br />
Hong Kong HK$ 13050-17600 12250-16800 13900-17900 10850-13850 19950-24300 16200-18800<br />
Macau MOP 12400-17000 11550-16100 13600-17000 19650-24100 15700-18700<br />
Shanghai YUAN 6050-8900 5550-8450 6800-10250 5250-6700 10150-13100 7550-9300<br />
Shenzhen YUAN 5850-8650 5450-8200 6500-9550 4900-6250 9750-12350 7150-8750<br />
Singapore S$ 2250-4250 2150-3200 2400-3450 3500-5000 2900-3350<br />
Jakarta IDR ('000) 8930-11280 7230-9300 6570-7550 12680-16000 10300-12250<br />
Ho Chi Minh City VND ('000) 16000-20000 14440-17500 12900-17500 20800-25500 16000-20550<br />
Seoul KRW (‘000s) 1820-2210 1370-1670 1040-1260 720-880 2460-3000 1400-1710<br />
Phillippines Php (‘000s) 35-40 28-32 28-34 24-28 45-60 38-42<br />
Kuala Lumpur RM 2000-3500 1700-2700 1500-3000 1100-1700 3800-4500 2000-2800<br />
Bangkok Baht (‘000) 30-38 28-30 25-30 20-25 52-67 35-40<br />
EMEA<br />
Birmingham GBP 1920-2500 1490-1920 2690-4130 670-910 1920-2500 1340-1820<br />
Bristol GBP 2020-2590 1540-2020 2780-4320 720-960 2020-2880 1390-1920<br />
Dubai AED 7900-9500 6300-7900 5200-6300 10000-12600 7300-8900<br />
London GBP 2300-2980 1780-2300 3170-4940 820-1100 2300-2980 1580-2210<br />
Manchester GBP 1970-2500 1490-1970 2690-4180 720-910 1970-2500 1340-1870<br />
Sheffield GBP 1870-2400 1440-1820 2590-3980 670-860 1870-2400 1300-1680<br />
OCEANIA<br />
Adelaide $AUD 2490-3580 2290-2780 1140-1640 1190-1340 3180-3830 2680-3080<br />
Auckland $NZ 2850-3260 2600-3160 1070-1840 820-1330 3570-4390 2200-2600<br />
Brisbane $AUD 2650-4050 2100-3150 1200-2090 1100-1600 3400-4550 2650-3800<br />
Canberra $AUD 3010-3690 2310-2880 1450-1750 1130-1700 3530-4130 2220-3070<br />
Christchurch $NZ 2725-3120 2500-3020 910-1400 645-1285 3400-4250 2145-2680<br />
Darwin $AUD 3470-4470 2680-3380 1160-1690 1040-1590 3670-4470 2230-2980<br />
Melbourne $AUD 2900-3600 2250-2800 1500-2000 900-1400 3600-4100 2800-3300<br />
Perth $AUD 3400-4700 2800-3500 1650-2400 1400-1900 4050-5070 2800-4200<br />
Sydney $AUD 3120-3900 2370-2800 1250-2000 1200-1500 3620-4500 2510-3010<br />
Wellington $NZ 2900-3300 2300-2600 1050-1650 850-1350 3600-4400 2400-2800<br />
USA<br />
Boston $USD 2420-3770 1880-2690 1610-2690 1350-2150 3230-4310 2150-3230<br />
Denver $USD 1510-2420 1080-1610 910-1450 700-1350 1990-3010 1130-1780<br />
Honolulu $USD 2370-4200 1990-3390 1670-4040 1400-3610 4200-5700 2690-4630<br />
Las Vegas $USD 1940-2420 1450-2050 1350-2100 1020-1560 2580-3880 1720-2310<br />
Los Angeles $USD 2050-3280 1400-2210 1290-2210 970-1510 2690-3610 1940-2690<br />
Phoenix $USD 1830-2690 1400-2050 1080-1720 970-1510 2260-3500 1510-2050<br />
Portland $USD 1990-2260 1450-2050 1290-2150 970-1610 2050-3070 1610-1990<br />
San Francisco $USD 2210-3440 1510-2310 1350-2530 1180-1780 2740-3770 2150-2910<br />
Seattle $USD 1780-2530 1240-2150 970-1830 970-1450 2370-3230 1670-2370<br />
Washington DC $USD 1830-3440 1510-2150 1020-2150 810-1510 2100-3340 1450-2050<br />
NY Region $USD 2480-3340 1940-2690 1400-1990 1290-1830 3500-4840 1990-2850<br />
18<br />
INTERNATIONAL CONSTRUCTION COST COMMENTARY: January 2009
LOCATION<br />
LOCAL<br />
CURRENCY<br />
CAR PARKING INDUSTRIAL RESIDENTIAL MULTI-STOREY<br />
MULTI-STOREY BASEMENT FACTORY WAREHOUSE INVESTMENT<br />
OWNER<br />
OCCUPIED<br />
/ m2 / m2 / m2 / m2 / m2 / m2<br />
ASIA<br />
Beijing YUAN 1850-2450 2900-5150 2000-2800 2350-3400 2900-3400 3400-4650<br />
Guangzhou YUAN 1750-2300 2900-5100 1850-2550 2250-3350 2700-3100 3100-4250<br />
Hong Kong HK$ 5250-6100 8800-12800 6000-7000 6750-8200 9750-11800 11500-14450<br />
Macau MOP 5950-7900 7000-9450 8600-13650<br />
Shanghai YUAN 1850-2450 3150-5350 1950-2750 2350-3450 2900-3350 3350-4550<br />
Shenzhen YUAN 1750-2300 2900-5100 1850-2550 2250-3350 2700-3100 3100-4250<br />
Singapore S$ 680-1350 1450-2300 1160-1620 1000-1660 2000-2580 2450-4280<br />
Jakarta IDR ('000) 2650-3700 3700-4700 4250-5200 3700-4700 5200-6800 6150-8500<br />
Ho Chi Minh City VND ('000) 6050-9150 12200-16800 6050-7700 6050-7950 10650-13000 11500-15400<br />
Seoul KRW (‘000s) 510-640 670-830 720-880 650-790 880-1070 1170-1430<br />
Phillippines Php (‘000s) 18-20 20-24 27-30 24-28 34-38 36-40<br />
Kuala Lumpur RM 700-1000 1100-1500 950-1500 950-1400 1200-2200 1500-3000<br />
Bangkok Baht (‘000) 10-13 15-18 14-19 13-18 28-38 30-38<br />
EMEA<br />
Birmingham GBP 340-430 720-860 340-480 340-480 910-1490 1490-1920<br />
Bristol GBP 340-480 770-960 340-480 340-480 960-1540 1540-2020<br />
Dubai AED 2600-3150 3150-3700 3150-4700 5000-6300 6300-8900<br />
London GBP 380-480 860-1060 380-530 380-530 1300-1800 1780-2300<br />
Manchester GBP 340-430 720-860 340-480 340-480 910-1490 1490-1970<br />
Sheffield GBP 340-580 770-960 290-580 290-580 1100-1440 1440-1870<br />
OCEANIA<br />
Adelaide $AUD 620-770 940-1320 600-750 500-720 2140-2580 2190-2980<br />
Auckland $NZ 670-1020 1070-1480 460-870 460-820 2550-3050 2550-3750<br />
Brisbane $AUD 600-850 850-1800 630-1050 630-1050 2150-3260 2100-3590<br />
Canberra $AUD 640-880 790-1190 790-920 770-920 2340-2870 2650-3240<br />
Christchurch $NZ 635-970 965-1395 485-750 375-645 2435-2910 2500-3120<br />
Darwin $AUD 690-990 820-1190 750-1270 680-1090 2580-3230 2880-3470<br />
Melbourne $AUD 600-1000 950-1300 500-900 500-950 2400-3100 2700-3450<br />
Perth $AUD 720-1190 1050-1550 670-1100 670-1100 2900-4000 3200-4900<br />
Sydney $AUD 555-880 900-1360 625-850 650-850 2160-2730 2360-4500<br />
Wellington $NZ 700-1100 1200-1400 650-950 690-950 2650-3150 2650-3240<br />
USA<br />
Boston $USD 650-860 810-1080 1080-1610 910-1610 2150-3770 1610-2690<br />
Denver $USD 430-750 700-1020 650-970 750-1670 700-1990<br />
Honolulu $USD 750-1290 1080-1940 1180-3230 1180-1880 1720-3440 2310-6460<br />
Las Vegas $USD 590-910 700-1080 700-1020 650-970 860-2050 1080-2480<br />
Los Angeles $USD 540-970 910-1400 810-1290 700-910 1350-2310 1240-2690<br />
Phoenix $USD 590-750 810-970 750-1080 650-970 910-2260 1080-2580<br />
Portland $USD 860-1080 970-1450 910-1510 860-1180 1290-2420 1450-2530<br />
San Francisco $USD 700-1080 970-1450 1020-1450 750-1080 1510-2530 1400-3340<br />
Seattle $USD 700-910 1240-1400 650-1080 590-970 1290-2690 1290-2690<br />
Washington DC $USD 600-910 790-1160 940-1610 830-1000 1350-1890 1450-2370<br />
NY Region $USD 750-1130 910-1240 1720-2690 1080-1510 1670-2530 2800-4140<br />
19<br />
INTERNATIONAL CONSTRUCTION COST COMMENTARY: January 2009
Key Statistics<br />
AUSTRALIA<br />
YEAR<br />
2005 2006 2007 2008 (P) 2009 (F) 2010 (F)<br />
GDP 2.5 % 2.9 % 4.4 % 2.5 % 1.7 % 2.7 %<br />
GDP per Capita $46,660 $47,263 $48,554 $49,078 $49,560 $50,452<br />
Exchange Rate (to 5 December to US$) 1.338 1.270 1.142 1.548<br />
PPP rate 1.388 1.407 1.425 1.471 1.500 1.507<br />
Inflation 2.8 % 2.9 % 3.0 % 4.6 % 3.3 % 2.4 %<br />
Unemployment 5.0 % 4.8 % 4.4 % 4.3 % 5.3 % 6.0 %<br />
CHINA<br />
YEAR<br />
2005 2006 2007 2008 (P) 2009 (F) 2010 (F)<br />
GDP 10.4 % 11.1 % 11.4 % 9.5 % 8.0 % 9.2 %<br />
GDP per Capita 6,041 Yuan 6,676 Yuan 7,400 Yuan 8,206 Yuan 8,920 Yuan 9,650 Yuan<br />
Exchange Rate (to 5 December to US$) 8.082 7.838 7.408 6.894<br />
PPP rate 3.448 3.450 3.528 3.694 3.793 3.882<br />
Inflation 1.8 % 1.5 % 4.8 % 6.1 % 3.0 % 2.5 %<br />
Unemployment N/A N/A N/A N/A N/A N/A<br />
UNITED ARAB EMIRATES<br />
YEAR<br />
2005 2006 2007 2008 (P) 2009 (F) 2010 (F)<br />
GDP 8.2 % 9.4 % 7.4 % 7.0 % 6.0 % 5.6 %<br />
GDP per Capita AED87,089 AED92,495 AED93,628 AED94,350 AED95,152 AED94,906<br />
Exchange Rate (to 5 December to US$) 3.674 3.674 3.673 3.674<br />
PPP rate 3.632 3.952 4.228 5.326 5.376 5.631<br />
Inflation 7.9 % 9.3 % 11.0 % 12.9 % 10.8 % 8.1 %<br />
Unemployment N/A N/A N/A N/A N/A N/A<br />
EURO ZONE<br />
YEAR<br />
2005 2006 2007 2008 (P) 2009 (F) 2010 (F)<br />
GDP 1.6 % 2.8 % 2.6 % 1.0 % -0.6 % 1.2 %<br />
GDP per Capita (Int $) $29,833 $31,445 $32,939 $33,882 $34,331 $35,164<br />
Exchange Rate (to 5 December to US$) 0.854 0.751 0.681 0.788<br />
PPP rate N/A N/A N/A N/A N/A N/A<br />
Inflation 2.2 % 1.9 % 3.1 % 2.9 % 1.7 % 1.9 %<br />
Unemployment 8.6 % 8.2 % 7.4 % 7.6 % 8.3 % 7.4 %<br />
Definitions<br />
GDP: Gross domestic product, constant prices (Annual percent change)<br />
GDP per Capita: Gross domestic product per capita, constant prices (National currency)<br />
PPP rate: Purchasing Power Parity rate of exchange<br />
Inflation: Consumer Price Inflation<br />
Unemployment: Percentage of total workforce<br />
Exchange Rate as at 5 December 2008<br />
Annual percentages of constant price GDP are year-on-year changes; the base year is country-specific.<br />
GDP in constant national currency per person. Data derived by dividing constant price GDP by total population.<br />
Rate against the <strong>International</strong> dollar (USD), which renders purchasing power identical to the international dollar.<br />
20<br />
INTERNATIONAL CONSTRUCTION COST COMMENTARY: January 2009
NEW ZEALAND<br />
YEAR<br />
2005 2006 2007 2008 (P) 2009 (F) 2010 (F)<br />
GDP 2.7 % 2.0 % 2.6 % -0.5 % -0.4 % 1.9 %<br />
GDP per Capita $30,833 $30,933 $31,535 $31,689 $31,811 $32,175<br />
Exchange Rate (to 5 December to US$) 1.403 1.455 1.311 1.876<br />
PPP rate 1.535 1.535 1.558 1.580 1.631 1.647<br />
Inflation 3.2 % 2.6 % 3.2 % 4.0 % 2.3 % 2.1 %<br />
Unemployment 3.7 % 3.8 % 3.6 % 4.0 % 5.4 % 6.0 %<br />
SINGAPORE<br />
YEAR<br />
2005 2006 2007 2008 (P) 2009 (F) 2010 (F)<br />
GDP 7.3 % 8.2 % 7.7 % 2.5 % 0.5 % 3.0 %<br />
GDP per Capita $46,098 $48,328 $49,933 $50,854 $51,709 $53,478<br />
Exchange Rate (to 5 December to US$) 1.689 1.543 1.448 1.526<br />
PPP rate 1.079 1.052 1.066 1.092 1.098 1.098<br />
Inflation 0.5 % 1.0 % 2.1 % 6.0 % 1.5 % N/A<br />
Unemployment 3.1 % 2.7 % 2.4 % 3.5 % 3.5 % 3.0 %<br />
UNITED KINGDOM<br />
YEAR<br />
2005 2006 2007 2008 (P) 2009 (F) 2010 (F)<br />
GDP 1.8 % 2.9 % 3.1 % 0.8 % -1.1 % 0.9 %<br />
GDP per Capita £19,528 £19,991 £20,512 £20,959 £20,891 £21,105<br />
Exchange Rate (to 5 December to US$) 0.577 0.506 0.485 0.680<br />
PPP rate 0.649 0.646 0.648 0.651 0.658 0.662<br />
Inflation 2.0 % 2.3 % 2.5 % 2.1 % 2.0 % 2.0 %<br />
Unemployment 4.8 % 5.4 % 5.4 % 5.4 % 6.0 % 5.4 %<br />
USA<br />
YEAR<br />
2005 2006 2007 2008 (P) 2009 (F) 2010 (F)<br />
GDP 3.1 % 2.9 % 2.2 % 1.4 % -0.9 % 1.6 %<br />
GDP per Capita $37,141 $37,848 $38,306 $38,400 $38,045 $38,437<br />
Exchange Rate (to 5 December to US$) 1.000 1.000 1.000 1.000 1.000 1.000<br />
PPP rate 1.000 1.000 1.000 1.000 1.000 1.000<br />
Inflation 3.4 % 3.2 % 2.9 % 2.0 % 1.8 % 1.7 %<br />
Unemployment 5.1 % 4.6 % 4.6 % 5.6 % 6.9 % 6.3 %<br />
21<br />
INTERNATIONAL CONSTRUCTION COST COMMENTARY: January 2009
Project Profile:<br />
Lumiere Residences<br />
Location<br />
Client<br />
Approximate <strong>Cost</strong><br />
Regent Place, Sydney, New South Wales, Australia<br />
Frasers Property Australia<br />
AUD$300 million<br />
Completion Date 2008<br />
Sector<br />
Mixed use (residential and retail)<br />
Overview<br />
<strong>Rider</strong> <strong>Levett</strong> <strong>Bucknall</strong> has been involved in<br />
the construction of many of the world’s<br />
landmark tall buildings which form the<br />
skyline of some of our major cities. One<br />
example of such an iconic building is<br />
Lumiere Residences, recently constructed<br />
in Regent Place in Sydney’s mid-town.<br />
Lumiere consists of two towers – Tower<br />
A providing 456 residential apartments<br />
over 56 levels, and Tower B featuring 145<br />
serviced apartments over 30 floors. A five<br />
level sandstone podium beneath the towers<br />
contains a retail centre, commercial space<br />
and Club Lumiere, a leisure and fitness<br />
centre for Lumiere residents.<br />
The project’s renowned architects, Foster<br />
+ Partners, designed the development with<br />
environmental concerns and residents’<br />
privacy in mind. The construction consists<br />
of eight slender glass towers connected to<br />
a central core which allows sunlight and<br />
cross-ventilation to reach to the very heart<br />
of the building. This feature has reduced<br />
the use of common walls allowing residents<br />
a true sense of privacy.<br />
Our Role<br />
Tall buildings first emerged in the United<br />
States in the late 19th century and are<br />
today worldwide architectural phenomenon<br />
requiring increasingly complex construction<br />
knowledge and expertise.<br />
<strong>Rider</strong> <strong>Levett</strong> <strong>Bucknall</strong> has extensive<br />
experience in the construction of tall<br />
buildings and are proud to have provided<br />
Frasers Property Australia with the<br />
following services during the creation of<br />
Lumiere Residences:<br />
• Estimating and strategic cost planning<br />
• Post-contract Project <strong>Cost</strong><br />
Certification<br />
• Production of financier’s reports<br />
• Provision of tax advice<br />
• Replacement cost exercises<br />
• Review and certification of progress<br />
claims<br />
Testimonial<br />
Michael Goldrick, Project Director for<br />
Frasers Property Australia, commented<br />
that:<br />
“During the works I found all [<strong>Rider</strong> <strong>Levett</strong><br />
<strong>Bucknall</strong>] staff very professional and cooperative<br />
in their approach to the various<br />
tasks allocated to the company. I would<br />
have no hesitation recommending and<br />
appointing <strong>Rider</strong> <strong>Levett</strong> <strong>Bucknall</strong> again”.<br />
Images Courtesy of Frasers Property Australia<br />
22<br />
INTERNATIONAL CONSTRUCTION COST COMMENTARY: January 2009
<strong>Rider</strong> <strong>Levett</strong> <strong>Bucknall</strong> Offices<br />
OCEANIA<br />
Australia<br />
Adelaide<br />
Telephone: + 61 8 8100 1200<br />
E-mail: adelaide@au.rlb.com<br />
Contact: Stephen Knight<br />
Brisbane<br />
Telephone: + 61 7 3009 6933<br />
E-mail: brisbane@au.rlb.com<br />
Contact: Mark Burow<br />
Cairns<br />
Telephone: + 61 7 4032 1533<br />
E-mail: cairns@au.rlb.com<br />
Contact: Bill Wilkes<br />
Canberra<br />
Telephone: + 61 2 6281 5446<br />
E-mail: canberra@au.rlb.com<br />
Contact: Mark Chappè<br />
Darwin<br />
Telephone: + 61 8 8941 2262<br />
E-mail: darwin@au.rlb.com<br />
Contact: Paul Lassemillante<br />
Gold Coast<br />
Telephone: + 61 7 5595 6900<br />
E-mail: goldcoast@au.rlb.com<br />
Contact: Peter Spencer<br />
Melbourne<br />
Telephone: + 61 3 9690 6111<br />
E-mail: melbourne@au.rlb.com<br />
Contact: Michael Kerr<br />
Newcastle<br />
Telephone: + 61 2 4940 0000<br />
E-mail: newcastle@au.rlb.com<br />
Contact: Matthew Harris<br />
Northern NSW<br />
Telephone + 61 2 6659 2060<br />
E-mail: northernnsw@au.rlb.com<br />
Contact: Matthew Harris<br />
Perth<br />
Telephone: + 61 8 9421 1230<br />
E-mail: perth@au.rlb.com<br />
Contact: Alastair McMichael<br />
Sunshine Coast<br />
Telephone: + 61 7 5443 3622<br />
E-mail: suncoast@au.rlb.com<br />
Contact: Mark Brittain<br />
Sydney<br />
Telephone: + 61 2 9922 2277<br />
E-mail: sydney@au.rlb.com<br />
Contact: Bob Richardson<br />
Townsville<br />
Telephone: + 61 7 4771 5718<br />
E-mail: townsville@au.rlb.com<br />
Contact: Chris Marais<br />
Western Sydney<br />
Telephone + 61 2 9806 0044<br />
E-mail: westsyd@au.rlb.com<br />
Contact: Gary Train<br />
New Zealand<br />
Auckland<br />
Telephone: + 64 9 309 1074<br />
E-mail: auckland@nz.rlb.com<br />
Contact: Brian Dackers<br />
Christchurch<br />
Telephone: + 64 3 365 0590<br />
E-mail: christchurch@nz.rlb.com<br />
Contact: Malcolm Timms<br />
Otago<br />
Telephone: + 64 3 409 0325<br />
E-mail: otago@nz.rlb.com<br />
Contact: Chris Haines<br />
Palmerston North<br />
Telephone: + 64 6 357 0326<br />
E-mail: palmerstonnorth@nz.rlb.com<br />
Contact: Wayne Kitching<br />
Tauranga<br />
Telephone: + 64 7 579 5873<br />
E-mail: tauranga@nz.rlb.com<br />
Contact: Richard Gerrish<br />
Wellington<br />
Telephone: + 64 4 384 9198<br />
E-mail: wellington@nz.rlb.com<br />
Contact: Hugh Mackenzie<br />
ASIA<br />
China<br />
Beijing<br />
Telephone: + 86 10 6515 5818<br />
E-mail: beijing@cn.rlb.com<br />
Contact: S. W. Lo<br />
Chengdu<br />
Telephone: + 86 28 8670 3382<br />
E-mail: chengdu@cn.rlb.com<br />
Contact: Stephen Liu<br />
Dalian<br />
Telephone: + 86 411 3973 7778<br />
E-mail: dalian@cn.rlb.com<br />
Contact: S.W.Lo<br />
Guangzhou<br />
Telephone: + 86 20 8732 1801<br />
E-mail: guangzhou@cn.rlb.com<br />
Contact: Kenneth Kwan<br />
Guiyang<br />
Telephone: + 86 851 553 3818<br />
E-mail: guiyang@cn.rlb.com<br />
Contact: K.M.Chau<br />
Hong Kong<br />
Telephone: + 852 2823 1823<br />
E-mail: hongkong@hk.rlb.com<br />
Contact: Philip Lo<br />
Macau<br />
Telephone: + 853 2875 3088<br />
E-mail: macau@mo.rlb.com<br />
Contact: Kenneth Kwan<br />
Sanya<br />
Telephone: + 86 898 8898 7866<br />
E-mail: sanya@cn.rlb.com<br />
Contact: Stephen Lai<br />
Shanghai<br />
Telephone: + 86 21 6330 1999<br />
E-mail: shanghai@cn.rlb.com<br />
Contact: Stephen Lai<br />
Shenyang<br />
Telephone: + 86 24 2396 5516<br />
E-mail: shenyang@cn.rlb.com<br />
Contact: C.H.Chan<br />
Shenzhen<br />
Telephone: + 86 755 8246 0959<br />
E-mail: shenzhen@cn.rlb.com<br />
Contact: Kenneth Kwan<br />
Tianjin<br />
Telephone: + 86 22 2339 6632<br />
E-mail: tianjin@cn.rlb.com<br />
Contact: S.W.Lo<br />
Wuhan<br />
Telephone: + 86 27 6885 0986<br />
E-mail: wuhan@cn.rlb.com<br />
Contact: Stephen Lai<br />
Wuxi<br />
Telephone: + 86 510 8274 0266<br />
E-mail: wuxi@cn.rlb.com<br />
Contact: Stephen Lai<br />
Xian<br />
Telephone: + 86 29 8833 7433<br />
E-mail: xian@cn.rlb.com<br />
Contact: Stephen Liu<br />
Zhuhai<br />
Telephone: + 86 756 388 9010<br />
E-mail: zhuhai@cn.rlb.com<br />
Contact: Kenneth Kwan<br />
Indonesia<br />
Jakarta<br />
Telephone: + 65 6339 1500<br />
E-mail: rlb@sg.rlb.com<br />
Contact: Christopher Leong<br />
Malaysia<br />
Kuala Lumpur<br />
Telephone: + 60 3 2282 8838<br />
E-mail: ymfkl@tm.net.my<br />
Contact: Kang Kian Kiat<br />
Kota Kinabalu<br />
Telephone: + 60 8 821 1626<br />
Contact: Chin Hon Kong<br />
Philippines<br />
Manila<br />
Telephone: + 63 2 634 0535<br />
+ 63 2 634 3124<br />
+ 63 2 667 3579<br />
E-mail: rhl@rhl.com.ph<br />
Contact: Cora Ballard<br />
Singapore<br />
Singapore<br />
Telephone: + 65 6339 1500<br />
E-mail: rlb@sg.rlb.com<br />
Contact: Winston Hauw<br />
South Korea<br />
Seoul<br />
Telephone: + 82 2 582 2834<br />
E-mail: seoul@kr.rlb.com<br />
Contact: Stephen Lai<br />
Thailand<br />
Bangkok<br />
Telephone: + 66 2 234 4933<br />
E-mail: rhlbthai@riderhunt.co.th<br />
Contact: William Lo<br />
Vietnam<br />
Ho Chi Minh City<br />
Telephone: + 84 83 997 3422<br />
E-mail: rlb@vn.rlb.com<br />
Contact: Lam Chye Shing<br />
AMERICAS<br />
Canada<br />
Calgary<br />
Telephone: + 1 403 571 0505<br />
E-mail: YYC@ca.rlb.com<br />
Contact: Cameron Greene<br />
Toronto<br />
Telephone: + 1 416 214 3405<br />
E-mail: YYZ@ca.rlb.com<br />
Contact: Anil Ramjee<br />
Caribbean<br />
Grand Cayman<br />
Telephone: + 1 345 946 6063<br />
E-mail: martyn.bould@ky.rlb.com<br />
Contact: Martyn Bould<br />
USA<br />
Boston<br />
Telephone: + 1 617 737 9339<br />
E-mail: BOS@us.rlb.com<br />
Contact: Grant Owen<br />
Chicago<br />
Telephone: + 1 312 558 3106<br />
E-mail: ORD@us.rlb.com<br />
Contact: Barbara McGill<br />
Denver<br />
Telephone: + 1 720 904 1480<br />
E-mail: DEN@us.rlb.com<br />
Contact: Peter Knowles<br />
Honolulu<br />
Telephone: + 1 808 521 2641<br />
E-mail: HNL@us.rlb.com<br />
Contact: Tony Smith / Paul Brussow /<br />
Maelyn Uyehara<br />
Kona<br />
London<br />
Telephone: + 1 808 883 3379 Telephone: + 44 207 398 8300<br />
E-mail: KOA@us.rlb.com E-mail: london@uk.rlb.com<br />
Contact: Kevin Mitchell Contact: Tony Catchpole<br />
Las Vegas<br />
Manchester<br />
Telephone: + 1 702 227 8818 Telephone: + 44 161 868 7700<br />
E-mail: LAS@us.rlb.com E-mail: manchester@uk.rlb.com<br />
Contact: Andrew Field Contact: Phil Higham<br />
Los Angeles<br />
Newcastle Upon Tyne<br />
Telephone: + 1 213 689 1103 Telephone: + 44 870 770 9830<br />
E-mail: LAX@us.rlb.com E-mail: newcastle@uk.rlb.com<br />
Contact: Gus Oppermann Contact: Dean Sheehy<br />
New York<br />
Sheffield<br />
Telephone: + 1 212 952 1300 Telephone: + 44 114 289 5000<br />
E-mail: LGA@us.rlb.com E-mail: sheffield@uk.rlb.com<br />
Contact: Jay Weisberg Contact: Dean Sheehy<br />
Phoenix<br />
Warton<br />
Telephone: + 1 602 443 4848 Telephone: + 44 177 285 6801<br />
E-mail: PHX@us.rlb.com E-mail: warton@uk.rlb.com<br />
Contact: Julian Anderson / Contact: Steve Aikman<br />
Scott Macpherson Welwyn Garden City<br />
Portland<br />
Telephone: + 44 170 787 1506<br />
Telephone: + 1 503 226 2730 E-mail: welwyn@uk.rlb.com<br />
E-mail: PDX@us.rlb.com Contact: Andrew Reynolds<br />
Contact: Graham Roy<br />
Wokingham<br />
San Francisco<br />
Telephone: + 44 118 974 3600<br />
Telephone: + 1 415 362 2613 E-mail: wokingham@uk.rlb.com<br />
E-mail: SFO@us.rlb.com Contact: Simon Kerton<br />
Contact: Gus Oppermann EUROPE<br />
Seattle<br />
RLB EuroAlliance<br />
Telephone: + 1 206 223 2055<br />
Contact: Mike Staples<br />
E-mail: SEA@us.rlb.com<br />
Telephone: +44 7774 667177<br />
Contact: Simon Squire<br />
E-mail: mike.staples@uk.rlb.com<br />
Washington DC<br />
Telephone: + 1 202 654 1729<br />
E-mail: DCA@us.rlb.com<br />
Contact: Robert Giles<br />
EMEA<br />
MIDDLE EAST<br />
Abu Dhabi<br />
Telephone: + 97 1 2676 6172<br />
E-mail: silas.loh@sg.rlb.com<br />
Contact: Silas Loh<br />
Dubai<br />
Telephone: + 97 1 4801 9100<br />
E-mail: dubai@ae.rlb.com<br />
Contact: Ken Barlow<br />
Muscat<br />
Telephone: + 968 2449 9676<br />
E-mail: stephan.lai@hk.rlb.com<br />
Contact: Stephen Lai<br />
UK<br />
Birchwood, Warrington<br />
Telephone: + 44 777 198 6099<br />
E-mail: deryck.barton@uk.rlb.com<br />
Contact: Deryck Barton<br />
Birmingham<br />
Telephone: + 44 121 503 1500<br />
E-mail: birmingham@uk.rlb.com<br />
Contact: Mark Weaver<br />
Bristol<br />
Telephone: + 44 117 974 1122<br />
E-mail: bristol@uk.rlb.com<br />
Contact: Mark Williamson<br />
Edinburgh<br />
Telephone: + 44 131 554 3300<br />
E-mail: edinburgh@uk.rlb.com<br />
Contact: Peter Docherty<br />
Liverpool<br />
Telephone: + 44 151 225 0264<br />
E-mail: liverpool@uk.rlb.com<br />
Contact: Phil Higham<br />
23<br />
INTERNATIONAL CONSTRUCTION COST COMMENTARY: January 2009
Global Tender Price Index<br />
Comparison<br />
LONDON 151<br />
YEAR TPI (%) CPI (%) NATIONAL<br />
2004 4.0% 1.3%<br />
2005 4.5% 2.0%<br />
2006 5.0% 2.3%<br />
2007 6.0% 2.5%<br />
2008 (P) 4.0% 2.1%<br />
2009 (F) -4.0% 2.0%<br />
2010 (F) -0.5% 2.0%<br />
NEW YORK 154<br />
YEAR TPI (%) CPI (%) NATIONAL<br />
2004 8.6% 2.7%<br />
2005 8.1% 3.4%<br />
2006 9.5% 3.2%<br />
2007 9.0% 2.9%<br />
2008 (P) 4.0% 2.0%<br />
2009 (F) 2.0% 1.8%<br />
2010 (F) 3.0% 1.7%<br />
BEIJING 78<br />
YEAR TPI (%) CPI (%) NATIONAL<br />
2004 -1.5% 3.9%<br />
2005 2.0% 1.8%<br />
2006 3.0% 1.5%<br />
2007 9.0% 4.8%<br />
2008 (P) 5.0% 5.0%<br />
2009 (F) 0.0% 2.0%<br />
2010 (F) 2.0% 2.0%<br />
HONG KONG 107<br />
YEAR TPI (%) CPI (%) NATIONAL<br />
2004 1.0% -0.4%<br />
2005 5.0% 1.0%<br />
2006 10.0% 2.0%<br />
2007 13.0% 2.0%<br />
2008 (P) 8.0% 3.0%<br />
2009 (F) -6.0% 0.0%<br />
2010 (F) 0.0% 2.0%<br />
SINGAPORE 112<br />
YEAR TPI (%) CPI (%) NATIONAL<br />
2004 2.3% 1.7%<br />
2005 3.4% 0.5%<br />
2006 3.3% 1.0%<br />
2007 26.3% 2.1%<br />
2008 (P) 15.0% 6.0%<br />
2009 (F) -10.0% 1.5%<br />
2010 (F) N/A N/A<br />
DUBAI 110<br />
YEAR TPI (%) CPI (%) NATIONAL<br />
2004 12.0% 5.0%<br />
2005 15.0% 7.9%<br />
2006 20.0% 9.3%<br />
2007 18.0% 11.0%<br />
2008 (P) 15.0% 12.9%<br />
2009 (F) 7.0% 10.8%<br />
SYDNEY 109<br />
YEAR TPI (%) CPI (%) NATIONAL<br />
2004 7.0% 2.6%<br />
2005 4.5% 2.8%<br />
2006 4.5% 2.9%<br />
2007 3.5% 3.0%<br />
2008 (P) 4.5% 4.6%<br />
2009 (F) 3.0% 3.3%<br />
2010 (F) 4.0% 2.4%<br />
AUCKLAND 98<br />
YEAR TPI (%) CPI (%) NATIONAL<br />
2004 10.0% 2.7%<br />
2005 5.0% 3.2%<br />
2006 4.0% 2.6%<br />
2007 1.0% 3.2%<br />
2008 (P) 1.0% 4.0%<br />
2009 (F) 2.0% 2.3%<br />
2010 (F) 3.0% 2.1%<br />
KEY<br />
CPI = Consumer Price Index<br />
TPI = Tender Price Index<br />
N/A = Not Available<br />
F = Forecast<br />
P = Provisional<br />
24<br />
INTERNATIONAL CONSTRUCTION COST COMMENTARY: January 2009