View - Sandra Kalil Bussadori
View - Sandra Kalil Bussadori
View - Sandra Kalil Bussadori

Create successful ePaper yourself
Turn your PDF publications into a flip-book with our unique Google optimized e-Paper software.
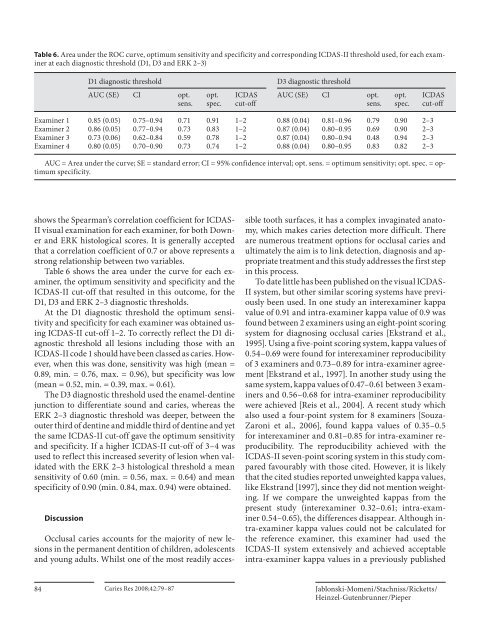
Table 6. Area under the ROC curve, optimum sensitivity and specificity and corresponding ICDAS-II threshold used, for each examiner<br />
at each diagnostic threshold (D1, D3 and ERK 2–3)<br />
D1 diagnostic threshold<br />
AUC (SE) CI opt.<br />
sens.<br />
D3 diagnostic threshold<br />
opt.<br />
spec.<br />
ICDAS<br />
cut-off<br />
AUC (SE) CI opt.<br />
sens.<br />
opt.<br />
spec.<br />
ICDAS<br />
cut-off<br />
Examiner 1 0.85 (0.05) 0.75–0.94 0.71 0.91 1–2 0.88 (0.04) 0.81–0.96 0.79 0.90 2–3<br />
Examiner 2 0.86 (0.05) 0.77–0.94 0.73 0.83 1–2 0.87 (0.04) 0.80–0.95 0.69 0.90 2–3<br />
Examiner 3 0.73 (0.06) 0.62–0.84 0.59 0.78 1–2 0.87 (0.04) 0.80–0.94 0.48 0.94 2–3<br />
Examiner 4 0.80 (0.05) 0.70–0.90 0.73 0.74 1–2 0.88 (0.04) 0.80–0.95 0.83 0.82 2–3<br />
AUC = Area under the curve; SE = standard error; CI = 95% confidence interval; opt. sens. = optimum sensitivity; opt. spec. = optimum<br />
specificity.<br />
shows the Spearman’s correlation coefficient for ICDAS-<br />
II visual examination for each examiner, for both Downer<br />
and ERK histological scores. It is generally accepted<br />
that a correlation coefficient of 0.7 or above represents a<br />
strong relationship between two variables.<br />
Table 6 shows the area under the curve for each examiner,<br />
the optimum sensitivity and specificity and the<br />
ICDAS-II cut-off that resulted in this outcome, for the<br />
D1, D3 and ERK 2–3 diagnostic thresholds.<br />
At the D1 diagnostic threshold the optimum sensitivity<br />
and specificity for each examiner was obtained using<br />
ICDAS-II cut-off 1–2. To correctly reflect the D1 diagnostic<br />
threshold all lesions including those with an<br />
ICDAS-II code 1 should have been classed as caries. However,<br />
when this was done, sensitivity was high (mean =<br />
0.89, min. = 0.76, max. = 0.96), but specificity was low<br />
(mean = 0.52, min. = 0.39, max. = 0.61).<br />
The D3 diagnostic threshold used the enamel-dentine<br />
junction to differentiate sound and caries, whereas the<br />
ERK 2–3 diagnostic threshold was deeper, between the<br />
outer third of dentine and middle third of dentine and yet<br />
the same ICDAS-II cut-off gave the optimum sensitivity<br />
and specificity. If a higher ICDAS-II cut-off of 3–4 was<br />
used to reflect this increased severity of lesion when validated<br />
with the ERK 2–3 histological threshold a mean<br />
sensitivity of 0.60 (min. = 0.56, max. = 0.64) and mean<br />
specificity of 0.90 (min. 0.84, max. 0.94) were obtained.<br />
Discussion<br />
Occlusal caries accounts for the majority of new lesions<br />
in the permanent dentition of children, adolescents<br />
and young adults. Whilst one of the most readily accessible<br />
tooth surfaces, it has a complex invaginated anatomy,<br />
which makes caries detection more difficult. There<br />
are numerous treatment options for occlusal caries and<br />
ultimately the aim is to link detection, diagnosis and appropriate<br />
treatment and this study addresses the first step<br />
in this process.<br />
To date little has been published on the visual ICDAS-<br />
II system, but other similar scoring systems have previously<br />
been used. In one study an interexaminer kappa<br />
value of 0.91 and intra-examiner kappa value of 0.9 was<br />
found between 2 examiners using an eight-point scoring<br />
system for diagnosing occlusal caries [Ekstrand et al.,<br />
1995]. Using a five-point scoring system, kappa values of<br />
0.54–0.69 were found for interexaminer reproducibility<br />
of 3 examiners and 0.73–0.89 for intra-examiner agreement<br />
[Ekstrand et al., 1997]. In another study using the<br />
same system, kappa values of 0.47–0.61 between 3 examiners<br />
and 0.56–0.68 for intra-examiner reproducibility<br />
were achieved [Reis et al., 2004]. A recent study which<br />
also used a four-point system for 8 examiners [Souza-<br />
Zaroni et al., 2006], found kappa values of 0.35–0.5<br />
for interexaminer and 0.81–0.85 for intra-examiner reproducibility.<br />
The reproducibility achieved with the<br />
ICDAS-II seven-point scoring system in this study compared<br />
favourably with those cited. However, it is likely<br />
that the cited studies reported unweighted kappa values,<br />
like Ekstrand [1997], since they did not mention weighting.<br />
If we compare the unweighted kappas from the<br />
present study (interexaminer 0.32–0.61; intra-examiner<br />
0.54–0.65), the differences disappear. Although intra-examiner<br />
kappa values could not be calculated for<br />
the reference examiner, this examiner had used the<br />
ICDAS-II system extensively and achieved acceptable<br />
intra-examiner kappa values in a previously published<br />
84<br />
Caries Res 2008;42:79–87<br />
Jablonski-Momeni /Stachniss /Ricketts /<br />
Heinzel-Gutenbrunner /Pieper