View - Sandra Kalil Bussadori
View - Sandra Kalil Bussadori
View - Sandra Kalil Bussadori

Create successful ePaper yourself
Turn your PDF publications into a flip-book with our unique Google optimized e-Paper software.
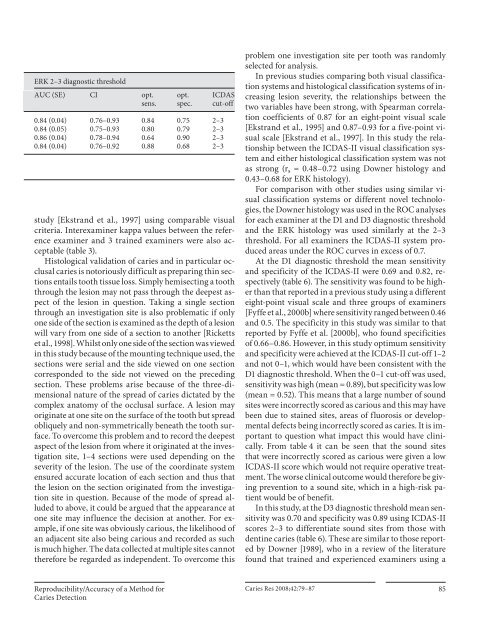
ERK 2–3 diagnostic threshold<br />
AUC (SE) CI opt.<br />
sens.<br />
opt.<br />
spec.<br />
ICDAS<br />
cut-off<br />
0.84 (0.04) 0.76–0.93 0.84 0.75 2–3<br />
0.84 (0.05) 0.75–0.93 0.80 0.79 2–3<br />
0.86 (0.04) 0.78–0.94 0.64 0.90 2–3<br />
0.84 (0.04) 0.76–0.92 0.88 0.68 2–3<br />
study [Ekstrand et al., 1997] using comparable visual<br />
criteria. Interexaminer kappa values between the reference<br />
examiner and 3 trained examiners were also acceptable<br />
( table 3 ).<br />
Histological validation of caries and in particular occlusal<br />
caries is notoriously difficult as preparing thin sections<br />
entails tooth tissue loss. Simply hemisecting a tooth<br />
through the lesion may not pass through the deepest aspect<br />
of the lesion in question. Taking a single section<br />
through an investigation site is also problematic if only<br />
one side of the section is examined as the depth of a lesion<br />
will vary from one side of a section to another [Ricketts<br />
et al., 1998]. Whilst only one side of the section was viewed<br />
in this study because of the mounting technique used, the<br />
sections were serial and the side viewed on one section<br />
corresponded to the side not viewed on the preceding<br />
section. These problems arise because of the three-dimensional<br />
nature of the spread of caries dictated by the<br />
complex anatomy of the occlusal surface. A lesion may<br />
originate at one site on the surface of the tooth but spread<br />
obliquely and non-symmetrically beneath the tooth surface.<br />
To overcome this problem and to record the deepest<br />
aspect of the lesion from where it originated at the investigation<br />
site, 1–4 sections were used depending on the<br />
severity of the lesion. The use of the coordinate system<br />
ensured accurate location of each section and thus that<br />
the lesion on the section originated from the investigation<br />
site in question. Because of the mode of spread alluded<br />
to above, it could be argued that the appearance at<br />
one site may influence the decision at another. For example,<br />
if one site was obviously carious, the likelihood of<br />
an adjacent site also being carious and recorded as such<br />
is much higher. The data collected at multiple sites cannot<br />
therefore be regarded as independent. To overcome this<br />
problem one investigation site per tooth was randomly<br />
selected for analysis.<br />
In previous studies comparing both visual classification<br />
systems and histological classification systems of increasing<br />
lesion severity, the relationships between the<br />
two variables have been strong, with Spearman correlation<br />
coefficients of 0.87 for an eight-point visual scale<br />
[Ekstrand et al., 1995] and 0.87–0.93 for a five-point visual<br />
scale [Ekstrand et al., 1997]. In this study the relationship<br />
between the ICDAS-II visual classification system<br />
and either histological classification system was not<br />
as strong (r s = 0.48–0.72 using Downer histology and<br />
0.43–0.68 for ERK histology).<br />
For comparison with other studies using similar visual<br />
classification systems or different novel technologies,<br />
the Downer histology was used in the ROC analyses<br />
for each examiner at the D1 and D3 diagnostic threshold<br />
and the ERK histology was used similarly at the 2–3<br />
threshold. For all examiners the ICDAS-II system produced<br />
areas under the ROC curves in excess of 0.7.<br />
At the D1 diagnostic threshold the mean sensitivity<br />
and specificity of the ICDAS-II were 0.69 and 0.82, respectively<br />
( table 6 ). The sensitivity was found to be higher<br />
than that reported in a previous study using a different<br />
eight-point visual scale and three groups of examiners<br />
[Fyffe et al., 2000b] where sensitivity ranged between 0.46<br />
and 0.5. The specificity in this study was similar to that<br />
reported by Fyffe et al. [2000b], who found specificities<br />
of 0.66–0.86. However, in this study optimum sensitivity<br />
and specificity were achieved at the ICDAS-II cut-off 1–2<br />
and not 0–1, which would have been consistent with the<br />
D1 diagnostic threshold. When the 0–1 cut-off was used,<br />
sensitivity was high (mean = 0.89), but specificity was low<br />
(mean = 0.52). This means that a large number of sound<br />
sites were incorrectly scored as carious and this may have<br />
been due to stained sites, areas of fluorosis or developmental<br />
defects being incorrectly scored as caries. It is important<br />
to question what impact this would have clinically.<br />
From table 4 it can be seen that the sound sites<br />
that were incorrectly scored as carious were given a low<br />
ICDAS-II score which would not require operative treatment.<br />
The worse clinical outcome would therefore be giving<br />
prevention to a sound site, which in a high-risk patient<br />
would be of benefit.<br />
In this study, at the D3 diagnostic threshold mean sensitivity<br />
was 0.70 and specificity was 0.89 using ICDAS-II<br />
scores 2–3 to differentiate sound sites from those with<br />
dentine caries ( table 6 ). These are similar to those reported<br />
by Downer [1989], who in a review of the literature<br />
found that trained and experienced examiners using a<br />
Reproducibility/Accuracy of a Method for<br />
Caries Detection<br />
Caries Res 2008;42:79–87 85