<strong>Lake</strong> <strong>County</strong> Revenues by Fund and Category 3 Year History Fund Fund Description Category 2011 Actual <strong>County</strong> Board <strong>Approved</strong> 2012 2012 Modified <strong>Budget</strong> <strong>County</strong> Board <strong>Approved</strong> <strong>2013</strong> Governmental Funds Capital Project Funds 400 2008 Bond Construction Projects 48 - Miscellaneous 142 0 0 0 Total 400 142 0 0 0 403 2010A Bond Road Construction Projects 48 - Miscellaneous 31,616,095 92,000 92,000 82,790 Total 403 31,616,095 92,000 92,000 82,790 404 2011A Bond Road Construction Projects 48 - Miscellaneous 21,834,060 52,200 52,000 37,345 Total 404 21,834,060 52,200 52,000 37,345 Total Capital Project Funds 53,450,297 144,200 144,200 120,135 Debt Service Funds 300 2008 GO Bonds 49 - Transfers 2,750,582 2,761,681 2,761,681 2,781,994 Total 300 2,750,582 2,761,681 2,761,681 2,781,994 303 2010A Taxable GO Bonds 45 - Intergovernmental 641,197 669,100 669,100 669,100 48 - Miscellaneous 0 700 700 0 49 - Transfers 1,526,753 925,100 925,100 925,100 2,167,950 1,594,900 1,594,900 1,594,200 304 2011A GO Bonds 48 - Miscellaneous 0 700 700 0 49 - Transfers 495,000 962,200 962,200 962,200 495,000 962,900 962,900 962,200 315 2005 GO Refunding Bonds 49 - Transfers 482,917 481,520 481,520 485,330 Total 315 482,917 481,520 481,520 485,330 Total Debt Service Funds 5,896,449 5,801,001 5,801,001 5,823,724 Proprietary Funds Internal Service Funds 510 Health, Life & Dental Insurance 48 - Miscellaneous 41,052,859 43,579,506 43,579,506 44,809,705 Total 510 41,052,859 43,579,506 43,579,506 44,809,705 Total Internal Service Funds 41,052,859 43,579,506 43,579,506 44,809,705 Enterprise Funds 610 Public Works 411 Property tax 859,567 724,381 724,381 677,060 44 - Rentals 161,685 159,800 159,800 173,445 45 - Intergovernmental 660,162 344,300 344,300 368,700 46/7 - Charges for Services 38,275,553 40,843,315 40,843,315 39,050,185 48 - Miscellaneous 1,696,398 3,685,600 3,685,600 408,200 Total 610 41,653,365 45,757,396 45,757,396 40,677,590 Total Enterprise Service Funds 41,653,365 45,757,396 45,757,396 40,677,590 Special Service Areas Special Service Areas 272 Special Service Area #8 Loon <strong>Lake</strong> 411 Property tax 49,916 50,000 50,000 50,000 48 - Miscellaneous 191 292 292 59 Total 272 50,107 50,292 50,292 50,059 276 Special Service Area #12 The Woods of 411 Property tax 21,500 21,500 21,500 21,500 Ivanhoe 48 - Miscellaneous 69 87 87 46 Total 276 21,569 21,587 21,587 21,546 340 Special Svc Area #10 North Hills 411 Property tax 71,939 71,481 71,481 71,481 48 - Miscellaneous 72 195 195 56 Total 340 72,012 71,676 71,676 71,537 350 Special Service Area #13 Tax Exempt 411 Property tax 127,015 128,000 128,000 128,000 2007A Spencer Highlands, Elmcrest 48 - Miscellaneous 239 389 389 155 Total 350 127,254 128,389 128,389 128,155 352 Special Service Area #13 Taxable 2007B 411 Property tax 130,985 132,000 132,000 132,000 Spencer Highlands, Elmcrest 48 - Miscellaneous 66 0 0 0 Total 352 131,051 132,000 132,000 132,000 Total Special Service Areas 401,992 403,944 403,944 403,297 Total All Funds 540,302,442 478,851,770 504,861,232 479,647,918 21
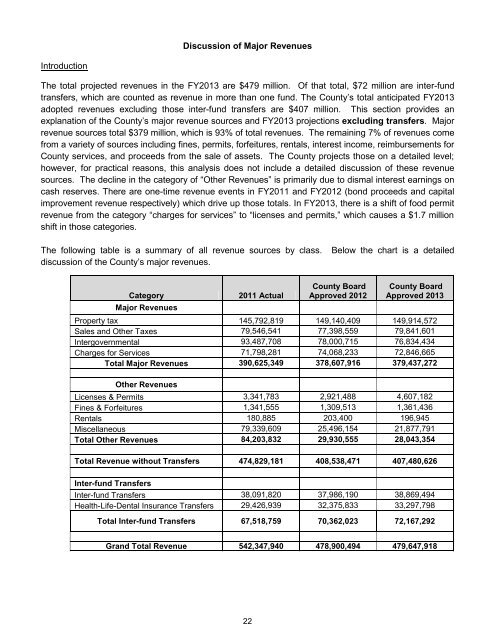
Discussion of Major Revenues Introduction The total projected revenues in the FY<strong>2013</strong> are $479 million. Of that total, $72 million are inter-fund transfers, which are counted as revenue in more than one fund. The <strong>County</strong>’s total anticipated FY<strong>2013</strong> adopted revenues excluding those inter-fund transfers are $407 million. This section provides an explanation of the <strong>County</strong>’s major revenue sources and FY<strong>2013</strong> projections excluding transfers. Major revenue sources total $379 million, which is 93% of total revenues. The remaining 7% of revenues come from a variety of sources including fines, permits, forfeitures, rentals, interest income, reimbursements for <strong>County</strong> services, and proceeds from the sale of assets. The <strong>County</strong> projects those on a detailed level; however, for practical reasons, this analysis does not include a detailed discussion of these revenue sources. The decline in the category of “Other Revenues” is primarily due to dismal interest earnings on cash reserves. There are one-time revenue events in FY2011 and FY2012 (bond proceeds and capital improvement revenue respectively) which drive up those totals. In FY<strong>2013</strong>, there is a shift of food permit revenue from the category “charges for services” to “licenses and permits,” which causes a $1.7 million shift in those categories. The following table is a summary of all revenue sources by class. discussion of the <strong>County</strong>’s major revenues. Below the chart is a detailed Category Major Revenues 2011 Actual <strong>County</strong> Board <strong>Approved</strong> 2012 <strong>County</strong> Board <strong>Approved</strong> <strong>2013</strong> Property tax 145,792,819 149,140,409 149,914,572 Sales and Other Taxes 79,546,541 77,398,559 79,841,601 Intergovernmental 93,487,708 78,000,715 76,834,434 Charges for Services 71,798,281 74,068,233 72,846,665 Total Major Revenues 390,625,349 378,607,916 379,437,272 Other Revenues Licenses & Permits 3,341,783 2,921,488 4,607,182 Fines & Forfeitures 1,341,555 1,309,513 1,361,436 Rentals 180,885 203,400 196,945 Miscellaneous 79,339,609 25,496,154 21,877,791 Total Other Revenues 84,203,832 29,930,555 28,043,354 Total Revenue without Transfers 474,829,181 408,538,471 407,480,626 Inter-fund Transfers Inter-fund Transfers 38,091,820 37,986,190 38,869,494 Health-Life-Dental Insurance Transfers 29,426,939 32,375,833 33,297,798 Total Inter-fund Transfers 67,518,759 70,362,023 72,167,292 Grand Total Revenue 542,347,940 478,900,494 479,647,918 22
- Page 1: APPROVED 2013 ANNUAL BUDGET LAKE CO
- Page 4 and 5: Transmittal Letter 2013 Approved Bu
- Page 6 and 7: The County continues to be challeng
- Page 8 and 9: Debt Service There was no new debt
- Page 10 and 11: Budget Process Lake County operates
- Page 12 and 13: Budget Document This budget documen
- Page 14 and 15: Property Values The County’s equa
- Page 16 and 17: Budgeting Practices The County’s
- Page 18 and 19: Staffing changes - Personnel costs
- Page 20 and 21: FY 2013 Approved Budget without Dou
- Page 22 and 23: LAKE COUNTY FISCAL YEAR 2013 BUDGET
- Page 24 and 25: Lake County Revenues by Fund and Ca
- Page 28 and 29: Property Taxes Property taxes suppo
- Page 30 and 31: 2009 LAKE COUNTY Property Tax 5 Yea
- Page 32 and 33: Income Tax The County’s share of
- Page 34 and 35: Intergovernmental Revenue The Count
- Page 36 and 37: Lake County Expenses by Fund and Ca
- Page 38: Lake County Expenses by Fund and Ca
- Page 41 and 42: Full Time Part Time DEPARTMENT 2013
- Page 43 and 44: New Program/Personnel/Refunding Req
- Page 45 and 46: Fiscal Year 2013 Requests Requestin
- Page 47 and 48: Capital Improvement Program Program
- Page 49 and 50: CCIP Definition The Corporate Capit
- Page 51 and 52: 3. Cost analysis of project based u
- Page 53 and 54: Corporate Capital Improvement Progr
- Page 55 and 56: Capital Improvement Program Rehabil
- Page 57 and 58: Capital Improvement Program Rehab/A
- Page 59 and 60: Capital Improvement Program Departm
- Page 61 and 62: Capital Improvement Program Operati
- Page 63 and 64: Capital Improvement Program Operati
- Page 65 and 66: Capital Improvement Program Initiat
- Page 67 and 68: Capital Improvement Program Initiat
- Page 69 and 70: Capital Improvement Program Major C
- Page 71 and 72: Capital Improvement Program Major C
- Page 73 and 74: Capital Improvement Program Strateg
- Page 75 and 76: Budget Process and Policies 2013 Ap
- Page 77 and 78:
LAKE COUNTY BUDGET CALENDAR - FISCA
- Page 79 and 80:
Fund and Department Structure The C
- Page 81 and 82:
The Motor Fuel Tax Fund, which is n
- Page 83 and 84:
FY2013 BUDGET POLICIES FY2013 BUDGE
- Page 85 and 86:
concurrent with the annual budget d
- Page 87 and 88:
eductions or new revenue increases
- Page 89 and 90:
5. Indirect Costs When a fund or de
- Page 91 and 92:
Corporate Fund 2013 Approved Budget
- Page 93 and 94:
FY 2013 Budget Overview Department
- Page 95 and 96:
Lake County Revenue Budget Comparis
- Page 97 and 98:
FY 2013 Budget Overview Circuit Cou
- Page 99 and 100:
Lake County Expense Budget Comparis
- Page 101 and 102:
110% 100% 90% 80% 70% 60% 50% 40% 3
- Page 103 and 104:
Lake County Expense Budget Comparis
- Page 105 and 106:
FY 2013 Budget Overview Department
- Page 107 and 108:
Lake County Revenue Budget Comparis
- Page 109 and 110:
FY 2013 Budget Overview Corporate C
- Page 111 and 112:
Lake County Expense Budget Comparis
- Page 113 and 114:
200 County Administrator's Office C
- Page 115 and 116:
Lake County Revenue Budget Comparis
- Page 117 and 118:
Lake County Expense Budget Comparis
- Page 119 and 120:
Lake County Revenue Budget Comparis
- Page 121 and 122:
FY 2013 Budget Overview Department
- Page 123 and 124:
Lake County Expense Budget Comparis
- Page 125 and 126:
1.00 0.90 0.80 0.70 0.60 0.50 0.40
- Page 127 and 128:
Lake County Expense Budget Comparis
- Page 129 and 130:
FY 2013 Budget Overview General Ope
- Page 131 and 132:
Lake County Expense Budget Comparis
- Page 133 and 134:
FY 2013 Budget Overview Department
- Page 135 and 136:
Lake County Revenue Budget Comparis
- Page 137 and 138:
FY 2013 Budget Overview Information
- Page 139 and 140:
Lake County Revenue Budget Comparis
- Page 141 and 142:
FY 2013 Budget Overview Department
- Page 143 and 144:
Lake County Revenue Budget Comparis
- Page 145 and 146:
Lake County Expense Budget Comparis
- Page 147 and 148:
70 60 50 40 30 20 10 0 Public Defen
- Page 149 and 150:
Lake County Expense Budget Comparis
- Page 151 and 152:
Recorder of Deeds Documents Recorde
- Page 153 and 154:
Lake County Expense Budget Comparis
- Page 155 and 156:
Regional Office of Education Certif
- Page 157 and 158:
Lake County Expense Budget Comparis
- Page 159 and 160:
Lake County Revenue Budget Comparis
- Page 161 and 162:
Lake County Expense Budget Comparis
- Page 163 and 164:
Lake County Revenue Budget Comparis
- Page 165 and 166:
FY 2013 Budget Overview Department
- Page 167 and 168:
Lake County Revenue Budget Comparis
- Page 169 and 170:
Lake County Expense Budget Comparis
- Page 171 and 172:
Lake County Treasurer $1,600,000.00
- Page 173 and 174:
Lake County Expense Budget Comparis
- Page 175 and 176:
FY 2013 Budget Overview Department
- Page 177 and 178:
Lake County Expense Budget Comparis
- Page 179 and 180:
Division of Transportation Annual C
- Page 181 and 182:
Lake County Expense Budget Comparis
- Page 183 and 184:
FY 2013 Budget Overview Department
- Page 185 and 186:
Lake County Expense Budget Comparis
- Page 187 and 188:
Lake County Revenue Budget Comparis
- Page 189 and 190:
Lake County Expense Budget Comparis
- Page 191 and 192:
Lake County Expense Budget Comparis
- Page 193 and 194:
Lake County Revenue Budget Comparis
- Page 195 and 196:
Lake County Expense Budget Comparis
- Page 197 and 198:
Lake County Revenue Budget Comparis
- Page 199 and 200:
FY 2013 Budget Overview Department
- Page 201 and 202:
Lake County Expense Budget Comparis
- Page 203 and 204:
Lake County Revenue Budget Comparis
- Page 205 and 206:
FY 2013 Budget Overview Department
- Page 207 and 208:
Lake County Revenue Budget Comparis
- Page 209 and 210:
FY 2013 Budget Overview TB Clinic D
- Page 211 and 212:
Lake County Expense Budget Comparis
- Page 213 and 214:
FY 2013 Budget Overview Department
- Page 215 and 216:
Lake County Revenue Budget Comparis
- Page 217 and 218:
FY 2013 Budget Overview Department
- Page 219 and 220:
Lake County Expense Budget Comparis
- Page 221 and 222:
Special Revenue Funds 2013 Approved
- Page 223 and 224:
Lake County Revenue Budget Comparis
- Page 225 and 226:
FY 2013 Budget Overview Department
- Page 227 and 228:
Lake County Expense Budget Comparis
- Page 229 and 230:
Lake County Revenue Budget Comparis
- Page 231 and 232:
FY 2013 Budget Overview Document St
- Page 233 and 234:
Lake County Expense Budget Comparis
- Page 235 and 236:
Lake County Revenue Budget Comparis
- Page 237 and 238:
Lake County Revenue Budget Comparis
- Page 239 and 240:
FY 2013 Budget Overview Department
- Page 241 and 242:
Lake County Expense Budget Comparis
- Page 243 and 244:
Lake County Revenue Budget Comparis
- Page 245 and 246:
FY 2013 Budget Overview Department
- Page 247 and 248:
Lake County Expense Budget Comparis
- Page 249 and 250:
Lake County Revenue Budget Comparis
- Page 251 and 252:
FY 2013 Budget Overview Probation S
- Page 253 and 254:
Lake County Expense Budget Comparis
- Page 255 and 256:
Lake County Revenue Budget Comparis
- Page 257 and 258:
FY 2013 Budget Overview Department
- Page 259 and 260:
Lake County Expense Budget Comparis
- Page 261 and 262:
Lake County Revenue Budget Comparis
- Page 263 and 264:
FY 2013 Budget Overview Tax Sale Au
- Page 265 and 266:
Lake County Expense Budget Comparis
- Page 267 and 268:
Lake County Revenue Budget Comparis
- Page 269 and 270:
FY 2013 Budget Overview Department
- Page 271 and 272:
Workforce Development 100% WIA Trai
- Page 273 and 274:
Lake County Expense Budget Comparis
- Page 275 and 276:
Capital Projects 2013 Approved Budg
- Page 277 and 278:
Lake County Revenue Budget Comparis
- Page 279 and 280:
FY 2013 Budget Overview 2010A Bond
- Page 281 and 282:
Lake County Expense Budget Comparis
- Page 283 and 284:
Lake County Revenue 2011A Budget Ta
- Page 285 and 286:
Debt Service Funds 2013 Approved Bu
- Page 287 and 288:
Lake County Revenue Budget Comparis
- Page 289 and 290:
FY 2013 Budget Overview Department
- Page 291 and 292:
Lake County Expense Budget Comparis
- Page 293 and 294:
Lake County Revenue Budget Comparis
- Page 295 and 296:
FY 2013 Budget Overview 2011A Tax E
- Page 297 and 298:
Lake County Expense Budget Comparis
- Page 299 and 300:
FY 2013 Budget Overview Department
- Page 301 and 302:
Lake County Expense Budget Comparis
- Page 303 and 304:
FY 2013 Budget Overview Department
- Page 305 and 306:
Lake County Revenue Budget Comparis
- Page 307 and 308:
Lake County Expense Budget Comparis
- Page 309 and 310:
Special Service Areas 2013 Approved
- Page 311 and 312:
Lake County Revenue Budget Comparis
- Page 313 and 314:
FY 2013 Budget Overview Special Ser
- Page 315 and 316:
Lake County Expense Budget Comparis
- Page 317 and 318:
Lake County Revenue Budget Special
- Page 319 and 320:
FY 2013 Budget Overview Special Ser
- Page 321 and 322:
Lake County Expense Budget Comparis
- Page 323 and 324:
Lake County Revenue Budget Comparis
- Page 325 and 326:
Glossary And Acronyms 2013 Approved
- Page 327 and 328:
Charges for Service: Corporate Capi
- Page 329 and 330:
members are responsible for budget
- Page 331 and 332:
Tuberculosis Clinic Fund: Unfunded