PDF (1265kB) - Philip Morris
PDF (1265kB) - Philip Morris
PDF (1265kB) - Philip Morris

You also want an ePaper? Increase the reach of your titles
YUMPU automatically turns print PDFs into web optimized ePapers that Google loves.
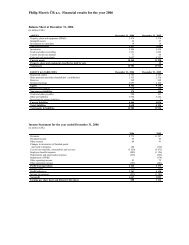
ANNUAL REPORT 2005 | CONSOLIDATED FINANCIAL RESULTS<br />
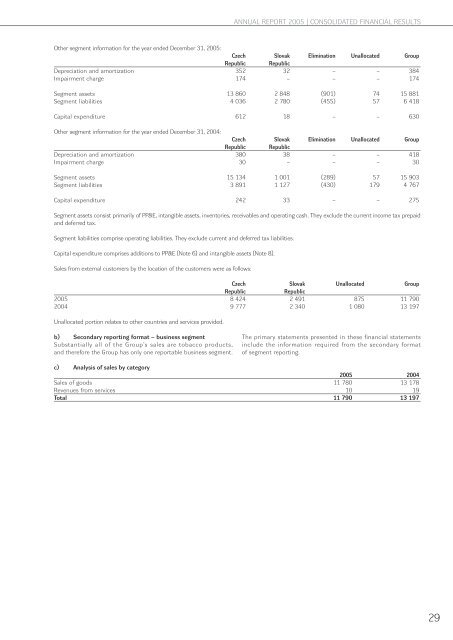
Other segment information for the year ended December 31, 2005:<br />
Czech Slovak Elimination Unallocated Group<br />
Republic Republic<br />
Depreciation and amortization 352 32 – – 384<br />
Impairment charge 174 – – – 174<br />
Segment assets 13 860 2 848 (901) 74 15 881<br />
Segment liabilities 4 036 2 780 (455) 57 6 418<br />
Capital expenditure 612 18 – – 630<br />
Other segment information for the year ended December 31, 2004:<br />
Czech Slovak Elimination Unallocated Group<br />
Republic Republic<br />
Depreciation and amortization 380 38 – – 418<br />
Impairment charge 30 – – – 30<br />
Segment assets 15 134 1 001 (289) 57 15 903<br />
Segment liabilities 3 891 1 127 (430) 179 4 767<br />
Capital expenditure 242 33 – – 275<br />
Segment assets consist primarily of PP&E, intangible assets, inventories, receivables and operating cash. They exclude the current income tax prepaid<br />
and deferred tax.<br />
Segment liabilities comprise operating liabilities. They exclude current and deferred tax liabilities.<br />
Capital expenditure comprises additions to PP&E (Note 6) and intangible assets (Note 8).<br />
Sales from external customers by the location of the customers were as follows:<br />
Czech Slovak Unallocated Group<br />
Republic<br />
Republic<br />
2005 8 424 2 491 875 11 790<br />
2004 9 777 2 340 1 080 13 197<br />
Unallocated portion relates to other countries and services provided.<br />
b) Secondary reporting format – business segment<br />
Substantially all of the Group’s sales are tobacco products,<br />
and therefore the Group has only one reportable business segment.<br />
The primary statements presented in these financial statements<br />
include the information required from the secondary format<br />
of segment reporting.<br />
c) Analysis of sales by category<br />
2005 2004<br />
Sales of goods 11 780 13 178<br />
Revenues from services 10 19<br />
Total 11 790 13 197<br />
29