
You also want an ePaper? Increase the reach of your titles
YUMPU automatically turns print PDFs into web optimized ePapers that Google loves.
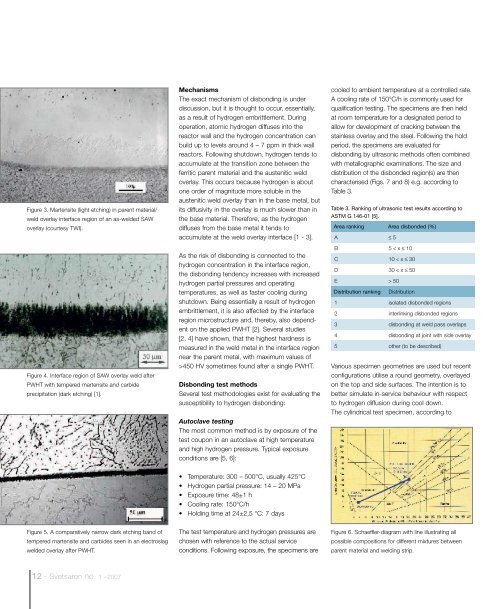
Figure 3. Martensite (light etching) in parent material/<br />
weld overlay interface region of an as-welded SAW<br />
overlay (courtesy TWI).<br />
Figure 4. Interface region of SAW overlay weld after<br />
PWHT with tempered martensite and carbide<br />
precipitation (dark etching) [1].<br />
Mechanisms<br />
The exact mechanism of disbonding is under<br />
discussion, but it is thought to occur, essentially,<br />
as a result of hydrogen embrittlement. During<br />
operation, atomic hydrogen diffuses into the<br />
reactor wall and the hydrogen concentration can<br />
build up to levels around 4 – 7 ppm in thick wall<br />
reactors. Following shutdown, hydrogen tends to<br />
accumulate at the transition zone between the<br />
ferritic parent material and the austenitic weld<br />
overlay. This occurs because hydrogen is about<br />
one order of magnitude more soluble in the<br />
austenitic weld overlay than in the base metal, but<br />
its diffusivity in the overlay is much slower than in<br />
the base material. Therefore, as the hydrogen<br />
diffuses from the base metal it tends to<br />
accumulate at the weld overlay interface [1 - 3].<br />
As the risk of disbonding is connected to the<br />
hydrogen concentration in the interface region,<br />
the disbonding tendency increases with increased<br />
hydrogen partial pressures and operating<br />
temperatures, as well as faster cooling during<br />
shutdown. Being essentially a result of hydrogen<br />
embrittlement, it is also affected by the interface<br />
region microstructure and, thereby, also dependent<br />
on the applied PWHT [2]. Several studies<br />
[2, 4] have shown, that the highest hardness is<br />
measured in the weld metal in the interface region<br />
near the parent metal, with maximum values of<br />
>450 HV sometimes found after a single PWHT.<br />
Disbonding test methods<br />
Several test methodologies exist for evaluating the<br />
susceptibility to hydrogen disbonding:<br />
Autoclave testing<br />
The most common method is by exposure of the<br />
test coupon in an autoclave at high temperature<br />
and high hydrogen pressure. Typical exposure<br />
conditions are [5, 6]:<br />
cooled to ambient temperature at a controlled rate.<br />
A cooling rate of 150°C/h is commonly used for<br />
qualification testing. The specimens are then held<br />
at room temperature for a designated period to<br />
allow for development of cracking between the<br />
stainless overlay and the steel. Following the hold<br />
period, the specimens are evaluated for<br />
disbonding by ultrasonic methods often combined<br />
with metallographic examinations. The size and<br />
distribution of the disbonded region(s) are then<br />
characterised (Figs. 7 and 8) e.g. according to<br />
Table 3.<br />
Table 3. Ranking of ultrasonic test results according to<br />
ASTM G 146-01 [5].<br />
Area ranking Area disbonded (%)<br />
A 5<br />
B 5 x 10<br />
C 10 x 30<br />
D 30 x 50<br />
E 50<br />
Distribution ranking<br />
Distribution<br />
1 isolated disbonded regions<br />
2 interlinking disbonded regions<br />
3 disbonding at weld pass overlaps<br />
4 disbonding at joint with side overlay<br />
5 other (to be described)<br />
Various specimen geometries are used but recent<br />
configurations utilise a round geometry, overlayed<br />
on the top and side surfaces. The intention is to<br />
better simulate in-service behaviour with respect<br />
to hydrogen diffusion during cool down.<br />
The cylindrical test specimen, according to<br />
• Temperature: 300 – 500°C, usually 425°C<br />
• Hydrogen partial pressure: 14 – 20 MPa<br />
• Exposure time: 48±1 h<br />
• Cooling rate: 150°C/h<br />
• Holding time at 24±2,5 °C: 7 days<br />
Figure 5. A comparatively narrow dark etching band of<br />
tempered martensite and carbides seen in an electroslag<br />
welded overlay after PWHT.<br />
The test temperature and hydrogen pressures are<br />
chosen with reference to the actual service<br />
conditions. Following exposure, the specimens are<br />
Figure 6. Schaeffler-diagram with line illustrating all<br />
possible compositions for different mixtures between<br />
parent material and welding strip.<br />
12 - <strong>Svetsaren</strong> no. 1 - <strong>2007</strong>