simulation of a superheterodyne receiver using pspice - School of ...
simulation of a superheterodyne receiver using pspice - School of ...
simulation of a superheterodyne receiver using pspice - School of ...

Create successful ePaper yourself
Turn your PDF publications into a flip-book with our unique Google optimized e-Paper software.
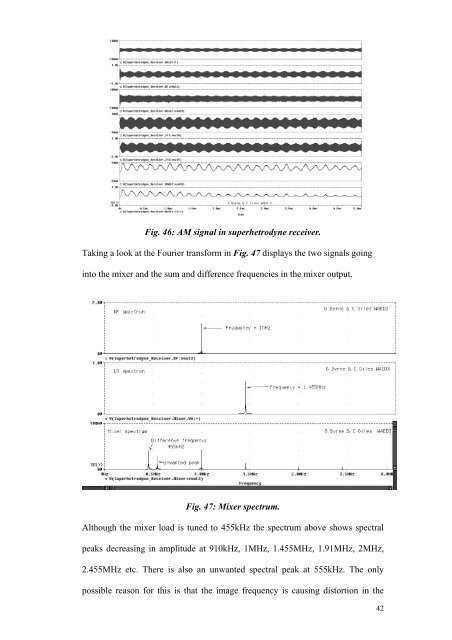
Fig. 46: AM signal in superhetrodyne <strong>receiver</strong>.<br />
Taking a look at the Fourier transform in Fig. 47 displays the two signals going<br />
into the mixer and the sum and difference frequencies in the mixer output.<br />
Fig. 47: Mixer spectrum.<br />
Although the mixer load is tuned to 455kHz the spectrum above shows spectral<br />
peaks decreasing in amplitude at 910kHz, 1MHz, 1.455MHz, 1.91MHz, 2MHz,<br />
2.455MHz etc. There is also an unwanted spectral peak at 555kHz. The only<br />
possible reason for this is that the image frequency is ca<strong>using</strong> distortion in the<br />
42