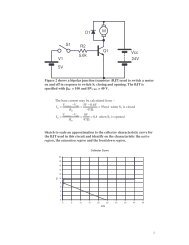
simulation of a superheterodyne receiver using pspice - School of ...
simulation of a superheterodyne receiver using pspice - School of ...
simulation of a superheterodyne receiver using pspice - School of ...

You also want an ePaper? Increase the reach of your titles
YUMPU automatically turns print PDFs into web optimized ePapers that Google loves.
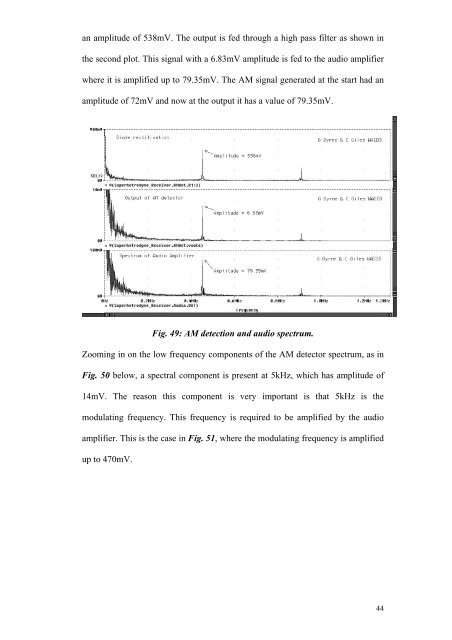
an amplitude <strong>of</strong> 538mV. The output is fed through a high pass filter as shown in<br />
the second plot. This signal with a 6.83mV amplitude is fed to the audio amplifier<br />
where it is amplified up to 79.35mV. The AM signal generated at the start had an<br />
amplitude <strong>of</strong> 72mV and now at the output it has a value <strong>of</strong> 79.35mV.<br />
Fig. 49: AM detection and audio spectrum.<br />
Zooming in on the low frequency components <strong>of</strong> the AM detector spectrum, as in<br />
Fig. 50 below, a spectral component is present at 5kHz, which has amplitude <strong>of</strong><br />
14mV. The reason this component is very important is that 5kHz is the<br />
modulating frequency. This frequency is required to be amplified by the audio<br />
amplifier. This is the case in Fig. 51, where the modulating frequency is amplified<br />
up to 470mV.<br />
44