9700_y16_sy
9700_y16_sy
9700_y16_sy

Create successful ePaper yourself
Turn your PDF publications into a flip-book with our unique Google optimized e-Paper software.
Cambridge International AS and A Level Biology <strong>9700</strong> <strong>sy</strong>llabus Practical assessment<br />
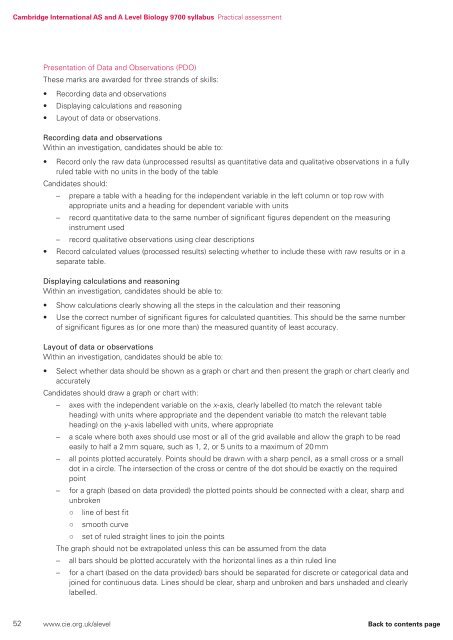
Presentation of Data and Observations (PDO)<br />
These marks are awarded for three strands of skills:<br />
• Recording data and observations<br />
• Displaying calculations and reasoning<br />
• Layout of data or observations.<br />
Recording data and observations<br />
Within an investigation, candidates should be able to:<br />
• Record only the raw data (unprocessed results) as quantitative data and qualitative observations in a fully<br />
ruled table with no units in the body of the table<br />
Candidates should:<br />
– prepare a table with a heading for the independent variable in the left column or top row with<br />
appropriate units and a heading for dependent variable with units<br />
– record quantitative data to the same number of significant figures dependent on the measuring<br />
instrument used<br />
– record qualitative observations using clear descriptions<br />
• Record calculated values (processed results) selecting whether to include these with raw results or in a<br />
separate table.<br />
Displaying calculations and reasoning<br />
Within an investigation, candidates should be able to:<br />
• Show calculations clearly showing all the steps in the calculation and their reasoning<br />
• Use the correct number of significant figures for calculated quantities. This should be the same number<br />
of significant figures as (or one more than) the measured quantity of least accuracy.<br />
Layout of data or observations<br />
Within an investigation, candidates should be able to:<br />
• Select whether data should be shown as a graph or chart and then present the graph or chart clearly and<br />
accurately<br />
Candidates should draw a graph or chart with:<br />
– axes with the independent variable on the x-axis, clearly labelled (to match the relevant table<br />
heading) with units where appropriate and the dependent variable (to match the relevant table<br />
heading) on the y-axis labelled with units, where appropriate<br />
– a scale where both axes should use most or all of the grid available and allow the graph to be read<br />
easily to half a 2 mm square, such as 1, 2, or 5 units to a maximum of 20 mm<br />
– all points plotted accurately. Points should be drawn with a sharp pencil, as a small cross or a small<br />
dot in a circle. The intersection of the cross or centre of the dot should be exactly on the required<br />
point<br />
– for a graph (based on data provided) the plotted points should be connected with a clear, sharp and<br />
unbroken<br />
○ line of best fit<br />
○ smooth curve<br />
○ set of ruled straight lines to join the points<br />
The graph should not be extrapolated unless this can be assumed from the data<br />
– all bars should be plotted accurately with the horizontal lines as a thin ruled line<br />
– for a chart (based on the data provided) bars should be separated for discrete or categorical data and<br />
joined for continuous data. Lines should be clear, sharp and unbroken and bars unshaded and clearly<br />
labelled.<br />
52 www.cie.org.uk/alevel Back to contents page