9700_y16_sy
9700_y16_sy
9700_y16_sy

You also want an ePaper? Increase the reach of your titles
YUMPU automatically turns print PDFs into web optimized ePapers that Google loves.
Cambridge International AS and A Level Biology <strong>9700</strong> <strong>sy</strong>llabus Practical assessment<br />
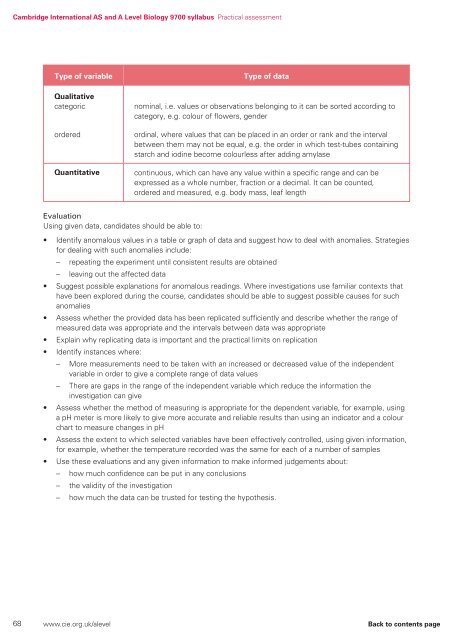
Type of variable<br />
Qualitative<br />
categoric<br />
ordered<br />
Quantitative<br />
Type of data<br />
nominal, i.e. values or observations belonging to it can be sorted according to<br />
category, e.g. colour of flowers, gender<br />
ordinal, where values that can be placed in an order or rank and the interval<br />
between them may not be equal, e.g. the order in which test-tubes containing<br />
starch and iodine become colourless after adding amylase<br />
continuous, which can have any value within a specific range and can be<br />
expressed as a whole number, fraction or a decimal. It can be counted,<br />
ordered and measured, e.g. body mass, leaf length<br />
Evaluation<br />
Using given data, candidates should be able to:<br />
• Identify anomalous values in a table or graph of data and suggest how to deal with anomalies. Strategies<br />
for dealing with such anomalies include:<br />
– repeating the experiment until consistent results are obtained<br />
– leaving out the affected data<br />
• Suggest possible explanations for anomalous readings. Where investigations use familiar contexts that<br />
have been explored during the course, candidates should be able to suggest possible causes for such<br />
anomalies<br />
• Assess whether the provided data has been replicated sufficiently and describe whether the range of<br />
measured data was appropriate and the intervals between data was appropriate<br />
• Explain why replicating data is important and the practical limits on replication<br />
• Identify instances where:<br />
– More measurements need to be taken with an increased or decreased value of the independent<br />
variable in order to give a complete range of data values<br />
– There are gaps in the range of the independent variable which reduce the information the<br />
investigation can give<br />
• Assess whether the method of measuring is appropriate for the dependent variable, for example, using<br />
a pH meter is more likely to give more accurate and reliable results than using an indicator and a colour<br />
chart to measure changes in pH<br />
• Assess the extent to which selected variables have been effectively controlled, using given information,<br />
for example, whether the temperature recorded was the same for each of a number of samples<br />
• Use these evaluations and any given information to make informed judgements about:<br />
– how much confidence can be put in any conclusions<br />
– the validity of the investigation<br />
– how much the data can be trusted for testing the hypothesis.<br />
68 www.cie.org.uk/alevel Back to contents page