2011 Annual Report - Khaleeji Commercial Bank BSC
2011 Annual Report - Khaleeji Commercial Bank BSC
2011 Annual Report - Khaleeji Commercial Bank BSC

You also want an ePaper? Increase the reach of your titles
YUMPU automatically turns print PDFs into web optimized ePapers that Google loves.
KHALEEJI COMMERCIAL BANK <strong>BSC</strong><br />
RISK MANAGEMENT DISCLOSURES<br />
3. Capital Management and Capital Adequacy Ratio (continued)<br />
3.3 Capital structure, minimum capital requirements and capital adequacy (continued)<br />
Regulatory capital components<br />
The above components of Tier I and Tier II capital are as per the relevant CBB guidelines. According to these, Tier II<br />
capital is restricted to 100% of Tier I capital after all deductions of investments pursuant to PCD module of CBB rule<br />
book. As at 31 December <strong>2011</strong>, the <strong>Bank</strong> was not required to make any prudential deduction from its regulatory capital base.<br />
Risk weighted assets<br />
Credit risk<br />
For regulatory reporting purposes, the <strong>Bank</strong> calculates the capital requirements for credit risk based on the standardised<br />
approach. Under this approach, the on and off-balance sheet credit exposures are assigned risk weights based on the type<br />
of counterparty, type of the exposure, and source of funding (equity of investment account holders or own funds). Further<br />
for capital adequacy computations, 100% of the RWA’s is reckoned for self-financed assets while only 30% is considered<br />
for assets funded through equity of IAH. The risk weights for types of counterparties and exposures are prescribed by CBB.<br />
Market risk<br />
The <strong>Bank</strong> uses the standardised approach to measure market risk. Market risk at KHCB is primarily on account of the<br />
foreign exchange exposures that are considered as specific risks. As per the CBB guidelines, capital for foreign exchange<br />
risk is computed at 8% of overall net open foreign currency positions of the <strong>Bank</strong> and this is multiplied by 12.5 to derive<br />
the market RWA’s.<br />
The <strong>Bank</strong> does not have a trading book and hence all market risk exposures are part of the banking book for the purpose<br />
of assessing the applicable capital treatment.<br />
Operational risk<br />
The <strong>Bank</strong> adopts the Basic Indicator Approach to evaluate operational risk charge in accordance with the CBB capital<br />
adequacy module for Islamic <strong>Bank</strong>s. According to this approach, <strong>Bank</strong>’s average gross income for past three financial years<br />
is multiplied by a fixed coefficient alpha of 15% set by CBB to arrive at the capital required and a multiple of 12.5 is used<br />
to arrive at the risk weighted assets that are subject to capital charge.<br />
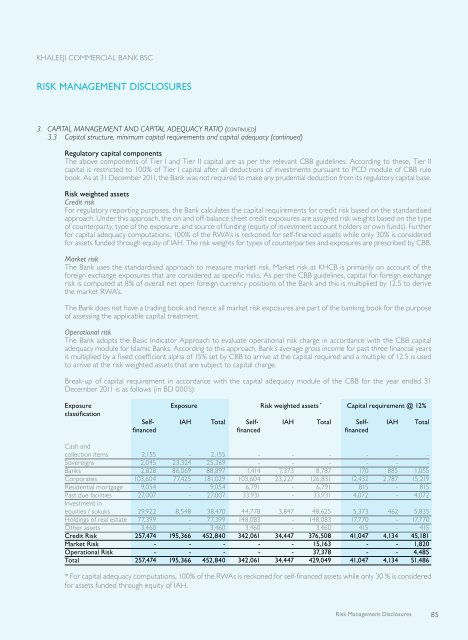
Break-up of capital requirement in accordance with the capital adequacy module of the CBB for the year ended 31<br />
December <strong>2011</strong> is as follows (in BD 000’s):<br />
Exposure exposure Risk weighted assets * Capital requirement @ 12%<br />
classification<br />
self- IAH Total Self- IAH Total Self- IAH Total<br />
financed financed financed<br />
Cash and<br />
collection items 2,155 - 2,155 - - - - - -<br />
Sovereigns 2,045 23,324 25,369 - - - - - -<br />
<strong>Bank</strong>s 2,828 86,069 88,897 1,414 7,373 8,787 170 885 1,055<br />
Corporates 103,604 77,425 181,029 103,604 23,227 126,831 12,432 2,787 15,219<br />
Residential mortgage 9,054 - 9,054 6,791 - 6,791 815 - 815<br />
Past due facilities 27,007 - 27,007 33,931 - 33,931 4,072 - 4,072<br />
Investment in<br />
equities / sukuks 29,922 8,548 38,470 44,778 3,847 48,625 5,373 462 5,835<br />
Holdings of real estate 77,399 - 77,399 148,083 - 148,083 17,770 - 17,770<br />
Other assets 3,460 - 3,460 3,460 - 3,460 415 - 415<br />
Credit Risk 257,474 195,366 452,840 342,061 34,447 376,508 41,047 4,134 45,181<br />
Market Risk - - - - - 15,163 - - 1,820<br />
Operational Risk - - - - - 37,378 - - 4,485<br />
Total 257,474 195,366 452,840 342,061 34,447 429,049 41,047 4,134 51,486<br />
* For capital adequacy computations, 100% of the RWAs is reckoned for self-financed assets while only 30 % is considered<br />
for assets funded through equity of IAH.<br />
Risk Management Disclosures<br />
85