Introduction to the resistivity surveying method. The resistivity of ...
Introduction to the resistivity surveying method. The resistivity of ...
Introduction to the resistivity surveying method. The resistivity of ...

Create successful ePaper yourself
Turn your PDF publications into a flip-book with our unique Google optimized e-Paper software.
31<br />
2.7.8 Marine bot<strong>to</strong>m <strong>resistivity</strong> survey - U.S.A.<br />
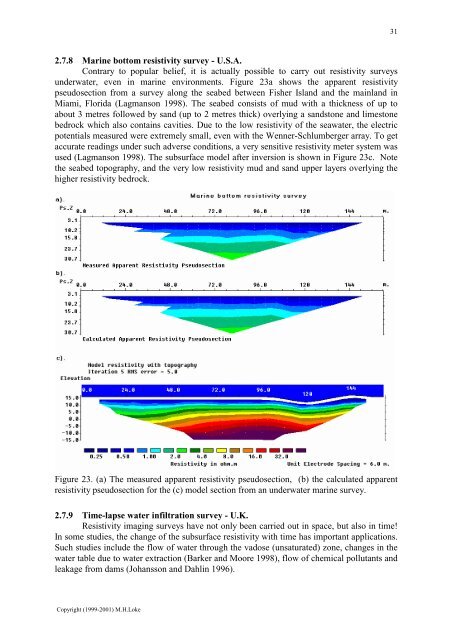
Contrary <strong>to</strong> popular belief, it is actually possible <strong>to</strong> carry out <strong>resistivity</strong> surveys<br />
underwater, even in marine environments. Figure 23a shows <strong>the</strong> apparent <strong>resistivity</strong><br />
pseudosection from a survey along <strong>the</strong> seabed between Fisher Island and <strong>the</strong> mainland in<br />
Miami, Florida (Lagmanson 1998). <strong>The</strong> seabed consists <strong>of</strong> mud with a thickness <strong>of</strong> up <strong>to</strong><br />
about 3 metres followed by sand (up <strong>to</strong> 2 metres thick) overlying a sands<strong>to</strong>ne and limes<strong>to</strong>ne<br />
bedrock which also contains cavities. Due <strong>to</strong> <strong>the</strong> low <strong>resistivity</strong> <strong>of</strong> <strong>the</strong> seawater, <strong>the</strong> electric<br />
potentials measured were extremely small, even with <strong>the</strong> Wenner-Schlumberger array. To get<br />
accurate readings under such adverse conditions, a very sensitive <strong>resistivity</strong> meter system was<br />
used (Lagmanson 1998). <strong>The</strong> subsurface model after inversion is shown in Figure 23c. Note<br />
<strong>the</strong> seabed <strong>to</strong>pography, and <strong>the</strong> very low <strong>resistivity</strong> mud and sand upper layers overlying <strong>the</strong><br />
higher <strong>resistivity</strong> bedrock.<br />
Figure 23. (a) <strong>The</strong> measured apparent <strong>resistivity</strong> pseudosection, (b) <strong>the</strong> calculated apparent<br />
<strong>resistivity</strong> pseudosection for <strong>the</strong> (c) model section from an underwater marine survey.<br />
2.7.9 Time-lapse water infiltration survey - U.K.<br />
Resistivity imaging surveys have not only been carried out in space, but also in time!<br />
In some studies, <strong>the</strong> change <strong>of</strong> <strong>the</strong> subsurface <strong>resistivity</strong> with time has important applications.<br />
Such studies include <strong>the</strong> flow <strong>of</strong> water through <strong>the</strong> vadose (unsaturated) zone, changes in <strong>the</strong><br />
water table due <strong>to</strong> water extraction (Barker and Moore 1998), flow <strong>of</strong> chemical pollutants and<br />
leakage from dams (Johansson and Dahlin 1996).<br />
Copyright (1999-2001) M.H.Loke