

Industry-Innovation-and-Competitiveness-Agenda
Industry-Innovation-and-Competitiveness-Agenda
Industry-Innovation-and-Competitiveness-Agenda

You also want an ePaper? Increase the reach of your titles
YUMPU automatically turns print PDFs into web optimized ePapers that Google loves.
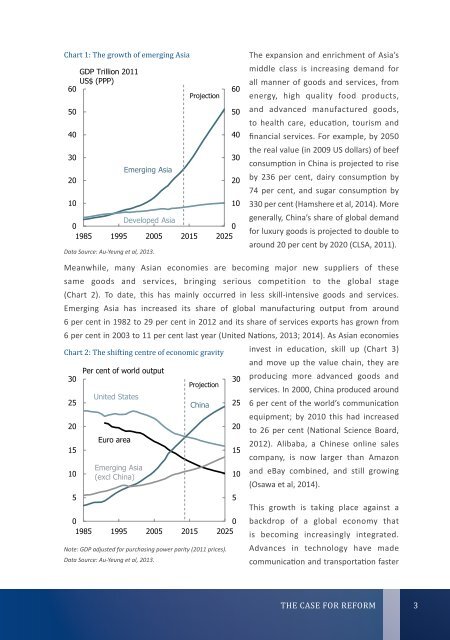
Chart 1: The growth of emerging Asia<br />
60<br />
50<br />
40<br />
30<br />
20<br />
10<br />
GDP Trillion 2011<br />
US$ (PPP)<br />
Emerging Asia<br />
Projection<br />
Developed Asia<br />
0<br />
0<br />
1985 1995 2005 2015 2025<br />
Data Source: Au-Yeung et al, 2013.<br />
60<br />
50<br />
40<br />
30<br />
20<br />
10<br />
The expansion <strong>and</strong> enrichment of Asia’s<br />
middle class is increasing dem<strong>and</strong> for<br />
all manner of goods <strong>and</strong> services, from<br />
energy, high quality food products,<br />
<strong>and</strong> advanced manufactured goods,<br />
to health care, education, tourism <strong>and</strong><br />
financial services. For example, by 2050<br />
the real value (in 2009 US dollars) of beef<br />
consumption in China is projected to rise<br />
by 236 per cent, dairy consumption by<br />
74 per cent, <strong>and</strong> sugar consumption by<br />
330 per cent (Hamshere et al, 2014). More<br />
generally, China’s share of global dem<strong>and</strong><br />
for luxury goods is projected to double to<br />
around 20 per cent by 2020 (CLSA, 2011).<br />
Meanwhile, many Asian economies are becoming major new suppliers of these<br />
same goods <strong>and</strong> services, bringing serious competition to the global stage<br />
(Chart 2). To date, this has mainly occurred in less skill-intensive goods <strong>and</strong> services.<br />
Emerging Asia has increased its share of global manufacturing output from around<br />
6 per cent in 1982 to 29 per cent in 2012 <strong>and</strong> its share of services exports has grown from<br />
6 per cent in 2003 to 11 per cent last year (United Nations, 2013; 2014). As Asian economies<br />
Chart 2: The shifting centre of economic gravity invest in education, skill up (Chart 3)<br />
<strong>and</strong> move up the value chain, they are<br />
Per cent of world output<br />
30<br />
30 producing more advanced goods <strong>and</strong><br />
Projection<br />
services. In 2000, China produced around<br />
United States<br />
25<br />
China 25 6 per cent of the world’s communication<br />
equipment; by 2010 this had increased<br />
20<br />
20<br />
to 26 per cent (National Science Board,<br />
Euro area<br />
2012). Alibaba, a Chinese online sales<br />
15<br />
15<br />
company, is now larger than Amazon<br />
Emerging Asia<br />
10<br />
10 <strong>and</strong> eBay combined, <strong>and</strong> still growing<br />
(excl China)<br />
(Osawa et al, 2014).<br />
5<br />
0<br />
0<br />
1985 1995 2005 2015 2025<br />
Note: GDP adjusted for purchasing power parity (2011 prices).<br />
Data Source: Au-Yeung et al, 2013.<br />
5<br />
<strong>Industry</strong> <strong>Innovation</strong> <strong>and</strong> <strong>Competitiveness</strong> <strong>Agenda</strong><br />
This growth is taking place against a<br />
backdrop of a global economy that<br />
is becoming increasingly integrated.<br />
Advances in technology have made<br />
communication <strong>and</strong> transportation faster<br />
TPO00007<br />
In<br />
Co<br />
THE CASE FOR REFORM<br />
3