CEA 2010 Sustainability Report - Consumer Electronics Association
CEA 2010 Sustainability Report - Consumer Electronics Association
CEA 2010 Sustainability Report - Consumer Electronics Association

Create successful ePaper yourself
Turn your PDF publications into a flip-book with our unique Google optimized e-Paper software.
E L E C T R I C I T Y A N D G H G E M I S S I O N S<br />
E N V I RO N M E NTA L<br />
PERFORMANCE<br />
ELECTRICITY USE (GWH)<br />
40,000<br />
35,000<br />
30,000<br />
25,000<br />
20,000<br />
15,000<br />
10,000<br />
5,000<br />
GHG EMISSIONS (THOUSAND METRIC TONNES OF CO2EQ)<br />
25,000<br />
20,000<br />
15,000<br />
10,000<br />
5,000<br />
SCOPE 1<br />
SCOPE 2<br />
SUSTAINABLE<br />
PRODUCT DESIGN<br />
SUSTAINABLE<br />
PACKAGING DESIGN<br />
SUSTAINABLE<br />
FACILITIES<br />
SUSTAINABLE<br />
TRANSPORT<br />
& DELIVERY<br />
ENERGY<br />
EFFICIENCY<br />
0<br />
2007 <strong>2010</strong><br />
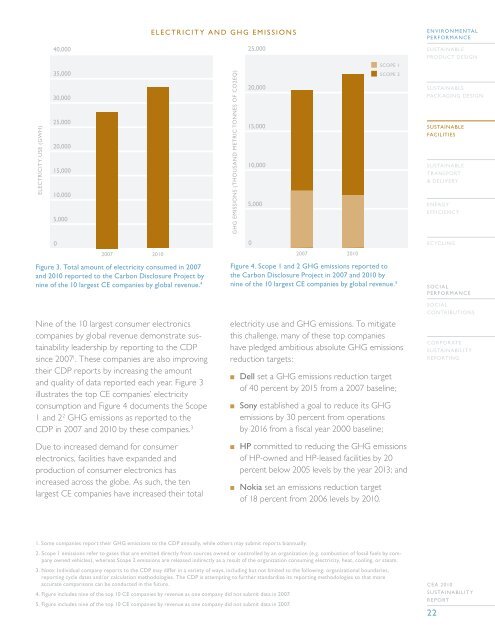
Figure 3. Total amount of electricity consumed in 2007<br />
and <strong>2010</strong> reported to the Carbon Disclosure Project by<br />
nine of the 10 largest CE companies by global revenue. 4<br />
Nine of the 10 largest consumer electronics<br />
companies by global revenue demonstrate sustainability<br />
leadership by reporting to the CDP<br />
since 2007 1 . These companies are also improving<br />
their CDP reports by increasing the amount<br />
and quality of data reported each year. Figure 3<br />
illustrates the top CE companies’ electricity<br />
consumption and Figure 4 documents the Scope<br />
1 and 2 2 GHG emissions as reported to the<br />
CDP in 2007 and <strong>2010</strong> by these companies. 3<br />
Due to increased demand for consumer<br />
electronics, facilities have expanded and<br />
production of consumer electronics has<br />
increased across the globe. As such, the ten<br />
largest CE companies have increased their total<br />
0<br />
2007 <strong>2010</strong><br />
Figure 4. Scope 1 and 2 GHG emissions reported to<br />
the Carbon Disclosure Project in 2007 and <strong>2010</strong> by<br />
nine of the 10 largest CE companies by global revenue. 5<br />
electricity use and GHG emissions. To mitigate<br />
this challenge, many of these top companies<br />
have pledged ambitious absolute GHG emissions<br />
reduction targets:<br />
n Dell set a GHG emissions reduction target<br />
of 40 percent by 2015 from a 2007 baseline;<br />
n Sony established a goal to reduce its GHG<br />
emissions by 30 percent from operations<br />
by 2016 from a fiscal year 2000 baseline;<br />
n HP committed to reducing the GHG emissions<br />
of HP-owned and HP-leased facilities by 20<br />
percent below 2005 levels by the year 2013; and<br />
n Nokia set an emissions reduction target<br />
of 18 percent from 2006 levels by <strong>2010</strong>.<br />
ECYCLING<br />
SOCIAL<br />
PERFORMANCE<br />
SOCIAL<br />
CONTRIBUTIONS<br />
CORPORATE<br />
SUSTAINABILITY<br />
REPORTING<br />
1. Some companies report their GHG emissions to the CDP annually, while others may submit reports biannually.<br />
2. Scope 1 emissions refer to gases that are emitted directly from sources owned or controlled by an organization (e.g. combustion of fossil fuels by company<br />
owned vehicles), whereas Scope 2 emissions are released indirectly as a result of the organization consuming electricity, heat, cooling, or steam.<br />
3. Note: Individual company reports to the CDP may differ in a variety of ways, including but not limited to the following: organizational boundaries,<br />
reporting cycle dates and/or calculation methodologies. The CDP is attempting to further standardize its reporting methodologies so that more<br />
accurate comparisons can be conducted in the future.<br />
4. Figure includes nine of the top 10 CE companies by revenue as one company did not submit data in 2007.<br />
5. Figure includes nine of the top 10 CE companies by revenue as one company did not submit data in 2007.<br />
CE A <strong>2010</strong><br />
SUSTAINABILIT Y<br />
REPORT<br />
22