TEAK PLANTATIONS IN NILAMBUR - Kerala Forest Research Institute
TEAK PLANTATIONS IN NILAMBUR - Kerala Forest Research Institute
TEAK PLANTATIONS IN NILAMBUR - Kerala Forest Research Institute

You also want an ePaper? Increase the reach of your titles
YUMPU automatically turns print PDFs into web optimized ePapers that Google loves.
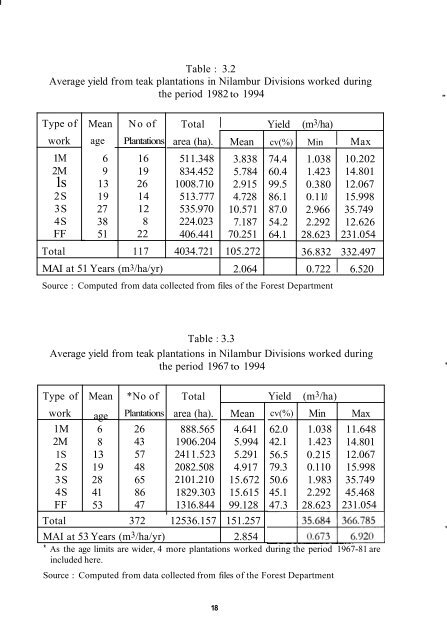
Table : 3.2<br />
Average yield from teak plantations in Nilambur Divisions worked during<br />
the period 1982 to 1994<br />
Type of<br />
work<br />
1 M<br />
2M<br />
1s<br />
2S<br />
3S<br />
4S<br />
FF<br />
Mean<br />
age<br />
6<br />
9<br />
13<br />
19<br />
27<br />
38<br />
51<br />
No of<br />
Plantations<br />
16<br />
19<br />
26<br />
14<br />
12<br />
8<br />
22<br />
Total<br />
area (ha).<br />
51 1.348<br />
834.452<br />
1008.71 0<br />
5 13.777<br />
535.970<br />
224.023<br />
406.441<br />
Total 117 4034.721 105.272<br />
MAI at 51 Years (m3/ha/yr) 2.064<br />
I Yield (m 3 /ha)<br />
Mean cv(%) Min I Max<br />
3.838<br />
5.784<br />
2.915<br />
4.728<br />
10.571<br />
7.187<br />
70.251<br />
74.4<br />
60.4<br />
99.5<br />
86.1<br />
87.0<br />
54.2<br />
64.1<br />
Source : Computed from data collected from files of the <strong>Forest</strong> Department<br />
1.038 10.202<br />
1.423 14.801<br />
0.380 12.067<br />
0.110<br />
15.998<br />
2.966 35.749<br />
2.292 12.626<br />
28.623 231.054<br />
36.832 332.497<br />
0.722 I 6.520<br />
Table : 3.3<br />
Average yield from teak plantations in Nilambur Divisions worked during<br />
the period 1967 to 1994<br />
Type of<br />
work<br />
1M<br />
2M<br />
1S<br />
2S<br />
3S<br />
4S<br />
FF<br />
Mean<br />
age<br />
6<br />
8<br />
13<br />
19<br />
28<br />
41<br />
53<br />
*No of<br />
Plantations<br />
26<br />
43<br />
57<br />
48<br />
65<br />
86<br />
47<br />
Total<br />
area (ha).<br />
888.565<br />
1906.204<br />
2411.523<br />
2082.508<br />
2101.210<br />
1829.303<br />
1316.844<br />
Mean<br />
4.641<br />
5.994<br />
5.291<br />
4.917<br />
15.672<br />
15.615<br />
99.128<br />
Yield<br />
cv(%)<br />
62.0<br />
42.1<br />
56.5<br />
79.3<br />
50.6<br />
45.1<br />
47.3<br />
(m 3 /ha)<br />
Min<br />
1.038<br />
1.423<br />
0.215<br />
0.110<br />
1.983<br />
2.292<br />
28.623<br />
Max<br />
11.648<br />
14.801<br />
12.067<br />
15.998<br />
35.749<br />
45.468<br />
231.054<br />
Total 372<br />
I<br />
12536.157 151.257<br />
MAI at 53 Years (m 3 /ha/yr)<br />
2.854<br />
* As the age limits are wider, 4 more plantations worked during the period 1967-81 are<br />
included here.<br />
Source : Computed from data collected from files of the <strong>Forest</strong> Department<br />
18