TEAK PLANTATIONS IN NILAMBUR - Kerala Forest Research Institute
TEAK PLANTATIONS IN NILAMBUR - Kerala Forest Research Institute
TEAK PLANTATIONS IN NILAMBUR - Kerala Forest Research Institute

Create successful ePaper yourself
Turn your PDF publications into a flip-book with our unique Google optimized e-Paper software.
Age<br />
20<br />
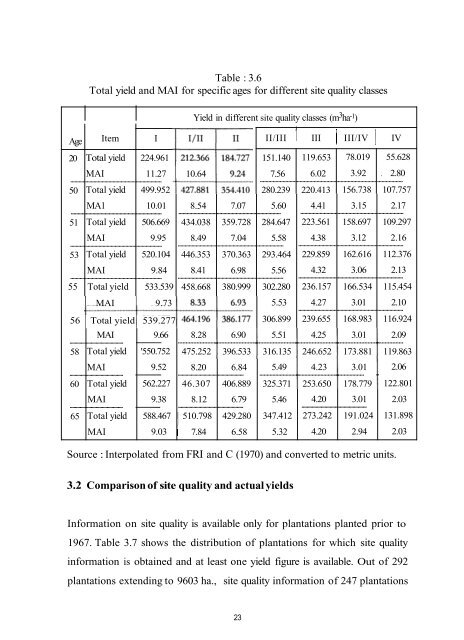
Table : 3.6<br />
Total yield and MAI for specific ages for different site quality classes<br />
I I Yield in different site quality classes (m 3 ha -1 )<br />
Item<br />
Total yield 224.961<br />
MAI 11.27<br />
...................................................................<br />
50 Total yield 499.952<br />
MA1 10.01<br />
...................................................................<br />
51 Total yield 506.669<br />
MAI 9.95<br />
....................................................................<br />
53 Total yield 520.104<br />
I<br />
10.64<br />
~~ ~~ ~<br />
151.140<br />
8.54 7.07 5.60<br />
...........................................................................<br />
434.038 359.728 284.647<br />
8.49 7.04 5.58<br />
.............................................................................<br />
446.353 370.363 293.464<br />
MAI 9.84 8.41 6.98 5.56<br />
.................................................................... .............................................................................<br />
55 Total yield 533.539 458.668 380.999 302.280<br />
II/III 1 III 1 III/IV 1 IV<br />
119.653 78.019 55.628<br />
7.56 6.02 3.92 . 2.80<br />
.....................................................................................................<br />
280.239 220.413 156.738 107.757<br />
4.41 3.15 2.17<br />
...........................................................................<br />
223.561 158.697 109.297<br />
4.38 3.12 2.16<br />
.............................................................................<br />
229.859 162.616 112.376<br />
4.32 3.06 2.13<br />
.............................................................................<br />
236.157 166.534 115.454<br />
MAI 9.73<br />
5.53 4.27 3.01 2.10<br />
1 1 1<br />
.............................................................................<br />
1 1<br />
56 Total yield 539.277<br />
306.899 239.655 168.983 116.924<br />
MAI 9.66 8.28 6.90 5.51 4.25 3.01 2.09<br />
........................................... . .................................................................................................................................................<br />
1 1 1<br />
58 Total yield '550.752 475.252 396.533 316.135 246.652 173.881 119.863<br />
MAI 9.52 8.20 6.84<br />
........................................... . ...................................................<br />
,<br />
5.49 4.23 3.01 2.06<br />
........................................................................<br />
60 Total yield 562.227 46.307 406.889 325.371 253.650 178.779 122.801<br />
MAI 9.38 8.12 6.79 5.46 4.20 3.01 2.03<br />
........................................... . ...................................................<br />
...................................................<br />
65 Total yield 588.467 510.798 429.280 347.412 273.242 191.024 131.898<br />
MAI 9.03<br />
1 7.84 6.58 5.32 4.20 2.94 2.03<br />
Source : Interpolated from FRI and C (1970) and converted to metric units.<br />
3.2 Comparison of site quality and actual yields<br />
Information on site quality is available only for plantations planted prior to<br />
1967. Table 3.7 shows the distribution of plantations for which site quality<br />
information is obtained and at least one yield figure is available. Out of 292<br />
plantations extending to 9603 ha., site quality information of 247 plantations<br />
23