TEAK PLANTATIONS IN NILAMBUR - Kerala Forest Research Institute
TEAK PLANTATIONS IN NILAMBUR - Kerala Forest Research Institute
TEAK PLANTATIONS IN NILAMBUR - Kerala Forest Research Institute
Create successful ePaper yourself
Turn your PDF publications into a flip-book with our unique Google optimized e-Paper software.
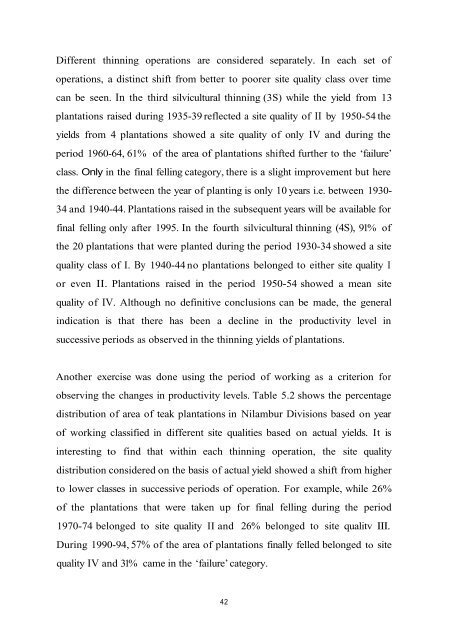
Different thinning operations are considered separately. In each set of<br />
operations, a distinct shift from better to poorer site quality class over time<br />
can be seen. In the third silvicultural thinning (3S) while the yield from 13<br />
plantations raised during 1935-39 reflected a site quality of II by 1950-54 the<br />
yields from 4 plantations showed a site quality of only IV and during the<br />
period 1960-64, 61% of the area of plantations shifted further to the ‘failure’<br />
class. Only in the final felling category, there is a slight improvement but here<br />
the difference between the year of planting is only 10 years i.e. between 1930-<br />
34 and 1940-44. Plantations raised in the subsequent years will be available for<br />
final felling only after 1995. In the fourth silvicultural thinning (4S), 91% of<br />
the 20 plantations that were planted during the period 1930-34 showed a site<br />
quality class of I. By 1940-44 no plantations belonged to either site quality I<br />
or even II. Plantations raised in the period 1950-54 showed a mean site<br />
quality of IV. Although no definitive conclusions can be made, the general<br />
indication is that there has been a decline in the productivity level in<br />
successive periods as observed in the thinning yields of plantations.<br />
Another exercise was done using the period of working as a criterion for<br />
observing the changes in productivity levels. Table 5.2 shows the percentage<br />
distribution of area of teak plantations in Nilambur Divisions based on year<br />
of working classified in different site qualities based on actual yields. It is<br />
interesting to find that within each thinning operation, the site quality<br />
distribution considered on the basis of actual yield showed a shift from higher<br />
to lower classes in successive periods of operation. For example, while 26%<br />
of the plantations that were taken up for final felling during the period<br />
1970-74 belonged to site quality II and 26% belonged to site qualitv III.<br />
During 1990-94, 57% of the area of plantations finally felled belonged to site<br />
quality IV and 31% came in the ‘failure’ category.<br />
42


