Information and communication technologies (ICTs) and ... - ITU
Information and communication technologies (ICTs) and ... - ITU
Information and communication technologies (ICTs) and ... - ITU

You also want an ePaper? Increase the reach of your titles
YUMPU automatically turns print PDFs into web optimized ePapers that Google loves.
only environmental impact considered <strong>and</strong> was mainly from electricity use. Equipment manufacturing was<br />
not included.<br />
The main results showed that broadcast DTT has a smaller carbon footprint per viewer-hour than VoD for<br />
average sized audiences, but not with small audiences or for homes using an aerial amplifier. The largest<br />
environmental impact from watching television is from the consumer equipment. This amounts to 76 per<br />
cent of the total for DTT <strong>and</strong> 78 per cent <strong>and</strong> 37 per cent for VoD using desktop <strong>and</strong> laptop computers<br />
respectively. The trend for larger screens could increase this, although there is a parallel increase in viewing<br />
on small mobile devices. Programme-making contributes 12 per cent to 35 per cent.<br />
Results were sensitive to the viewer numbers per display. Doubling the number of viewers per display<br />
reduces the carbon footprint by 44 per cent for digital terrestrial television. For VoD, there was large<br />
uncertainty in the energy consumption data for the content delivery network <strong>and</strong> the Internet. However,<br />
this does not affect the main outcomes.<br />
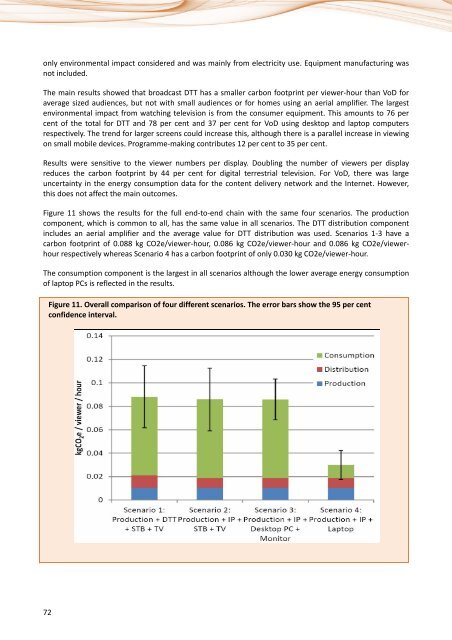
Figure 11 shows the results for the full end-to-end chain with the same four scenarios. The production<br />
component, which is common to all, has the same value in all scenarios. The DTT distribution component<br />
includes an aerial amplifier <strong>and</strong> the average value for DTT distribution was used. Scenarios 1-3 have a<br />
carbon footprint of 0.088 kg CO2e/viewer-hour, 0.086 kg CO2e/viewer-hour <strong>and</strong> 0.086 kg CO2e/viewerhour<br />
respectively whereas Scenario 4 has a carbon footprint of only 0.030 kg CO2e/viewer-hour.<br />
The consumption component is the largest in all scenarios although the lower average energy consumption<br />
of laptop PCs is reflected in the results.<br />
Figure 11. Overall comparison of four different scenarios. The error bars show the 95 per cent<br />
confidence interval.<br />
72