2011/2012 Annual Report - Metro Tasmania
2011/2012 Annual Report - Metro Tasmania
2011/2012 Annual Report - Metro Tasmania

Create successful ePaper yourself
Turn your PDF publications into a flip-book with our unique Google optimized e-Paper software.
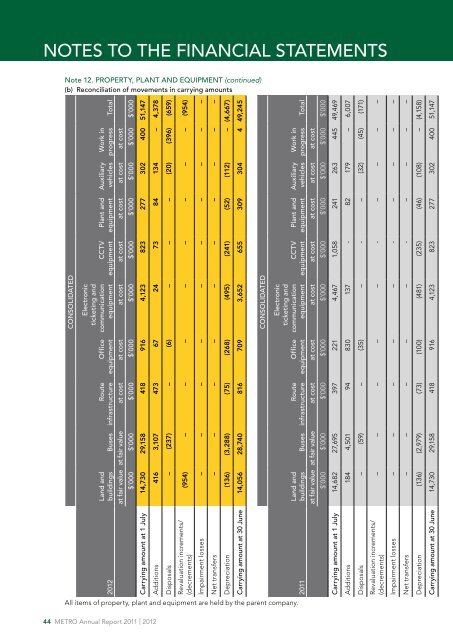
NOTES TO THE FINANCIAL STATEMENTS<br />
Note 12. PROPERTY, PLANT AND EQUIPMENT (continued)<br />
(b) Reconciliation of movements in carrying amounts<br />
CONSOLIDATED<br />
<strong>2012</strong><br />
Land and<br />
buildings Buses<br />
Route<br />
infrastructure<br />
Office<br />
equipment<br />
Electronic<br />
ticketing and<br />
communication<br />
equipment<br />
CCTV<br />
equipment<br />
Plant and<br />
equipment<br />
Auxiliary<br />
vehicles<br />
at fair value at fair value at cost at cost at cost at cost at cost at cost at cost<br />
Work in<br />
progress Total<br />
$’000 $’000 $’000 $’000 $’000 $’000 $’000 $’000 $’000 $’000<br />
Carrying amount at 1 July 14,730 29,158 418 916 4,123 823 277 302 400 51,147<br />
Additions 416 3,107 473 67 24 73 84 134 – 4,378<br />
Disposals – (237) – (6) – – – (20) (396) (659)<br />
Revaluation increments/<br />
(decrements)<br />
(954) – – – – – – – – (954)<br />
Impairment losses – – – – – – – – – –<br />
Net transfers – – – – – – – – – –<br />
Depreciation (136) (3,288) (75) (268) (495) (241) (52) (112) – (4,667)<br />
Carrying amount at 30 June 14,056 28,740 816 709 3,652 655 309 304 4 49,245<br />
CONSOLIDATED<br />
<strong>2011</strong><br />
Land and<br />
buildings Buses<br />
Route<br />
infrastructure<br />
Office<br />
equipment<br />
Electronic<br />
ticketing and<br />
communication<br />
equipment<br />
CCTV<br />
equipment<br />
Plant and<br />
equipment<br />
Auxiliary<br />
vehicles<br />
Work in<br />
progress Total<br />
at fair value at fair value at cost at cost at cost at cost at cost at cost at cost<br />
$’000 $’000 $’000 $’000 $’000 $’000 $’000 $’000 $’000 $’000<br />
Carrying amount at 1 July 14,682 27,695 397 221 4,467 1,058 241 263 445 49,469<br />
Additions 184 4,501 94 830 137 - 82 179 – 6,007<br />
Disposals – (59) – (35) – - – (32) (45) (171)<br />
Revaluation increments/<br />
(decrements)<br />
– – – – – - – – – –<br />
Impairment losses – – – – – - – – – –<br />
Net transfers – – – – – - – – – –<br />
Depreciation (136) (2,979) (73) (100) (481) (235) (46) (108) – (4,158)<br />
Carrying amount at 30 June 14,730 29,158 418 916 4,123 823 277 302 400 51,147<br />
All items of property, plant and equipment are held by the parent company.<br />
44 METRO <strong>Annual</strong> <strong>Report</strong> <strong>2011</strong> | <strong>2012</strong>