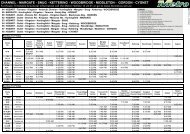
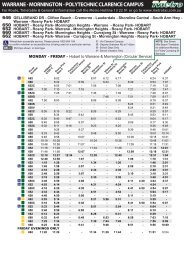
2011/2012 Annual Report - Metro Tasmania
2011/2012 Annual Report - Metro Tasmania
2011/2012 Annual Report - Metro Tasmania

You also want an ePaper? Increase the reach of your titles
YUMPU automatically turns print PDFs into web optimized ePapers that Google loves.
NOTES TO THE FINANCIAL STATEMENTS<br />
Note 28. SUPERANNUATION AND DEFINED BENEFIT PLAN (continued)<br />
Amounts Recognised in Other Comprehensive Income – Para 120A(h)<br />
Financial year ending 30 June <strong>2012</strong> 30 June <strong>2011</strong><br />
$’000 $’000<br />
Actuarial (gains)/losses 6,113 (1,115)<br />
Adjustment for limit on net asset – –<br />
Cumulative Amount Recognised in the Other Comprehensive Income – Para 120A(i)<br />
Financial year ending 30 June <strong>2012</strong> 30 June <strong>2011</strong><br />
$’000 $’000<br />
Cumulative amount of actuarial (gains)/losses at end of prior year 736 1,851<br />
Actuarial (gains)/losses recognised during the year end 6,113 (1,115)<br />
Cumulative amount of actuarial (gains)/losses at end of year 6,849 736<br />
Fund Assets – Para 120A(j)<br />
The percentage invested in each asset class at the Statement of Financial Position date:<br />
As at 31 March <strong>2012</strong> 31 March <strong>2011</strong><br />
Australian equity 29% 25%<br />
International equity 18% 22%<br />
Fixed income 12% 13%<br />
Property 33% 19%<br />
Alternatives/other 5% 18%<br />
Cash 3% 3%<br />
Fair Value of Fund Assets – Para 120A(k)<br />
The fair value of Fund assets includes no amounts relating to:<br />
• any of the authority’s own financial instruments<br />
• any property occupied by, or other assets used by, the authority<br />
Expected Rate of Return on Fund Assets – Para 120A(l)<br />
The expected return on assets assumption is determined by weighting the expected long-term<br />
return for each asset class by the target allocation of assets to each asset class and allowing for the<br />
correlations of the investment returns between asset classes. The returns used for each asset class<br />
are net of estimated investment tax and investment fees.<br />
56 METRO <strong>Annual</strong> <strong>Report</strong> <strong>2011</strong> | <strong>2012</strong>