

DAILY AIR TEMPERATURE AND PRESSURE SERIES ... - BALTEX
DAILY AIR TEMPERATURE AND PRESSURE SERIES ... - BALTEX
DAILY AIR TEMPERATURE AND PRESSURE SERIES ... - BALTEX

You also want an ePaper? Increase the reach of your titles
YUMPU automatically turns print PDFs into web optimized ePapers that Google loves.
<strong>DAILY</strong> <strong>AIR</strong> <strong>TEMPERATURE</strong> <strong>AND</strong> <strong>PRESSURE</strong> <strong>SERIES</strong> FOR<br />
STOCKHOLM (1756–1998)<br />
<strong>AND</strong>ERS MOBERG 1 , HANS BERGSTRÖM 2 , JOSEFIN RUIZ KRIGSMAN 1<br />
and OLA SVANERED 1<br />
1 Department of Physical Geography and Quaternary Geology, Stockholm University,<br />
SE-106 91 Stockholm, Sweden<br />
2 Department of Earth Sciences, Meteorology, Uppsala University, SE-752 36 Uppsala, Sweden<br />
Abstract. Daily meteorological observations have been made at the old astronomical observatory<br />
in Stockholm since 1754. Complete daily mean series of air temperature and sea level pressure are<br />
reconstructed from the observational data for 1756–1998. The temperature and pressure series are<br />
reconstructed and homogenized with the aid of metadata, statistical tests and comparisons with data<br />
from other stations. Comparisons with independently reconstructed daily series for nearby Uppsala<br />
(1722–1998) show that the quality of the daily Stockholm data is good, although the reliability is<br />
lower before the mid-19th century. The daily temperature data show that the colder winter mean<br />
temperatures of the late 18th to early 19th centuries were connected with a particularly high frequency<br />
of very cold winter days. The warmer summers of the same period are more connected with a<br />
general shift of the temperature distribution towards higher temperatures than in the late 20th century.<br />
1. Introduction<br />
Daily meteorological observations have been made at the old astronomical observatory<br />
in Stockholm (59 ◦ 21 ′ N, 18 ◦ 03 ′ E) since 1754. Monthly mean temperatures<br />
for 1756–1905 were calculated by Hamberg (1906). These monthly data have subsequently<br />
been updated by the Swedish Meteorological and Hydrological Institute<br />
(SMHI). Moberg and Bergström (1997) homogenized the Hamberg/SMHI record<br />
from 1861 onwards and discussed the temperature variability back to 1756. A<br />
discussion of precipitation data back to 1785 was made by Eriksson (1980a). The<br />
air pressure data before 1862 have not been analyzed previously.<br />
Our purpose is to give a rather detailed history for the meteorological station<br />
at the old astronomical observatory in Stockholm and to describe the procedures<br />
used for reconstruction of complete daily series of air temperatures and sea level<br />
pressures for Stockholm back to 1756. The focus is much more on historical<br />
and technical details than on climatic analyses, although some aspects of climatic<br />
change are analysed in Section 4.5. More comprehensive climatic analyses of the<br />
daily records are made elsewhere (Moberg et al., 2000; Jones et al., 2001; Yan et<br />
al., 2001, 2002).<br />
Parallel with the work presented here, daily records of air temperature and pressure<br />
for Uppsala, situated about 65 km north of Stockholm, were reconstructed<br />
Climatic Change 53: 171–212, 2002.<br />
© 2002 Kluwer Academic Publishers. Printed in the Netherlands.
172 <strong>AND</strong>ERS MOBERG ET AL.<br />
back to 1722. The work with the two stations was made independently as far as<br />
possible. The Uppsala records are presented in a companion paper (Bergström and<br />
Moberg, 2002, where some additional aspects of the daily data for Stockholm are<br />
discussed.<br />
2. Station History<br />
2.1. GENERAL SITE INFORMATION<br />
The astronomer and statistician Pehr Wargentin (1717–1783), secretary of the<br />
Royal Swedish Academy of Sciences, initiated meteorological observations at the<br />
astronomical observatory in Stockholm on 1 January 1754. The observatory is<br />
located at 44 m a.s.l. on the top of a ≈25 m high esker. In the 1750s, Stockholm<br />
had about 60 000 inhabitants and the observatory was then situated in a rural environment<br />
about 1 km northwest of the old city border. Strong urban development<br />
has taken place since the second half of the 19th century. The population is now<br />
about 1.5 million including suburbs. The observatory is today situated in a park<br />
(approx. size 200×200 m) in the city center. The urbanization has led to an artificial<br />
warming at the observatory by about 0.7 ◦ C on the average (Moberg and Bergström,<br />
1997).<br />
A national Swedish meteorological station network was initiated in 1859. The<br />
Stockholm observatory became one of the stations already from the start. The<br />
observatory is still an official weather station, although the building is now used<br />
partly as a museum for science history.<br />
2.2. OBSERVERS<br />
Wargentin made the meteorological observations from 1 January 1754 until his<br />
death on 10 December 1783, except for some short periods of absence. He was<br />
followed by Henric Nicander, who made most of the observations until the end of<br />
1803. From 1804 onwards the observers were generally anonymous. Until around<br />
1820 it appears that the scientific staff made the observations, whereas afterwards<br />
the task was probably left to the non-scientific staff (e.g., attendants). From 1859<br />
onwards the observers must be expected to have received instructions concerning<br />
the Swedish standard procedures for meteorological observations. Station inspection<br />
reports from 1915 onwards, which include the observers’ names since 1931,<br />
are available at the SMHI.<br />
2.3. OBSERVED VARIABLES<br />
During 1754–1755 meteorological observations were made only once a day. Data<br />
for these earliest two years have been ignored in this study because they are<br />
considered too few for estimation of daily mean values. During 1756–1760 two
<strong>DAILY</strong> <strong>AIR</strong> <strong>TEMPERATURE</strong> <strong>AND</strong> <strong>PRESSURE</strong> <strong>SERIES</strong> FOR STOCKHOLM (1756–1998) 173<br />
observations per day of temperature, pressure, wind direction and wind speed were<br />
made. Descriptive weather remarks were made and abbreviations for the amount<br />
of clouds were also noted. From 1761 onwards the thermometer has been observed<br />
three times per day. In 1784, after an invitation from the meteorological<br />
society in Mannheim to participate in an international observation programme,<br />
the observation routines in Stockholm began to follow standards similar to those<br />
recommended by the Mannheim society (Kington, 1974; Moberg, 1998). Three<br />
barometer observations per day were made from June 1784. Quantitative precipitation<br />
measurements began in January 1785 and indoor temperature (presumably<br />
close to the barometer) was reported from February 1785 onwards. From 1859<br />
onwards, the observations followed the Swedish standards, including three daily<br />
observations of temperature, air pressure, cloud amount, cloud type, precipitation,<br />
humidity etc. Observations of daily temperature maxima and minima were also<br />
introduced in 1859.<br />
2.4. OBSERVATION HOURS<br />
Several different time schedules have been used (Table I). Wargentin’s temperature<br />
observations 1756–1760 were roughly made around sunrise and 13, but no precise<br />
documentation was made. A few short periods with only one observation per day<br />
also occurred. During 1761–1783, the thermometer readings were made around<br />
6.30–8, 13 and 22–23, still without precise documentation and with a schedule that<br />
varied somewhat from year to year. Information about observation hours is often<br />
completely missing in this period. For all months when observation hours were not<br />
documented, we estimated them ⋆ by inserting the mean values for all cases during<br />
1761–1783 with documented hours (separately for January, February, etc.). From<br />
1756 to May 1784 the barometer readings were made in the morning and in the<br />
evening at varying times and often with no specification of the hours.<br />
In May 1784, observation hours at 06, 14 and 21 were introduced for all variables.<br />
Unfortunately, observation hours were not documented at all between June<br />
1784 and December 1822. From January 1823 to the end of 1858 the hours were<br />
again reported as 06, 14 and 21. A natural first guess is therefore that the observations<br />
were always made at 06, 14 and 21 from May 1784 through December 1858.<br />
Hamberg (1906), however, observed a much larger temperature difference noon–<br />
morning during 1797–1815 compared with the preceding and following periods.<br />
He concluded that a deviation from the schedule must have occurred. Our analyses<br />
support Hamberg’s conclusion. We follow his suggestion that the observations<br />
1797–1815 were made at sunrise, 14 and 21, although this is an uncertain assumption.<br />
During 1859–1940 the three daily observations of all variables were made at<br />
08, 14 and 21. The schedule changed again in 1941 to the hours 08, 14 and 19 and<br />
finally in 1947 to 07, 13 and 19.<br />
⋆ Observation hours are needed for the reconstruction of daily mean temperatures from a few<br />
observations per day.
174 <strong>AND</strong>ERS MOBERG ET AL.<br />
Table I<br />
Average observation hours (decimal CET) in different time periods<br />
Jan Feb Mar Apr May Jun Jul Aug Sep Oct Nov Dec<br />
1756–1760 8.5 7.4 6.0 4.5 3.2 2.6 3.0 4.1 5.3 6.5 7.7 8.6<br />
12.9 13.0 13.0 12.8 12.7 12.8 12.9 12.9 12.7 12.6 12.5 12.7<br />
1761–1784.04.30 7.7 7.4 6.8 6.3 6.2 6.4 6.3 6.2 6.2 6.5 6.7 7.6<br />
12.8 12.6 12.8 12.8 12.9 12.9 13.2 13.2 12.8 12.5 12.2 12.6<br />
22.0 22.1 22.0 21.9 21.9 22.6 22.2 21.8 21.6 21.7 21.4 21.8<br />
1784.05.01–1796 5.9 6.0 6.0 5.8 5.7 5.8 5.9 5.9 5.7 5.6 5.5 5.7<br />
13.9 14.0 14.0 13.8 13.7 13.8 13.9 13.9 13.7 13.6 13.5 13.7<br />
20.9 21.0 21.0 20.8 20.7 20.8 20.9 20.9 20.7 20.6 20.5 20.7<br />
1797–1815 8.5 7.4 6.0 4.5 3.2 2.6 3.0 4.1 5.3 6.5 7.7 8.6<br />
13.9 14.0 14.0 13.8 13.7 13.8 13.9 13.9 13.7 13.6 13.5 13.7<br />
20.9 21.0 21.0 20.8 20.7 20.8 20.9 20.9 20.7 20.6 20.5 20.7<br />
1816–1858 5.9 5.9 5.9 5.8 5.8 5.8 5.9 5.8 5.7 5.7 5.7 5.8<br />
13.9 13.9 13.9 13.8 13.8 13.8 13.9 13.8 13.7 13.7 13.7 13.8<br />
20.9 20.9 20.9 20.8 20.8 20.8 20.9 20.8 20.7 20.7 20.7 20.8<br />
1859–1878 7.9 7.9 7.9 7.8 7.8 7.8 7.9 7.8 7.7 7.7 7.7 7.8<br />
13.9 13.9 13.9 13.8 13.8 13.8 13.9 13.8 13.7 13.7 13.7 13.8<br />
20.9 20.9 20.9 20.8 20.8 20.8 20.9 20.8 20.7 20.7 20.7 20.8<br />
1879–1940 8.0<br />
14.0 Same hours all months<br />
21.0<br />
1941–1946 8.0<br />
14.0 Same hours all months<br />
19.0<br />
1947–present 7.0<br />
13.0 Same hours all months<br />
19.0<br />
In Sweden, Local Solar Time (LST) was used before 1841, Local Mean Time<br />
(LMT) 1841–1878, and a common civil Swedish time, which differed just 14<br />
seconds from Central European Time (CET), was introduced in 1879 (Lodén,<br />
1968). CET has been used since 1900. All observation hours given in LST or
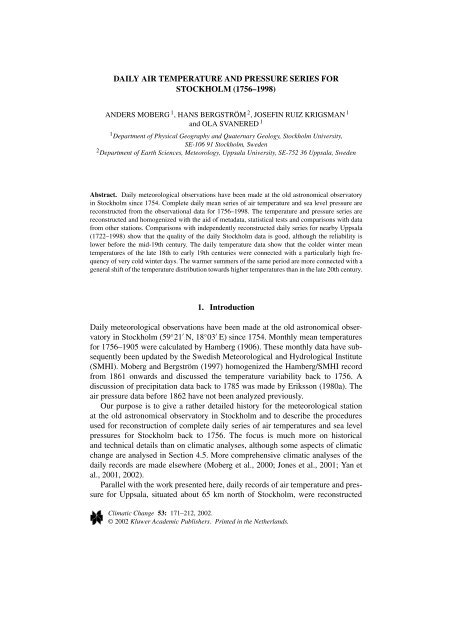
<strong>DAILY</strong> <strong>AIR</strong> <strong>TEMPERATURE</strong> <strong>AND</strong> <strong>PRESSURE</strong> <strong>SERIES</strong> FOR STOCKHOLM (1756–1998) 175<br />
Figure 1. Wargentin’s observation register for January 1761.<br />
LMT were converted here to equivalent CET values before they were used for<br />
the reconstruction of daily mean temperatures.<br />
3. Data<br />
3.1. DATA SOURCES<br />
For the period 1756–1861 we used photo-copies of the original hand-written<br />
observation journals (Figure 1) as data source. Data for 1862–1960 were taken<br />
from printed tables in the meteorological year-books Meteorologiska Iakttagelser i<br />
Sverige, published by the SMHI or its predecessors. Daily maximum and minimum<br />
temperatures were not published in the year-books 1870–1899, therefore we used<br />
the original hand-written journal as source for these data. Data from 1961 onwards<br />
were supplied as computer files by the SMHI. The original observation journals for<br />
1754–1858 are available at the Academy of Sciences and those from 1859 onwards<br />
at the SMHI.
176 <strong>AND</strong>ERS MOBERG ET AL.<br />
3.2. DETECTION <strong>AND</strong> CORRECTION OF R<strong>AND</strong>OM DATA ERRORS<br />
Random data errors occur both in the original hand-written documents and the<br />
printed year-books. Further errors were introduced by mistakes during the digitizing.<br />
A number of plotting techniques were used to identify errors in both the<br />
temperature and pressure data. The overall idea was that with a suitable plot of<br />
data, most random errors will be revealed as outliers or ‘suspect’ values in some<br />
sense. Examples of the data plots we used are: time series plots of all data, time<br />
series plots of all observations in one month (one plot for all data in January 1756,<br />
one plot for February 1756, and so on throughout the entire series), time series<br />
plots of temperature differences T noon –T morning and T noon –T evening (one plot for all<br />
January data 1756–1998, one for all February data, etc.).<br />
In all cases when evident outliers or more subtle ‘suspect’ values were found,<br />
the source was inspected. If mistakes made during the digitizing were detected,<br />
it was straightforward to correct the files. If the outliers turned out to indicate<br />
‘suspect’ values in the original source, it was more problematic to find a proper<br />
value. To deduce reasonably true temperature or pressure values we used the simultaneous<br />
information about other weather parameters (e.g., cloudiness, snow or<br />
rain, wind direction and speed, general weather comments) in conjunction with<br />
meteorological common-sense. Sometimes it was easy to correct a wrong value,<br />
for example when a temperature value was ‘obviously’ wrong by 10 degrees, or<br />
when an air pressure value was wrong by one inch (old unit). Other cases were<br />
more difficult, for example when the observers had not been consistent in their<br />
use of plus and minus signs for temperatures and when the temperatures on such<br />
occasions were near zero. In a few cases, when it was impossible to deduce a<br />
reasonable value, the observation was considered as missing.<br />
In addition to the plotting techniques, some logical computational tests were<br />
performed on the data taken from the meteorological year-books 1862–1960.<br />
Monthly mean values were printed in the books. We checked all cases when the<br />
printed mean values differed from the those calculated from the digitized values.<br />
We also tested if the daily T max (T min ) in the data sources were higher or equal<br />
(lower or equal) than the warmest (coldest) of the three instantaneous temperature<br />
observations each corresponding day. Corrections were applied whenever<br />
necessary in order to obtain logically consistent computer files.<br />
The result of all corrections is that the computer files used as input to the reconstructions<br />
of daily mean temperatures and air pressures contain no ‘obviously<br />
wrong’ or ‘very strange’ individual values. We strived at being as conservative as<br />
possible, i.e., corrections were made only when we were convinced that the values<br />
in the original sources could impossibly be correct.
<strong>DAILY</strong> <strong>AIR</strong> <strong>TEMPERATURE</strong> <strong>AND</strong> <strong>PRESSURE</strong> <strong>SERIES</strong> FOR STOCKHOLM (1756–1998) 177<br />
4. The Temperature Series<br />
In this chapter we describe how a complete series of daily mean temperatures<br />
for Stockholm was reconstructed back to 1756. We begin with information and a<br />
discussion about thermometers and thermometer positions. Thereafter we describe<br />
the actual computations used for estimation of daily mean temperatures and how<br />
the data were homogenized. The quality of the data is also discussed. Finally, some<br />
statistical analyses of the reconstructed daily temperature series is presented and<br />
discussed in a context of climatic changes.<br />
4.1. THERMOMETERS<br />
There is no direct information about the quality of the thermometers before the<br />
mid-1820s. Wargentin, however, discussed the various thermometer types used in<br />
Europe at his time (Wargentin, 1749). He concluded that the Celsius type was both<br />
reliable and easy to calibrate properly. Consequently, he always used the Celsius<br />
thermometer. In fact, the Celsius thermometer scale has always been used for the<br />
observations in Stockholm, with the readings given in whole and half degrees<br />
1754–1821, thirds and fourths 1821–1838, and in tenths after 1838.<br />
The first note about a thermometer calibration is found in the observation diary<br />
of 1826, which states that: “The true zero point on . . . the thermometer is at +0.75<br />
on its scale. This has been taken into account in the diary”. There is unfortunately<br />
no information about the time point when the incorrectly calibrated thermometer<br />
began to be used, or when the correction began to be applied. Therefore, we made a<br />
direct comparison with temperatures for Uppsala to estimate the duration of the actual<br />
time period. We observed that the temperature difference ⋆ Stockholm-Uppsala<br />
was systematically about 0.7 ◦ C too large from 1 August 1819 to 13 January 1825.<br />
Consequently, we applied a correction of –0.7 ◦ C to all observed tempertures for<br />
this period.<br />
There is a second note about a thermometer calibration in the diary of 1858.<br />
This time the zero point was found to be correct. The third occasion with similar<br />
information is 1915. This is the first year for which a regular station inspection<br />
report is available. Station inspection reports from 1915 onwards (available at<br />
SMHI), reveal that thermometers were calibrated at each inspection.<br />
4.2. THERMOMETER POSITIONS<br />
The thermometers have been placed at three different positions. Initially, the thermometer<br />
was “hung in the free air, outside a window, on the north side of the<br />
observatory, and well protected against the morning sun” (Wargentin, 1778). This<br />
statement is essentially all available information about the earliest thermometer<br />
⋆ This difference was calculated from estimated daily mean temperatures obtained later in the<br />
work.
178 <strong>AND</strong>ERS MOBERG ET AL.<br />
Figure 2. The astronomical observatory in Stockholm 1784. The arrow marks the probable thermometer<br />
position, outside a window on the north-facing wall, which was used from 1754 to<br />
1875.<br />
position. This position, at 5.8 m above ground (Figure 2) was used until the end of<br />
August 1875, when the building underwent major changes and a new section was<br />
built on its north side (Hamberg, 1906). From September 1875 through 1960 the<br />
thermometer was placed on the new north-facing wall at 1.5–1.9 m above ground.<br />
A metal screen, placed in front of a window, (Figure 3) was introduced in January<br />
1878 for protection against radiation. Modén (1963) reported that the screen was<br />
painted white, although it is not known if it was painted already when it was new.<br />
In 1947, when the observation hours changed, the window screen became exposed<br />
to sunlight at the time of observations in summer mornings. Therefore,<br />
a psychrometer-thermometer was placed in a small free standing screen, about<br />
10 metres northeast of the building. The morning observation was made on this<br />
thermometer during May–September from 1947 to 1960, whereas all other observations<br />
were made in the window screen (Modén 1963). In August 1960 a standard<br />
SMHI screen (Stevenson type, thermometer height 1.5–1.7 m) (Figure 3) was introduced.<br />
Since 1961, all temperature readings are made there. Inspection reports<br />
from 1970 onwards reveal that the screen repeatedly has become dirty because of<br />
air pollution. This may have caused temperatures to be positively biased. Furthermore,<br />
the position of the screen, between a tall and dense hedge and the building,<br />
is not optimal for temperature measurements as the ventilation is poor.
<strong>DAILY</strong> <strong>AIR</strong> <strong>TEMPERATURE</strong> <strong>AND</strong> <strong>PRESSURE</strong> <strong>SERIES</strong> FOR STOCKHOLM (1756–1998) 179<br />
Figure 3. The window screen (at the right arrow) where temperature was measured from 1878 to<br />
1960 and the SMHI screen (at the left arrow) which has been used since 1961. The photograph was<br />
taken in October 1984. (Photo: SMHI).<br />
Parallel temperature readings were made for one year (1961) in the window<br />
screen and the SMHI screen (Modén, 1963). Differences between instantaneous<br />
readings were negligible in the winter but they differed by up to several degrees in<br />
the summer. The largest differences were observed at clear-sky conditions, with the<br />
window screen being warmer in the mornings and the SMHI screen being warmer<br />
at noon. Despite the large differences between individual temperature readings,<br />
the difference between monthly averages was within ±0.1 ◦ C. This implies that the<br />
change of screen in 1960 is not a serious source of inhomogeneity as far as monthly<br />
averages are concerned.<br />
We made an effort to estimate also the effect of the changed thermometer position<br />
in 1875. A resistance thermometer was placed in the SMHI screen and another<br />
one was placed behind a simple shield outside a north-facing window at about 6 m<br />
above ground, corresponding approximately to the oldest thermometer position.<br />
Data were collected every tenth minute from June 1995 to May 1997. Results from<br />
these parallell measurements (Ekström, 1995; Linde, 1998) are in line with those<br />
of Modén (1963). Istantaneous temperatures differed by several degrees at clearsky<br />
conditions in summer, with the ‘old’ position being warmer in the mornings<br />
and the SMHI screen being warmer at noon. The differences in winter were generally<br />
negligible and differences in monthly mean values were small in all months.
180 <strong>AND</strong>ERS MOBERG ET AL.<br />
Certainly, the changed thermometer position in 1875 introduced an inhomogeneity<br />
of some kind, but it is difficult to quantify its importance and character in detail.<br />
4.3. ESTIMATION OF <strong>DAILY</strong> MEAN <strong>TEMPERATURE</strong>S<br />
To estimate daily mean temperatures from a few instantaneous observations per<br />
day, it is necessary to use a method that takes into acount the observational hours.<br />
For the period 1859–1998 we used the same equation as used for all official<br />
Swedish stations since the 1860s. For the earlier period, 1756–1858, no standard<br />
equations have been developed so we had to use another method.<br />
The following equation was used for 1756–1858:<br />
T d = 1 n (T 1 + f cl · 1 + T 2 + f cl · 2 +···+T n + f cl · n ), (1)<br />
where T d is the estimated daily mean temperature, T 1 ,T 2 ,...,T n are the recorded<br />
instantaneous temperatures in a particular day, and 1 , 2 ,..., n are the mean<br />
deviations from the daily mean temperature at the actual observation hour in a<br />
particular day of the year. The scaling factor, f cl , is included to take into account the<br />
effect of cloud amount on the amplitude of the daily temperature cycle. Scaling factors<br />
were determined for three cloud cover classes (‘cloudy’, ‘clear’, ‘half-clear’)<br />
for each day of the year. The number of terms, n, is the number of observations in<br />
a particular day. In the overwhelming majority of cases, n = 3. Details of how the<br />
-values and f cl factors were determined are given in an Appendix.<br />
To study the effect of the inclusion of the f cl factors in Equation (1), daily mean<br />
temperatures were calculated also without using the factors. In the overwhelming<br />
majority (99.8%) of the days 1756–1858, the absolute difference between daily<br />
temperatures calculated with and without the scaling factors was found to be<br />
0.1 relate to days with only one temperature<br />
observation. The scaling factor thus seems to be quite unimportant, in particular<br />
when temperature readings are available both in the morning and at noon (i.e. near<br />
the time of T min and T max ). One may also conclude that, as long as temperatures<br />
are observed near both T min and T max , the risk of any artificial trends in observed<br />
temperatures due to trends in cloud amounts is negligible. A further discussion of<br />
the properties of Equation (1) is made by Bergström and Moberg (2002).<br />
For the period 1859–1998, T d was estimated as:<br />
T d = p · T 1 + q · T 2 + r · T 3 + x · T max + s · T min ,<br />
(2a)<br />
with the constraint that<br />
p + q + r + x + s = 1 .<br />
(2b)<br />
Different sets of coefficients (p, q, r, x, s), for various combinations of hours,<br />
have been developed for different longitudes by the SMHI or its predecessors. The
<strong>DAILY</strong> <strong>AIR</strong> <strong>TEMPERATURE</strong> <strong>AND</strong> <strong>PRESSURE</strong> <strong>SERIES</strong> FOR STOCKHOLM (1756–1998) 181<br />
Table II<br />
Coefficients (×0.01) in Equation (2) for calculation of daily mean temperatures in Stockholm in three<br />
sub-periods 1859–1998. Observation hours in the sub-periods are given within parentheses. Data<br />
from Ekholm (1916), Modén (1939), Sveriges Meteorologiska och Hydrologiska Institut (1966) and<br />
Eriksson (1980b)<br />
1859–1940 (08, 14, 21) 1941–1946 (08, 14, 19) 1947–1998 (07, 13, 19)<br />
p q r x s p q r x s p q r x s<br />
Jan 38 23 39 45 20 35 33 15 32 10 10<br />
Feb 34 25 41 41 18 41 31 18 31 10 10<br />
Mar 35 21 44 45 14 41 31 21 28 10 10<br />
Apr 35 18 48 34 09 44 13 23 18 30 10 19<br />
May 31 16 49 4 25 15 38 22 22 20 23 10 25<br />
Jun 25 18 51 6 25 14 39 22 21 19 24 10 26<br />
Jul 25 21 45 9 23 15 39 23 19 18 26 10 27<br />
Aug 32 16 52 26 18 35 21 18 22 23 10 27<br />
Sep 36 19 45 34 22 30 14 25 23 24 10 18<br />
Oct 31 22 47 40 16 44 29 19 32 10 10<br />
Nov 36 25 39 40 18 42 30 16 34 10 10<br />
Dec 37 23 40 40 17 43 34 15 31 10 10<br />
coeffiecents for Stockholm are given in Table II. In cases when at least one of<br />
the temperature observations during a certain day was missing, we estimated daily<br />
mean temperatures using Equation (1), as Equation (2) requires that no observation<br />
is missing.<br />
A drawback of using Equation (2) is that coefficients have been developed only<br />
on a monthly basis. The estimated daily mean temperature series can therefore<br />
contain small artificial steps at the shift of months. This is probably not a serious<br />
problem as such artificial steps can hardly be larger than a few tenths of degrees,<br />
whereas real temperature changes from day-to-day can be at least one order of<br />
magnitude larger. One reason why we rejected to use Equation (1) for the modern<br />
data is the that T max and T min cannot be included. Equation (1) is particularly unsuitable<br />
for estimation of daily mean temperatures in the summer season after 1859<br />
as the morning readings since then have been made at 08 or 07, i.e., at hours when<br />
the temperature generally is far from the daily minimum.<br />
4.4. CORRECTION <strong>AND</strong> HOMOGENIZATION OF THE <strong>DAILY</strong> MEAN<br />
<strong>TEMPERATURE</strong> <strong>SERIES</strong><br />
When a series of daily mean temperatures for Stockholm had been established using<br />
Equations (1) and (2), it was compared with data from nearby stations to search
182 <strong>AND</strong>ERS MOBERG ET AL.<br />
for random errors and systematic inhomogeneities and to find suitable corrections<br />
for the data homogenization.<br />
4.4.1. The Period 1861–1998<br />
It was shown by Moberg and Bergström (1997) that the Stockholm temperature<br />
record is affected by an urban warming trend from the 1860s to 1970s. There is<br />
also an abrupt shift to lower temperatures in relation to surrounding stations around<br />
1900. These inhomogeneities were detected with the standard normal homogeneity<br />
test for abrupt changes and linear trends (Alexandersson, 1986; Alexandersson and<br />
Moberg, 1997), with ten homogenized neighbouring temperature series 1861–1994<br />
used as reference data.<br />
Using the same reference series again, homogeneity tests of the Stockholm temperatures<br />
for 1861–1994 were also performed here. Monthly mean temperatures<br />
were first calculated from the daily temperatures established in Section 4.3. The<br />
approach of combining the tests for abrupt change and linear trend was essentially<br />
the same as described by Moberg and Bergström (1997). A difference between the<br />
two investigations, however, is that here we estimated the inhomogeneities on a<br />
monthy basis, whereas the previous investigation was made on a seasonal basis.<br />
The variability in the time series to be tested (difference: candidate–reference) is<br />
larger for monthly data than for seasonal data, whereas the size of inhomogeneities<br />
is about the same in both. The determination of exact time points of abrupt shifts,<br />
and particularly start and end points of trends, is therefore more uncertain for<br />
monthly data. To obtain statistically stable dates, these were always determined<br />
from tests on annual mean series. The actual size of inhomogeneities (in ◦ C) were<br />
then determined from monthly series (separately for January, February, etc.).<br />
We found a trend section 1868–1888 with increasing bias, an abrupt negative<br />
jump after 1903 and a second positive trend section 1914–1966. The two positive<br />
trend sections are attributed to an increasing urban warming, whereas the jump<br />
after 1903 is not easily explained. A possible explanation is that the window screen,<br />
introduced in 1878, was not painted white before 1904 but was painted at that time<br />
and thus started to reflect radiation more effectively. This explanation, however,<br />
has not been either verified, nor falsified, by any metadata.<br />
The total effect of all inhomogeneities is an average bias of recent annual mean<br />
temperatures by +0.77 ◦ C. There is an annual cycle in this bias, with a maximum<br />
(+1.37 ◦ C) in May and a minimum (+0.24 ◦ C) in October. We tested if this annual<br />
cycle is sensitive to the choice of stations, by repeating the calculations using independent<br />
subsets of the reference stations. The results were virtually identical to<br />
those for the full set.<br />
The results of the homogeneity tests are listed in Table III. We used these results<br />
to construct a time series of daily temperature corrections. Daily correction<br />
values were obtained by linear interpolation between the monthly values. The daily<br />
correction time series thus starts with zeros in 1868 and reaches its largest values<br />
in 1966. For the period 1967–1998 the corrections are constant for each day of
<strong>DAILY</strong> <strong>AIR</strong> <strong>TEMPERATURE</strong> <strong>AND</strong> <strong>PRESSURE</strong> <strong>SERIES</strong> FOR STOCKHOLM (1756–1998) 183<br />
Table III<br />
Estimated biases ( ◦ C) in the temperature series after 1861. After interpolation to daily<br />
values, these data were used as a basis for homogenizing the temperature series<br />
Linear Constant Constant Linear change Constant<br />
change level level 1914–1966 level<br />
1868–1888 1889–1903 1904–1913 1967–1998<br />
Jan 0.00 to +0.53 +0.53 +0.37 +0.37 to +0.78 +0.78<br />
Feb 0.00 to +0.47 +0.47 +0.23 +0.23 to +0.85 +0.85<br />
Mar 0.00 to +0.47 +0.47 +0.33 +0.33 to +0.96 +0.96<br />
Apr 0.00 to +0.47 +0.47 +0.18 +0.18 to +0.80 +0.80<br />
May 0.00 to +0.78 +0.78 +0.49 +0.49 to +1.37 +1.37<br />
Jun 0.00 to +0.52 +0.52 +0.36 +0.36 to +1.09 +1.09<br />
Jul 0.00 to +0.55 +0.55 +0.35 +0.35 to +1.01 +1.01<br />
Aug 0.00 to +0.52 +0.52 +0.11 +0.11 to +0.78 +0.78<br />
Sep 0.00 to +0.29 +0.29 –0.13 –0.13 to +0.30 +0.30<br />
Oct 0.00 to +0.18 +0.18 –0.11 –0.11 to +0.24 +0.24<br />
Nov 0.00 to +0.31 +0.31 +0.07 +0.07 to +0.47 +0.47<br />
Dec 0.00 to +0.30 +0.30 +0.07 +0.07 to +0.59 +0.59<br />
Annual 0.00 to +0.45 +0.45 +0.19 +0.19 to +0.77 +0.77<br />
average<br />
the year, but there is an annual cycle superimposed. The daily corrections were<br />
subtracted from the observed daily mean temperatures to create a homogenized<br />
series.<br />
In the homogenized series all temperature data after 1868 are adjusted to the<br />
conditions corresponding of the 1860s. Note that no weather-dependent day-to-day<br />
changes of the urban warming is taken into account. The homogenization is valid<br />
only on an average monthly basis. It is beyond the scope of this paper, however, to<br />
investigate the nature of errors that certainly still remain because of this.<br />
4.4.2. Direct Comparison with Uppsala 1756–1998<br />
After homogenization of the period 1861–1998, the daily Stockholm temperatures<br />
were compared with the Uppsala temperatures obtained by Bergström and Moberg<br />
(2002). A study of daily differences Stockholm–Uppsala revealed a number of<br />
random errors and a few systematic biases in both series. The data sources were<br />
inspected and we used all information about other weather variables to judge when<br />
‘suspect’ values should be considered as true or false. Corrections were applied<br />
whenever appropriate.
184 <strong>AND</strong>ERS MOBERG ET AL.<br />
Large systematic differences (several degrees) were observed for several months<br />
in 1756. Therefore, we made comparisons with independent temperature observations<br />
for Stockholm ⋆ 1756–1758, and concluded that temperatures reported at the<br />
astronomical observatory were biased high 1756.04.03–1756.10.31. The observed<br />
daily temperatures for Stockholm were therefore substituted with data estimated<br />
from the Uppsala temperatures. These estimated temperatures were obtained using<br />
a linear regression relation established between the two series 1757–1783. The<br />
same regression relation was also used to fill a data gap in the Stockholm series<br />
25–28 February 1763.<br />
Although the direct comparisons Stockholm–Uppsala show that there certainly<br />
exist further periods with biased data, in particular before the 1860s (see Bergström<br />
and Moberg, 2002), it was not possible to identify any further corrections to apply<br />
to the Stockholm series. The corrections mentioned in this section thus complete<br />
the description of our efforts to obtain a daily mean temperature reconstruction for<br />
Stockholm.<br />
4.5. SELECTED STATISTICAL ANALYSES OF THE <strong>DAILY</strong> <strong>TEMPERATURE</strong> <strong>SERIES</strong><br />
In this section, the daily temperature series is analysed briefly in terms of some<br />
statistical properties. An internal homogeneity test of summer temperatures is followed<br />
by some analyses that reveal temporal changes in the statistical distribution<br />
of daily temperatures.<br />
4.5.1. Internal Test of Summer Temperatures<br />
There is a potential risk for positively biased summer temperatures during much<br />
of the period before 1859. The thermometer was then placed on the north-facing<br />
wall, and was therefore certainly affected to some extent by heating from sun-rays<br />
hitting the wall at the time of the morning observation (at 06) in summer.<br />
Any such bias is expected to be largest at clear-sky conditions. An internal test<br />
for the presence of a weather-dependent temperature bias is therefore to compare<br />
separate series of temperatures for clear, half-clear and cloudy days. We constructed<br />
independent summer average temperatures for each of the three classes<br />
(T clear , T half clear , T cloudy ), and studied time series of the differences T clear –T cloudy and<br />
T half clear –T cloudy . Such plots, presented as anomalies with respect to 1961–1990, are<br />
shown in Figure 4. The difference series do not support any sunlight-related bias<br />
before 1859, as T clear is generally not relatively warmer than T cloudy and T half clear in<br />
this period (rather the opposite). We conclude that the problem with direct sunlight<br />
on the old thermometers is not an important one.<br />
⋆ Daily meteorological observational data from an unkown site in Stockholm were published in<br />
the newspaper Stockholms Weckoblad 1748–1770.
<strong>DAILY</strong> <strong>AIR</strong> <strong>TEMPERATURE</strong> <strong>AND</strong> <strong>PRESSURE</strong> <strong>SERIES</strong> FOR STOCKHOLM (1756–1998) 185<br />
Figure 4. Separate JJA average temperatures 1756–1998, expressed as anomalies from the<br />
1961–1990 mean, calculated using daily mean temperatures for clear days, half clear days and cloudy<br />
days separately. The differences T clear –T cloudy and T half clear –T cloudy are also shown.<br />
4.5.2. Seasonal and Annual Temperature Series<br />
Time series of annual and seasonal average temperatures, as calculated from the<br />
daily reconstruction, are shown in Figure 5. Variability on time scales longer than<br />
a decade are highlighted with a gaussian filter (thick curves). For comparison,<br />
the corresponding low-pass filtered series of Moberg and Bergström (1997) are<br />
also shown (thin curves). The systematic difference between the two records is<br />
due to different choices for homogenization. Moberg and Bergström (1997) corrected<br />
all data to a level corresponding to the present situtation, whereas the new
186 <strong>AND</strong>ERS MOBERG ET AL.<br />
Figure 5. Annual and seasonal mean temperatures in Stockholm 1756–1998, according to the homogenized<br />
version reconstructed in this paper. Smoothed time series (Gaussian filter with σ = 3) for<br />
this reconstruction are shown with thick curves. Thin curves represent smoothed temperature series<br />
from the reconstruction by Moberg and Bergström (1997).<br />
reconstruction is adjusted to the conditions around 1860. Apart from the systematic<br />
difference the low-pass filtered curves are very similar. There do, of course, exist<br />
some differences between the two temperature reconstructions, but these differences<br />
do not show up easily in low-pass filtered curves. We emphasize that all<br />
general conclusions about climatic changes and trends discussed by Moberg and<br />
Bergström (1997) are valid also for the new reconstruction.
<strong>DAILY</strong> <strong>AIR</strong> <strong>TEMPERATURE</strong> <strong>AND</strong> <strong>PRESSURE</strong> <strong>SERIES</strong> FOR STOCKHOLM (1756–1998) 187<br />
Figure 6. Annual temperature cycle in Stockholm, represented by smoothed sequences of the 10th,<br />
50th and 90th percentiles of the daily mean temperatures in eight time periods. The thick black curves<br />
represent the recent period 1961–1998. The thin curves, having different grey tones, represent the<br />
periods 1756–1780, 1781–1810, 1811–1840, 1841–1870, 1871–1900, 1901–1930 and 1931–1960.<br />
The grey tone indicate the age of the period. The earliest period has the lightest tone. The most<br />
recent period has the darkest tone. The smoothing reduces variability on time scales shorter than<br />
about two weeks (Gaussian filter with σ = 4.2).<br />
4.5.3. Percentiles of Daily Temperatures<br />
In Figure 6, smoothed 10th, 50th and 90th percentiles of daily temperatures are<br />
shown for the earliest 25-year period, six non-overlapping 30-year periods and<br />
the most recent 38-year period 1961–1998. The graphs indicate that an overall<br />
change has taken place from more continental conditions, with more frequent cold<br />
winter days and warm summer days in the late 18th to early 19th centuries, to more<br />
maritime conditions in the late 20th century.<br />
In Figure 7, the differences between the smoothed percentile sequences for<br />
1961–1998 and 1756–1840 are plotted. These plots highlight the changes in<br />
temperature distributions between the late-18th to early-19th centuries and the late-<br />
20th century. A general warming can be observed in autumn, winter and spring<br />
whereas a cooling is observed in summer. The 10th percentile for mid-January to<br />
early February and the whole of March has increased by as much as 3 ◦ C, which is<br />
much more than the corresponding increase for the 50th and 90th percentiles. Thus,<br />
winters in Stockholm during 1756–1840 were not only colder on the average than<br />
1961–1998, but the frequency of very cold days was particularly high. The cooling
188 <strong>AND</strong>ERS MOBERG ET AL.<br />
Figure 7. Differences of smoothed 10th, 50th and 90th percentile sequences for the periods<br />
1961–1998 and 1756–1840. Positive values indicate that 1961–1998 has the warmer temperatures.<br />
The thick curves highligt variability on time scales longer than about two weeks (Gaussian filter<br />
with σ = 4.2). The thin curves highligt variability on time scales longer than about three months<br />
(Gaussian filter with σ = 30).<br />
of summer temperatures is, on the contrary, almost equal for all three percentiles.<br />
There is only a slightly smaller change of the 10th percentile than of the 50th and<br />
90th percentiles. The summer cooling has thus been connected with a general shift<br />
of the entire temperature distribution, with a small tendency towards fewer hot days<br />
dominating an increase in number of chilly summer days.<br />
4.5.4. Frequency of Hot Summer Days and Cold Winter Days<br />
A time-series plot of the changes in frequency of hot summer days and cold winter<br />
days is shown in Figure 8. We define a hot summer day as a day with its mean<br />
temperature exceeding the 95th percentile for all July days 1961–90 (+21.1 ◦ C).<br />
Accordingly, we define a cold winter day as a day with mean temperature below<br />
the 5th percentile for all January days 1961–90 (–13.4 ◦ C).<br />
Many years with a high frequency of cold winter days occurred around the<br />
1770s, 1780s and 1800s. From the 1810s to the 1890s cold winter days became<br />
less frequent. The frequency of cold winter days declined abruptly around 1900<br />
and they were very rare 1900–1939. After the extremely cold 3-year period 1940–<br />
42, the frequency of cold days has varied from decade to decade. Notably, 1985<br />
was one of four years with the highest frequency (23) of cold days in the whole
<strong>DAILY</strong> <strong>AIR</strong> <strong>TEMPERATURE</strong> <strong>AND</strong> <strong>PRESSURE</strong> <strong>SERIES</strong> FOR STOCKHOLM (1756–1998) 189<br />
Figure 8. The number of hot days (daily mean > +21.1 ◦ C) and cold days (daily mean < –13.4 ◦ C)<br />
in Stockholm each year 1756–1998. A smoothed curve (Gaussian low-pass filter with σ = 3) is also<br />
shown.<br />
record (the others were 1788, 1809 and 1814), whereas the entire 1990s had only<br />
three cold winter days. The general tendency for hot summer days is a decline from<br />
a high frequency in the 1770s and 1780s to a minimum in the 1870s and 1880s,<br />
and thereafter a partial recovery to more frequent hot days in the 20th century.<br />
4.6. DISCUSSION OF THE <strong>TEMPERATURE</strong> <strong>SERIES</strong><br />
We have reconstructed a series of daily mean temperatures for Stockholm 1756–<br />
1998, using the original observational data as source. Daily mean temperatures<br />
as calculated directly from the observations were subjected to homogeneity tests<br />
based on comparisons with data for several surrounding stations after 1861 and homogenized<br />
according to the test results. Further corrections were made after comparisons<br />
with the simultaneously, but independently, reconstructed temperature<br />
series (Bergström and Moberg, 2002) for Uppsala.<br />
With this daily temperature reconstruction it is possible to make more detailed<br />
analyses of climatic changes than with the commonly available monthly average<br />
data. Some selected analyses that can only be made with daily data were presented<br />
in Section 4.5. There is, however, not space for more extensive analyses here.<br />
Nevertheless, the results from our few analyses show some details behind the<br />
previously observed (Moberg and Bergström, 1997) general cooling of summer
190 <strong>AND</strong>ERS MOBERG ET AL.<br />
mean temperatures and warming of winter mean temperatures since the late 18th<br />
century. An example of this is that the colder winter mean temperatures of the<br />
late 18th to early 19th centuries is connected with a particularly high frequency<br />
of very cold winter days. The warmer summers of the same period seems to be<br />
more connected with a general shift of the temperature distribution towards higher<br />
temperatures than in the late 20th century.<br />
It can be questioned if these observed changes reflect real climatic changes or if<br />
they are seriously affected by data deficiencies that still remain. If the observations<br />
reflect real climatic changes, they should be supported by independent observations<br />
in other climatic variables and in observations from other stations. A few analyses<br />
have already been undertaken (Moberg et al., 2000; Jones et al., 2001; Yan et al.,<br />
2001, 2002), but there is a clear need both for further long daily data series to be<br />
developed and for more extensive analyses to be made.<br />
5. The Air Pressure Series<br />
Here we describe the reconstruction of a daily air pressure series for Stockholm<br />
1756–1998. Information about the instruments and their locations is followed by<br />
a description of our methods. Reductions to sea level pressure of data after 1859<br />
involved only routine calculations, whereas this was a difficult task for the older<br />
data because barometers with partly unkown properties were used. Therefore, a<br />
detailed description of our approach to perform these reductions is given. To homogenize<br />
the series, we applied adjustments derived from comparisons with data<br />
from surrounding stations. The essential parts of our methods are similar to those<br />
used by Bärring et al. (1999) in reconstruction of air pressures for Lund back to<br />
1780.<br />
5.1. BAROMETERS <strong>AND</strong> BAROMETER UNITS<br />
We assume that one single barometer was used most of the period 1754–1858,<br />
although there is no unequivocal evidence for this. We base this assumption mainly<br />
on the following arguments: The barometer unit in the observation journal was<br />
always Swedish inches (1 sw.inch = 29.69 mm) 1754–1858. In all contemporary<br />
inventories ⋆ (dated 1775, 1789, 1807, 1821, 1834) of the instruments at the observatory,<br />
there was only one barometer with a Swedish scale mentioned – constructed<br />
by the academy’s instrument maker Daniel Ekström (1711–1755). There is also a<br />
note in the observation journal of 1844 that Ekström’s barometer was actually used<br />
at that time. This instrument still exists and can be seen at the museum of science<br />
history at the old astronomical observatory in Stockholm. It can easily be seen<br />
that the Ekström barometer was used for a very long time as the brass scale is<br />
heavily worn, probably because of innumerable touches by the observers’ thumbs.<br />
⋆ Available at the museum of science history at the old astronomical observatory in Stockholm.
<strong>DAILY</strong> <strong>AIR</strong> <strong>TEMPERATURE</strong> <strong>AND</strong> <strong>PRESSURE</strong> <strong>SERIES</strong> FOR STOCKHOLM (1756–1998) 191<br />
Figure 9. Barometer constructed by Daniel Ekström around 1750. This barometer was probably used<br />
for the daily meteorological observations at the old astronomical observatory in Stockholm most of<br />
the time from 1754–1858. (Photo: A. Moberg).<br />
We conclude that it is very likely that the Ekström barometer was used almost the<br />
entire period 1754–1858, only with exception for some short periods of restoration<br />
of the instrument.<br />
A photograph of the barometer is shown in Figure 9. An X-ray image of its bottom<br />
part is shown in Figure 10. The instrument has a mercury container and a glass<br />
tube attached to a frame of walnut wood. Its scale is made of brass and covers the<br />
range 23–28 sw.inch (≈910–1108 hPa). A mark for what was regarded as a normal<br />
pressure at the time (Celsius, 1742) is found at 25.3 on the scale (≈1001.5 hPa).<br />
The mercury height was observed with an accuracy of 0.01 sw.inch (≈0.4 hPa).<br />
Most of the mercury has been lost and the instrument cannot be used today.<br />
It is likely that another barometer was introduced in 1859, as the unit changed<br />
to sw. inch × 10 −1 and pressure values reduced to 0 ◦ C began to be reported. This<br />
coincides with the start time for the Swedish meteorological station net. During<br />
1862–1937 the air pressure was reported in mmHg, and from 1938 onwards in
192 <strong>AND</strong>ERS MOBERG ET AL.<br />
Figure 10. X-ray image of the lower part of Ekström’s barometer. (Image: Stiftelsen Observatoriekullen).<br />
hPa. It can be expected that the barometers used in Stockholm from 1862 onwards<br />
were standard instruments, first supplied by the academy of sciences and later by<br />
SMHI or its predecessors.<br />
The barometer temperature has been observed since February 1785, but before<br />
1859 reductions to 0 ◦ C were not reported in the journals. Pressure values in the<br />
data sources for 1859–1920 were reduced to 0 ◦ C. Data for 1921–1960 were reduced<br />
both to 0 ◦ C and normal gravity in the sources. Data for 1961–1998, supplied<br />
electronically by the SMHI, were reduced to sea level before delivery.<br />
5.2. BAROMETER POSITIONS<br />
The barometer altitudes in various sub-periods are listed in Table IV. The altitude,<br />
and hence the exact position, of the barometer is not precisely known before 1862.<br />
From 1862 onwards the barometer has been placed at either 44.4, 48.1, or 51.8 m<br />
a.s.l., which correspond to the three floors of the observatory building. Barometer<br />
readings were not made at the observatory from July 1939 through February 1950.<br />
Air pressure data for this period have instead been taken from Bromma airport,<br />
about 10 km from the observatory.
<strong>DAILY</strong> <strong>AIR</strong> <strong>TEMPERATURE</strong> <strong>AND</strong> <strong>PRESSURE</strong> <strong>SERIES</strong> FOR STOCKHOLM (1756–1998) 193<br />
Table IV<br />
Barometer altitude in different sub-periods<br />
Period Barometer Comment<br />
altitude<br />
(m a.s.l.)<br />
1756–1861 44.4 (?) Assumption<br />
1862–1876 48.1<br />
1877–1939.06.30 44.4<br />
1939.07.01–1950.02.28 10.5 Bromma airport<br />
1950.03.01–1959.03.17 44.4<br />
1959.03.18– 51.8<br />
For the period before 1862, we assume that the barometer was always placed<br />
on the ground floor. We base this assumption mainly on the fact that the observed<br />
barometer temperature 1785–1839 rather closely followed the observed outdoor<br />
temperatures. The barometer must therefore have been placed in an unheated and<br />
rather well-ventilated room, i.e. at conditions desired for a room where astronomical<br />
instruments were placed. In this early period, the astronomical instruments<br />
were in fact placed on the ground floor.<br />
In 1840 the annual cycle of the barometer temperature switched abruptly from<br />
an ‘outdoor’ type to an ‘indoor’ type. The barometer may have been moved to<br />
another floor at this occasion, but it is equally possible that it remained in the same<br />
room as before and that this room began to be heated in the cold season. This is<br />
quite likely to have happened. In fact, a new so-called ‘meridian room’ was built<br />
in the 1820s (Alm, 1934), and the old ‘meridian room’ began to be used for other<br />
purposes. We assume that the barometer was placed in the old ‘meridian room’<br />
already in 1754, that this room was unheated all the time until 1840, and that the<br />
barometer remained in the same room until the end of 1861.<br />
5.3. REDUCTIONS TO SEA LEVEL <strong>PRESSURE</strong><br />
Most of this section is devoted to a description and discussion of how we performed<br />
the reductions to sea level perssures for data before 1859. We also briefly mention<br />
the reductions applied by us to the younger data when reductions were not already<br />
applied in the data sources.<br />
5.3.1. Effect of Changing Air Humidity<br />
The distance between the lower mercury surface and the brass scale on the Ekström<br />
barometer certainly varied somewhat with changing air humidity. Hence,<br />
we found it necessary to estimate how large this length change could have been.
194 <strong>AND</strong>ERS MOBERG ET AL.<br />
Our approach was to calculate the expected maximum average annual range of the<br />
length change using known properties of walnut wood (Boutelje and Rydell, 1995)<br />
combined with the average annual range of relative humidity (RH) in Stockholm<br />
1961–1990 (obtained from the SMHI). We reasoned as follows:<br />
The total length change from completely dry to completely moist walnut wood<br />
is between 0.4 to 0.5%. We use the average value of 0.45%. The equilibrium<br />
moisture content (EMC) for walnut is 18.5% at RH 90% and 11.5% at RH 60%.<br />
The monthly average RH in Stockholm varies between 65% (in May) and 88% (in<br />
November). In this interval we assume that a linear relation between EMC and RH<br />
can be used; i.e. an RH of 65% (88%) gives an EMC of 12.7% (18%), which in<br />
turn means that the actual maximum range of the EMC is 5.3%. We also assume<br />
a linear relation between length change and EMC. The EMC for completely moist<br />
wood for typical deciduous wood is 26%. We assume that this value is relevant for<br />
walnut. Given these values and assumptions, we estimate that the maximum length<br />
change of walnut wood is 5.3 × 0.45/26 = 0.09% in the actual RH-interval.<br />
With a maximum length change of the barometer frame of about 0.09%, the<br />
annual range of the change of the actual distance (25.3 sw.inch) is about 0.02<br />
sw.inch (≈0.8 hPa), wherefore the maximum error in neglecting the moisture effect<br />
is ±0.01 sw.inch (≈±0.4 hPa). As this is the smallest observable unit on the<br />
Ekström barometer, we consider the effect of changing humidity to be negligible.<br />
Consequently, no corrections had to be applied.<br />
It should be mentioned that our assumptions of linear relations do not hold<br />
for all purposes. For example, the linear relation between EMC and RH is very<br />
good for RH < 80%, but the EMC increases more rapidly for larger RH-values<br />
(cf. Camuffo, 1998; Cocheo and Camuffo, 2002). However, for an estimation of<br />
the maximum average effect on the Ekström barometer, we consider the linear<br />
approximations to be relevant.<br />
5.3.2. Correction for the Ratio between the Mercury Surface Areas<br />
On a barometer such as Ekström’s, with a short fixed scale placed at the upper<br />
mercury surface and a non-adjustable lower mercury surface, an observed change<br />
of the mercury height does not correspond exactly to the true length change of the<br />
mercury column. The reason is that when the level of the upper mercury surface<br />
changes, the lower surface also changes slightly, but in the opposite direction. An<br />
observed change of one length unit thus corresponds to a slightly larger real change.<br />
We measured the scale on the Ekström barometer and found that its unit is exactly<br />
the Swedish inch. This means that Ekström himself did not adjust the scale to<br />
compensate for the effect. Hence, it was necessary for us to apply a correction to<br />
the observed data. Our main problem was to find proper values of the areas of the<br />
two mercury surfaces.<br />
It is reasonable to assume that the barometer showed the mercury height correctly<br />
at 25.3 on the scale, as this value was specifically marked. Therefore, the
<strong>DAILY</strong> <strong>AIR</strong> <strong>TEMPERATURE</strong> <strong>AND</strong> <strong>PRESSURE</strong> <strong>SERIES</strong> FOR STOCKHOLM (1756–1998) 195<br />
following equation was used to convert the observed height (H obs )ofthemercury<br />
column (in sw.inch) to the true height in sw.inch (H sw. inch ):<br />
H sw. inch = f · (H obs − 25.3) + 25.3 ,<br />
(3a)<br />
where<br />
(<br />
f = 1 + a ) (<br />
π · r 2 )<br />
i<br />
= 1 +<br />
A π · (Ri 2 − ro 2) . (3b)<br />
In Equation (3b), a = area of upper mercury surface, A = area of lower<br />
mercury surface, r i = inner radius of glass tube, r o = outer radius of glass tube<br />
and R i = inner radius of mercury container. The inner and outer radii of the glass<br />
tube were measured in the X-ray image (Figure 10), and were found to be 3 mm<br />
and 4 mm respectively. The entire mercury container can unfortunately not be seen<br />
in the image because it is covered by a brass shield which cannot be removed. R i<br />
can therefore not be determined from the X-ray image. One can only say that R i<br />
can take any value between about 13 and 28 mm. This corresponds to values of the<br />
factor f in Equation (3) between 1.06 and 1.01. We decided to use R i = 28 mm, i.e.<br />
the maximum possible radius, giving f = 1.01, because it is likely that Ekström<br />
wanted to minimize the influence of level changes of the lower mercury surface.<br />
We applied Equation (3a) with f = 1.01 to all observed barometer values<br />
1756–1858 and then we converted these values to mm. This seems to be relevant<br />
for all cases when the Ekström barometer was used. If another barometer was used<br />
some short periods (which certainly happened, see Section 5.5.), another correction<br />
might have been more appropriate for these periods. With no explicit information<br />
available about any possibly different barometers, however, we found no reason to<br />
make other choices of correction.<br />
5.3.3. Reduction to 0 ◦ C and Conversion to hPa<br />
Reduction to 0 ◦ C, for the period 1756–1858, and at the same time conversion to<br />
pressure in hPa was made using the standard equation:<br />
p 0 = g 45 · ρ 0 · H T,mm · (1 − γ · T)· 10 −5 , (4)<br />
where p 0 = air pressure reduced to 0 ◦ CinhPa,g 45 = 9.80665 m · s −2 (normal<br />
gravity acceleration), ρ 0 = 13.5951 · 10 3 kg · m −3 (density of mercury at 0 ◦ C),<br />
H T,mm = corrected length of the mercury column (in mm) at temperature T (in<br />
◦ C), γ = 1.82 · 10 −4 K −1 (thermal expansion coefficient of mercury) ⋆ and T =<br />
barometer temperature (in ◦ C).<br />
We assumed that the Ekström barometer was correct at 0 ◦ C. This assumption<br />
is arbitrary, but it is the common case for modern barometers. If we introduced a<br />
⋆ The thermal expansion coefficient of brass (1.9 · 10 −5 K −1 ) was omitted because the maximum<br />
error of omitting this coefficient for the short brass scale on the Ekström barometer is about<br />
±0.03 hPa, which is negligible in this context.
196 <strong>AND</strong>ERS MOBERG ET AL.<br />
systematic error by making an incorrect assumption here, this error is likely to have<br />
been detected, and also corrected for, in the homogenization based on comparisons<br />
with pressure series from surrounding stations desribed in Section 5.4.<br />
As no barometer temperatures were observed before February 1785, we had to<br />
estimate them from the outdoor temperatures before Equation (4) could be used.<br />
As already mentioned, the barometer temperature 1785–1839 roughly followed the<br />
outdoor temperature, but with a certain delay. We assume that the conditions were<br />
the same 1756–1784, i.e. that the barometer was kept in an un-heated and well<br />
ventilated room.<br />
For the estimation of barometer temperatures (T ), we used low-pass filtered<br />
outdoor temperatures (T out, filtered ) as predictor in a simple linear regression model:<br />
T = a 1 · T out, filtered + a 0 . (5)<br />
This is essentially the same technique as used by Bärring et al. (1999). The model<br />
was used for estimating all barometer temperatures from 1756 to January 1785,<br />
and also in case of missing values from February 1785 to 1839.<br />
Before the regression coefficients and filter parameters in Equation (5) could be<br />
determined, the series of outdoor temperatures had to be made complete with three<br />
values per day. Each missing outdoor temperature was therefore estimated from the<br />
actual daily mean temperature by solving Equation (1) for the missing temperature.<br />
The model parameters were determined for the calibration period 1810–1839<br />
and tested on the 24-year validation period 1786–1809. We studied the bias and<br />
root-mean-square error for various choices of filters and time lags between outdoor<br />
and barometer temperatures (all data were arranged sequentially; T morning , T noon ,<br />
T evening , T next morning , etc.). The final choice of filter was a one-tailed gaussian lowpass<br />
filter with standard deviation of 10 (i.e., 50% of the variability is suppressed<br />
for periods
<strong>DAILY</strong> <strong>AIR</strong> <strong>TEMPERATURE</strong> <strong>AND</strong> <strong>PRESSURE</strong> <strong>SERIES</strong> FOR STOCKHOLM (1756–1998) 197<br />
where p 0g = pressure at station altitude reduced to 0 ◦ C and normal gravity, and<br />
g ϕ = 9.81907 m·s −2 (gravity at station latitude 59 ◦ 21 ′ N). Data from 1921 onwards<br />
had already been reduced to normal gravity by SMHI or its predecessor.<br />
Reduction to sea level pressure 1756–1960 was made using the relation:<br />
( ) gϕ·z<br />
R<br />
p 0g0 = p 0g · e d ·Tm<br />
, (7)<br />
where p 0g0 = air pressue reduced to 0 ◦ C, normal gravity and sea level, z =<br />
barometer altitude in m, R d = 287.04 J · K −1 · kg −1 (gas constant for dry air)<br />
and T m = mean temperature in K in the fictitious air column between station level<br />
and sea level. T m was estimated from the observed outdoor temperature, assuming<br />
a lapse rate of 0.6 ◦ C per 100 m.<br />
During 1756–1760, outdoor temperatures were observed only at sunrise and<br />
noon, whereas the barometer was observed in the morning and evening. Evening<br />
outdoor temperatures for this early period were estimated simply by taking the<br />
average between the noon and following morning temperature. The barometer altitude<br />
in different sub-periods was set according to the values in Table IV. Data from<br />
1961 onwards had already been reduced to sea level by the SMHI, although with a<br />
different method (see Bärring et al., 1999). The difference between the methods is<br />
negligible here as the station is situated quite near sea level.<br />
5.4. HOMOGENIZATION OF THE SEA LEVEL <strong>PRESSURE</strong> <strong>SERIES</strong><br />
The procedures described in Section 5.3 were used to create a raw daily sea level air<br />
pressure series. From these daily values, monthly and annual mean pressure series<br />
were calcultated. The annual series (Figure 11a) exhibits an irregular behaviour<br />
with a number of multi-decade long periods with mean values differing by several<br />
hPa. Such large pressure differences between various sub-periods can hardly be<br />
expected to occur for natural reasons. It is thus evident that the raw series is not<br />
homogeneous.<br />
In order to test the homogeneity of the raw Stockholm pressure series and<br />
to find the size of the necessary adjustments, we applied the standard normal<br />
homogeneity test for single shifts (Alexandersson, 1986). Pressure series from a<br />
number of surrounding stations were used as reference data (see Table V). For<br />
the most recent period, 1966–1998, data from two nearby Swedish coastal stations<br />
were used as reference. Both records are considered as homogeneous (Hans<br />
Alexandersson, SMHI, personal comm.). For the period 1890–1990 we used seven<br />
Scandinavian series selected from the homogeneity tested North Atlantic Climatic<br />
Data Set (Frich et al., 1996). For 1822–1995 we used six European series from<br />
the data set obtained within ADVICE (Jones et al., 1999). The longest period for<br />
which a reasonably reliable reference series can be found is 1780–1995. For this<br />
period we used data for the gridpoint 60 ◦ N20 ◦ E in the ADVICE data set (Jones<br />
et al., 1999). To search for abrupt changes in the period before 1780, when no
198 <strong>AND</strong>ERS MOBERG ET AL.<br />
Figure 11. Annual mean sea level pressure in Stockholm 1756–1998. (a) Before homogenization. (b)<br />
After homogenization. The homogenized sea level pressures for Uppsala are shown with grey lines in<br />
B for comparison. The horizontal line in each plot represent the mean pressure for the homogenized<br />
series (1012.4 hPa).<br />
relevant reference series is available, we applied the homogeneity test directly to<br />
the Stockholm pressure series itself.<br />
The homogeneity test was applied for several sub-periods to identify all time<br />
points of abrupt changes. For each statistically significant break, the observation<br />
journal and/or the station reports were inspected to look for a relevant explanation<br />
and to find, if possible, the exact date for changed conditions. If the exact date of a<br />
change was not explicitly given by the metadata, the most likely date for a change<br />
was instead determined from a direct comparison with the simultaneously developed<br />
daily Uppsala pressure series (Bergström and Moberg, 2002). The Uppsala<br />
series was, however, never used for determination of the size of any corrections, as<br />
we strived at homogenizing the two series independently as far as possible.<br />
The results of the homogeneity tests showed that after 22 August 1879 the data<br />
was homogeneous except for a few short periods, whereas all older data had to be<br />
corrected. For the period when reference series were available, i.e., back to 1780,<br />
corrections were applied so as to keep the pressure difference between Stockholm
<strong>DAILY</strong> <strong>AIR</strong> <strong>TEMPERATURE</strong> <strong>AND</strong> <strong>PRESSURE</strong> <strong>SERIES</strong> FOR STOCKHOLM (1756–1998) 199<br />
Table V<br />
Reference series used for homogeneity tests of the Stockholm air pressure series. The abbreviations<br />
(NACD7, ADVICE6) defined here are used in Table VI<br />
Period Reference stations Comments<br />
1780–1995 Gridpoint 60 ◦ N20 ◦ E Gridpoint data from the ADVICE data<br />
set (Jones et al. 1999).<br />
1822–1995 ADVICE6: Six European stations from the<br />
Trondheim, Lund, Gdansk ADVICE data set (Jones et al., 1999).<br />
Bergen, Oslo, St. Petersburg<br />
1890–1990 NACD7: Seven Scandinavian stations from the<br />
Visby, Kalmar, Göteborg<br />
North Atlantic Climatic Data set<br />
Oslo-Blindern, Vaernes/Trondheim (NACD) (Frich et al., 1996).<br />
Härnösand, Helsinki<br />
1966–1998 Svenska Högarna Swedish coastal stations situated on<br />
Landsort<br />
islands ≈70–80 km east of Stockholm.<br />
Data considered homogeneous (Hans<br />
Alexandersson, SMHI, personal<br />
comm.).<br />
and the respective reference data being the same as for the homogeneous part<br />
after September 1879. To find corrections for the data before 1780, we added the<br />
criterion that the mean value of the Stockholm pressures before 1780 should be the<br />
same as that for 1780–1998.<br />
A graphical view of the character of inhomogeneities in the raw Stockholm<br />
pressure series is presented in Figure 12a, which shows an annual time series of<br />
the difference in pressure between Stockholm and the gridpoint 60 ◦ N20 ◦ E. The<br />
estimated biases, i.e., the corrections applied to homogenize the series, are also<br />
shown. Details of the corrections (their numerical values, the exact periods to which<br />
they were applied, and probable explanations for the inhomogeneities) are given in<br />
Table VI. A discussion of the results is presented in Section 5.5. The effect of the<br />
corrections can be seen by comparing the b-parts of Figures 11 and 12 with their<br />
a-parts. Figure 11b also shows the annual record for the homogenized Uppsala<br />
pressures. The interannual variability is obviously very similar in the two final<br />
reconstructions.<br />
From the corrected data, daily mean pressures were calculated simply by taking<br />
the arithmetic mean value of the instantaneous values each day. To make the daily<br />
series complete, it was necessary to fill in missing data for 131 days, of which most<br />
occur before 1770. A majority of these values (105) were estimated from Uppsala
200 <strong>AND</strong>ERS MOBERG ET AL.<br />
Figure 12. Difference in annual mean sea level pressure between Stockholm and the gridpoint 60 ◦ N<br />
20 ◦ E (Jones et al. 1999b). (a) Before homogenization. (b) After homogenization. The grey curve in<br />
(a) shows the correction constants given in Table VI as a time series (but with opposite signs).<br />
using a linear regression relation. The remainder (26) was filled in through linear<br />
interpolation between the pressure for neighbouring days.<br />
5.5. COMMENTS TO THE HOMOGENEITY TEST RESULTS<br />
Concerning the period 1756–1858, the assumed period for the Ekström barometer,<br />
there are several sub-periods with different biases. The results suggest that the bias<br />
originally was only –0.6 hPa, indicating that the instrument was well made and that<br />
our assumptions concerning reductions (Section 5.3) were essentially relevant. An<br />
abrupt change to a bias of +1.8 hPa occurred in March 1774. The reason for this<br />
is entirely unknown. The bias was thereafter between +1.8 and +1.4 hPa until November<br />
1839, except for two sub-periods (1803–1808, 1821–1824) with markedly<br />
different biases. The latter sub-period began with two weeks of missing data in October<br />
1821 and ended with two days in July 1824 having double observations. This<br />
suggests that the Ekström barometer (still assuming this one was used) went out of<br />
order in October 1821 and was sent for restoration. Another barometer (with bias<br />
+4.5 hPa) was probably used until July 1824. The situation may have been similar<br />
1803–1808, although a different barometer (with bias +0.5 to –1.4 hPa) could have<br />
been used. From November 1839 to August 1843 the bias was +4.3 hPa (nearly
<strong>DAILY</strong> <strong>AIR</strong> <strong>TEMPERATURE</strong> <strong>AND</strong> <strong>PRESSURE</strong> <strong>SERIES</strong> FOR STOCKHOLM (1756–1998) 201<br />
Table VI<br />
Estimated biases in the observed Stockholm pressure series. These data were used as a basis<br />
for homogenizing the series. Comments are given concerning the basis for determining biases<br />
and exact dates for start/end of each period. The abbreviations NACD7 and ADVICE6<br />
refer to groups of reference stations as defined in Table V. The letters (m, n, e) indicate if a<br />
period starts/ends with the morning, noon or evening observation. An absence of such a label<br />
indicates that a period starts with morning and ends with evening observation<br />
Time period Bias Comment<br />
(hPa)<br />
1756.01.01– –0.6 Significant abrupt shift of internal mean pressure in the<br />
1774.02.28 Stockholm series. Correction applied to adjust the earliest data<br />
to the average pressure of the rest of the homogenized series<br />
(1012.4 hPa).<br />
1774.03.01– +1.8 Bias: obtained from comparison with gridpoint 60 ◦ N20 ◦ E.<br />
1803.11.08 End of period: obtained from comparison with Uppsala.<br />
1803.11.09– +0.5 Bias: comparison with gridpoint 60 ◦ N20 ◦ E.<br />
1806.01.07 End of period: comparison with Uppsala.<br />
1806.01.08– –1.4 Bias: comparison with gridpoint 60 ◦ N20 ◦ E.<br />
1808.02.29 End of period: comparison with Uppsala.<br />
1808.03.01– +1.7 Bias: comparison with gridpoint 60 ◦ N20 ◦ E.<br />
1821.11.29 End of period: comparison with Uppsala.<br />
1821.11.30– +4.5 Bias: comparison with gridpoint 60 ◦ N20 ◦ E.<br />
1824.07.15n<br />
End of period: comparison with Uppsala.<br />
No barometer data 1821.10.14–1821.10.31 suggest problems<br />
with barometer and a possible barometer change.<br />
Double observations 1824.06.24–25 suggest that two different<br />
barometers were used. Maybe the observers started to use the<br />
same barometer as in the previous period, and made double<br />
observations for comparison.<br />
1824.07.15e– +1.4 Bias: comparison with ADVICE6.<br />
1839.11.15 End of period: comparison with Uppsala.<br />
1839.11.16– +4.3 Bias: comparison with ADVICE6.<br />
1843.08.12 End of period: comparison with Uppsala.<br />
Start of period is close in time to abrupt change from ‘outdoor’<br />
to ‘indoor’ type of barometer temperature in 1840.01.09.<br />
End of period coincides with temporary change from ‘indoor’<br />
to ‘outdoor’ behaviour of barometer temperature.<br />
1843.08.13– +0.6 Bias: comparison with ADVICE6.<br />
1851.05.31 End of period: comparison with Uppsala.
202 <strong>AND</strong>ERS MOBERG ET AL.<br />
Time period Bias Comment<br />
(hPa)<br />
Table VI<br />
(Continued)<br />
Notes in observation register reveal that Ekström’s<br />
barometer was used from April 1844, when a barometer by<br />
Littman had been used for about one month.<br />
1851.06.01– Trend Bias: comparison with ADVICE6.<br />
1855.05.31 from Start and end of period: comparison with Uppsala.<br />
+0.6 to The trend-like behaviour of bias suggested by comparison<br />
–1.7 with Uppsala.<br />
1855.06.01– –1.7 Bias: comparison with ADVICE6.<br />
1858.12.31 End of period: New barometer probably installed 1859.01.01<br />
as barometer unit changed that day.<br />
1859.01.01– –0.2 Bias: comparison with ADVICE6.<br />
1869.11.30 End of period: comparison with Uppsala.<br />
1869.12.01– –1.0 Bias: comparison with ADVICE6.<br />
1879.08.21 End of period: comparison with Uppsala.<br />
1879.08.22m– 0<br />
1914.12.09<br />
1914.12.10– –0.8 Bias: comparison with NACD7.<br />
1916.01.15 Start and end of period: comparison with Uppsala.<br />
1916.01.16m– 0<br />
1937.01.20n<br />
1937.01.20e– –0.5 Bias: from inspection report 1938.03.07.<br />
1938.03.07n<br />
Start of period: comparison with Uppsala.<br />
End of period: from inspection report 1938.03.07.<br />
Remarks in inspection report 1938.03.07 that the barometer<br />
probably became biased after having been moved from one<br />
room to another early in 1937.<br />
1938.03.07e– 0<br />
1981.12.31<br />
1982.01.01– –0.4 Bias: from inspection report 1985.10.08.<br />
1985.10.08m<br />
Start of period: comparison with Uppsala.<br />
End of period: from inspection report 1985.10.08.<br />
New barometer was installed 1980-05-22; instrument was<br />
biased when controlled 1985.10.08.
<strong>DAILY</strong> <strong>AIR</strong> <strong>TEMPERATURE</strong> <strong>AND</strong> <strong>PRESSURE</strong> <strong>SERIES</strong> FOR STOCKHOLM (1756–1998) 203<br />
Time period Bias Comment<br />
(hPa)<br />
Table VI<br />
(Continued)<br />
1985.10.08n– –0.5 Bias: from inspection report 1991.02.01.<br />
1991.02.01m End of period: from inspection report 1991.02.01.<br />
New barometer installed 1985.10.08; instrument was biased<br />
when controlled 1991.02.01.<br />
1991.02.01n– 0 New barometer installed 1991-02-01.<br />
1996.09.09m<br />
1996.09.09n– –0.5 Bias: from comparison with Svenska Högarna and Landsort.<br />
1998.12.31 Start of period: New barometer 1996-09-09.<br />
Homogeneity tests strongly indicate that the instrument is<br />
biased. The bias is uncertain, being based on only two years.<br />
the same as 1821–1824), suggesting another period when the Ekström barometer<br />
might have been substituted. The start of this anomalous period coincides closely<br />
in time with a change of the barometer temperature from an ‘outdoor’ type to an<br />
‘indoor’ type. The end of the same period coincides with a temporary return back<br />
to ‘outdoor’ temperatures, so clearly some kind of change took place within this<br />
period. Furthermore, some very interesting remarks are found in the journals of<br />
March and April 1844. On 12 March there is a statement that observations were<br />
made on ‘Littman’s barometer’, whereas it is stated on 9 April: “began to observe<br />
Ekström’s barometer”. This note is the only real proof that Ekström’s barometer<br />
was actually used. These few remarks in the observation journal, together with the<br />
results from the homogeneity tests, are considered as support for the assumption<br />
that Ekström’s barometer was actually used most of the time from 1754 to 1858,<br />
and that it was replaced with other barometers during a few short time periods.<br />
From August 1843 to May 1851 the bias was +0.6 hPa. The homogeneity tests<br />
then suggest a gradual, rather than abrupt, change to a bias of –1.7 hPa in June<br />
1855. The bias was thereafter –1.7 hPa to the end of 1858. There is no hint in the<br />
journals of any reason for this behaviour near the end of the supposed period of<br />
Ekström’s barometer.<br />
The homogeneity tests confirm that 1859 was the beginning of a new period.<br />
According to the results the bias was only –0.2 hPa from January 1859 to December<br />
1869. Thereafter, the bias was –1.0 hPa until 22 August 1879. Since this date, the<br />
bias is zero nearly all the time until January 1982. After 1982, there is generally a<br />
bias of around –0.5 hPa. The station inspection reports confirm problems with the<br />
barometers in this most recent period.
204 <strong>AND</strong>ERS MOBERG ET AL.<br />
5.6. DISCUSSION OF THE SEA LEVEL <strong>PRESSURE</strong> <strong>SERIES</strong><br />
We have reconstructed a series of daily mean sea level air pressures for Stockholm<br />
from the original observational data. Performing the reductions to sea level before<br />
1859 was the most difficult part of the work, because little is known about the<br />
properties of the used barometers and their positions. Furthermore, no barometer<br />
temperatures were observed before 1785, so these values had to be estimated<br />
from outdoor temperatures. Comparisons with data from other European stations<br />
reveal that the air pressure values for Stockholm, as calculated directly from the<br />
observations, exhibit several sub-periods with various systematic biases. A homogenization<br />
was therefore done by adding certain corrections obtained from<br />
homogeneity tests. The homogenization is expected to correct for most of the<br />
systematic errors in the original data, and also for possible systematic errors introduced<br />
by us whenever we made wrong assumptions concering the properties of<br />
the early barometers and conditions around the observations.<br />
A plot (Figure 11b) of the homogenized annual mean pressures back to 1756<br />
for both Stockholm and Uppsala (Bergström and Moberg, 2002) shows that the<br />
year-to-year variability is very similar in these two series. The similarity is even<br />
more striking in plots of daily air pressures. Two examples of time-series plots of<br />
daily pressures in selected years (1788 and 1819) are shown in Figure 13. The plots<br />
illustrate that the day-to-day pressure changes is almost identical in the two series.<br />
This is to be expected for two such nearby stations. Other selections of years (not<br />
shown) reveal the same high degree of similarity. This is a very good indicator that<br />
both records are very reliable reconstructions of daily air pressures. In particular,<br />
the data can be used with a high degree of credibility as input for drawing pressure<br />
charts over Europe for any particular day.<br />
Regarding long-term trends (multi-decadal scales), the reliability of the data<br />
must be considered as lower than for the conditions in individual days. This is<br />
rather obvious because the pressure difference between various multi-decade long<br />
periods is small in comparison with many of the errors in the observed data.<br />
Furthermore, the homogenization of the long-term trends was largely based on<br />
comparison with data for surrounding stations, which means that the reliability of<br />
trends is dependent on the quality of the reference data.<br />
The reliability of trends is regarded as very high back to 1890, where the homogenization<br />
was based on comparisons with the NACD data set of Frich et al. (1996).<br />
This data set consists of a large number of series which have been homogeneity<br />
tested and maintained by the national meteorological services in several countries.<br />
Although we used homogenized reference data back to 1780, the reliability of<br />
pressure trends before 1890 must be expected to decrease further back in time.<br />
This is because the reference data we used (from Jones et al., 1999) had, in their<br />
turn, been homogenized based on comparisons with fewer and fewer surrounding<br />
stations further and further back in time. Finally, the Stockholm pressure series<br />
can not be used at all for studies of changes in pressure trends before 1780, as the
<strong>DAILY</strong> <strong>AIR</strong> <strong>TEMPERATURE</strong> <strong>AND</strong> <strong>PRESSURE</strong> <strong>SERIES</strong> FOR STOCKHOLM (1756–1998) 205<br />
Figure 13. Daily mean air temperatures and sea level pressures for Stockholm (black) and Uppsala<br />
(grey) for two selected years, 1788 and 1819.<br />
oldest part was homogenized by assuming that the mean value before 1780 should<br />
be the same as that afterwards. Nevertheless, these earliest data still seem to be<br />
reliable for reconstructions of weather patterns, drawing of synoptic charts, etc. for<br />
individual days.<br />
6. Concluding Remarks<br />
Reconstruction of a 250-year-long daily meteorological record is a time-consuming<br />
work. In our case, it included not only the pure calculations leading to the final daily<br />
values, but also digitizing of the original data, detective work for identification and<br />
correction of various kinds of errors and making reasonable assumptions when<br />
basic information about important conditions was missing. We found it extremely<br />
valuable to have access to parallell data for the neighbouring station in Uppsala<br />
(65 km north of Stockholm), described by Bergström and Moberg (2002). Because<br />
of the possibility to compare the two series, many errors in individual temperature
206 <strong>AND</strong>ERS MOBERG ET AL.<br />
or pressure values as well as systematic biases could rather easily be identified and<br />
then corrected.<br />
The similarity between the two series can be illustrated by plots of both the<br />
daily temperature and pressure data for any selected year. We show two such examples<br />
for 1788 and 1819 in Figure 13. These specific years were selected to show<br />
examples of years with extreme temperatures. 1788 (1819) was one of the years<br />
with most frequent cold winter days (hot summer days) in the Stockholm series.<br />
The similarity between the series is striking, and there is no doubt that data for both<br />
stations show very well how the temperature and pressure changed from day to day.<br />
The overall impression is that both stations have data which, in their homogenized<br />
form, should be very reliable for many types of analyses of weather patterns in<br />
Europe for individual days back to the 1750s. Therefore, they are of great value<br />
for both pure climatological and meteorological research and for scientists who<br />
need to know the particular weather conditions in periods of particular historical<br />
interest, such as wars or periods of famine.<br />
We emphasise, however, that the series are not perfect. There is a general lower<br />
reliability of the data older than the mid-19th century compared with the younger<br />
data. The reason is a combination of factors such as less strict routines for observational<br />
procedures, a general lack of information about these procedures and<br />
about the instruments and instrument positions, lower instrument quality, poorer<br />
instrument positions, etc. Furthermore, there are problems also with the most recent<br />
data. For example, the corrections for the urban warming trend in the late part of<br />
the temperature series were determined only on a monthly basis. It may be possible<br />
to refine this correction by separation of the data into classes according to weather<br />
type, such as cloudiness, wind direction, humidity etc. Such an analysis would<br />
require the availability of long daily series for several surrounding stations too. At<br />
present, however, such data do not exist in computer readable form.<br />
Finally, we stress the need for further long daily meteorological time series to be<br />
reconstructed from the original observational data at as many sites as possible. The<br />
larger the available data set, the better the possibilities to distinguish imperfections<br />
in the data from true weather and climate variability. This in turn would lead to<br />
improved conditions for all climatic research aimed at understanding the nature<br />
of natural climate behaviour on the daily time scale and at distinguishing natural<br />
climate changes from man-made changes.<br />
Acknowledgements<br />
This study was undertaken within the EC Framework IV Environment and Climate<br />
Programme project IMPROVE (Contract No: ENV4-CT97-0511, co-ordinator:<br />
Dario Camuffo, Consiglio Nazionale delle Ricerche, CNR-ISAC, Padova, Italy).<br />
The work was also funded by the Swedish Environmental Protection Agency under<br />
contract 011-120-98-01. Some of the information presented here had been
<strong>DAILY</strong> <strong>AIR</strong> <strong>TEMPERATURE</strong> <strong>AND</strong> <strong>PRESSURE</strong> <strong>SERIES</strong> FOR STOCKHOLM (1756–1998) 207<br />
collected during the last decade and many individuals have been very helpful<br />
in different ways. We thank in particular: Bengt Dahlström, Haldo Vedin, Hans<br />
Alexandersson, Peter Svensson and Krister Boqvist (all at the SMHI), Christer<br />
Wijkström (Royal Swedish Academy of Sciences), Olle Amelin (Office for History<br />
and Science, Uppsala University), Inga Elmqvist (Stockholm Observatory<br />
Museum), Maria Brunskog (Stockholm City Museum), Ingvar Johansson (Swedish<br />
Institute for Wood Technology Research) and Birgitta Björling (Dept. of Meteorology,<br />
Stockholm University). Lars Bärring’s thorough review comments helped at<br />
lot to improve the paper. Financial support before IMPROVE started was given<br />
by Carl Mannerfelts fond, Andréefonden and Axel Lagrelius’ fond för geografisk<br />
forskning.<br />
Appendix<br />
This appendix gives a description of how the -values and f cl factors in Equation<br />
(1) were obtained.<br />
MODEL FOR THE DIURNAL <strong>TEMPERATURE</strong> CYCLE<br />
To determine the -values to be used in Equation (1) we used ninety years (1869–<br />
1958) of hourly temperature observations from Uppsala as a basis, as we consider<br />
the diurnal temperature cycle in Uppsala to be representative for Stockholm if its<br />
amplitude is scaled with respect to the climatic difference and its phase is adjusted<br />
for the small time difference between the longitudes (1 min 44 s).<br />
Here we are interested only in the deviations of instantaneous temperatures from<br />
the average daily mean temperatures, and not of absolute temperatures. The diurnal<br />
cycle of these deviations is abbreviated DC. In order to avoid small irregularities<br />
in the DC curves, which may be due to micro-climatic conditions specifically related<br />
to conditions at Uppsala, they were smoothed using Fourier series with four<br />
harmonics.<br />
For each month, m (1 ≤ m ≤ 12), the DC for Stockholm can be expressed as<br />
where<br />
DC m (h) =<br />
4∑<br />
n=1<br />
A (S)<br />
m,n = f m · A (U)<br />
m,n .<br />
A (S)<br />
m,n<br />
(2π · cos n<br />
)<br />
· h ·<br />
24 + ω m,n , (A.1a)<br />
(A.1b)<br />
In these equations, h is the hour (CET decimal hour, 0 ≤ h ≤ 24), A is the amplitude<br />
of each harmonic (with the superscripts (S) and (U) denoting Stockholm and<br />
Uppsala). The amplitudes A (U)<br />
m,n and phase angles ω m,n (the latter with the appropriate<br />
phase shift) were determined from the Uppsala data. The scaling factor, f m ,
208 <strong>AND</strong>ERS MOBERG ET AL.<br />
Figure A.1. Model of the diurnal temperature cycle (with the mean value subtracted) for the old astronomical<br />
observatory in Stockholm. The dots represent the averages for the three daily observations<br />
in the periods 1785–1796 and 1816–1858.<br />
is determined by Equation (A.2). The twelve monthly average DCs for Stockholm<br />
are illustrated in Figure A.1. The amplitudes A (S)<br />
m,n and phase angles ω m,n are listed<br />
in Table A.I.<br />
The scaling factors, f m , were determined for each month, m, by calculating the<br />
ratio<br />
f m = (T 14 − T 21 ) (S)<br />
m<br />
(T 14 − T 21 ) (U)<br />
m<br />
where (T 14 − T 21 ) (S)<br />
m<br />
+ (T 14 − T 06 ) (S)<br />
m<br />
+ (T 14 − T 06 ) (U)<br />
m<br />
, (A.2)<br />
is the average difference between temperature readings at 14<br />
and 21 in Stockholm during the combined periods 1785–1796 and 1816–1858.<br />
(T 14 − T 06 ) (S)<br />
m is the corresponding difference for observations at 14 and 06. These<br />
periods were selected to ensure that the largest possible amount of data for Stockholm<br />
with constant observation hours was used. The entries in the denominator are<br />
the corresponding differences for Uppsala 1869–1958.<br />
A monthly average -value can be obtained for an arbitrary hour, h,inagiven<br />
month, m, simplyas =−DC m (h). From monthly average -values for each
<strong>DAILY</strong> <strong>AIR</strong> <strong>TEMPERATURE</strong> <strong>AND</strong> <strong>PRESSURE</strong> <strong>SERIES</strong> FOR STOCKHOLM (1756–1998) 209<br />
Table A.I<br />
Amplitudes and phase angles for the diurnal temperature cycle model in Equation (A.1a)<br />
m A m,1 A m,2 A m,3 A m,4 ω m,1 ω m,2 ω m,3 ω m,4<br />
1 0.5093 0.2307 0.1133 0.0448 2.2737 –0.8933 2.2683 –1.0848<br />
2 1.1681 0.4701 0.1264 0.0111 2.2879 –0.9305 2.1689 1.5211<br />
3 2.1912 0.5599 0.0712 0.1267 2.3480 –0.8125 –0.9984 2.1086<br />
4 3.1591 0.3262 0.2976 0.0598 2.4842 –0.4343 –0.8210 –3.6163<br />
5 3.6186 0.2704 0.3266 0.0898 2.5459 1.6497 –0.5030 –1.3586<br />
6 3.5582 0.4232 0.2317 0.1142 2.5555 2.1085 –0.3625 –1.0308<br />
7 3.3622 0.3024 0.2668 0.1104 2.5467 1.9162 –0.5663 –1.2631<br />
8 3.1367 0.1490 0.3601 0.0487 2.5495 0.0708 –0.7681 –2.5181<br />
9 2.4767 0.5166 0.2108 0.1438 2.5345 –0.6095 –0.7934 –3.7209<br />
10 1.3443 0.4909 0.0629 0.0662 2.5415 –0.6125 –3.4985 –3.7196<br />
11 0.5470 0.2784 0.1161 0.0322 2.5097 –0.6967 –3.6485 –0.8435<br />
12 0.3001 0.1543 0.0741 0.0405 2.4199 –0.7472 –3.7739 –0.9073<br />
integer hour (0, 1, 2,...,23), daily -values were determined by cubic convolution<br />
interpolation (Keys, 1981) between the monthly -values. Hence, a 365 × 24<br />
matrix was obtained, containing -values for all integer hours of the year. Finally,<br />
when using Equation (1) for estimation of daily mean temperatures, a linear interpolation<br />
between the hourly -values for a particular day was used in cases when<br />
observations were not made at exact hours.<br />
SCALING OF DIURNAL <strong>TEMPERATURE</strong> CYCLE AMPLITUDE WITH RESPECT TO<br />
CLOUD AMOUNT<br />
Before the f cl factors in Equation (1) could be determined, each cloud observation<br />
was assigned a number corresponding to a cloud cover in tenths. Data for<br />
1873–1960 were given in tenths already in the source. Data for 1961–1998 and<br />
1859–1872 were simply translated from eights and fourths respectively. The conversion<br />
to tenths of data from before 1859 involved an interpretation of the various<br />
notes and symbols used. In the few cases when no cloud observations had been<br />
reported, the gaps were filled in subjectively using information from the other<br />
observed weather variables and the cloud amount in the nearest days. Daily average<br />
cloud cover values, rounded to integer tenths, were then calculated. Finally, each<br />
day was classified as a ‘clear’ (0–3 tenths), ‘half-clear’ (4–7 tenths) or ‘cloudy’<br />
(8–10 tenths) day.
210 <strong>AND</strong>ERS MOBERG ET AL.<br />
Table A.II<br />
Monthly values of amplification factors for the amplitudes<br />
of the diurnal temperature cycle model in<br />
Equation (A.3)<br />
m<br />
f clear<br />
cl<br />
f half clear<br />
cl<br />
f cloud<br />
cl<br />
1 1.1482 1.1407 0.9126<br />
2 1.2374 1.1128 0.8787<br />
3 1.2960 1.0951 0.7731<br />
4 1.2485 1.0597 0.7611<br />
5 1.2046 1.0224 0.7711<br />
6 1.2024 1.0107 0.7690<br />
7 1.1988 1.0173 0.7947<br />
8 1.2447 1.0129 0.8018<br />
9 1.2045 1.0275 0.8255<br />
10 1.2547 1.1060 0.8540<br />
11 1.2009 1.1625 0.8899<br />
12 1.2068 1.2045 0.8980<br />
Figure A.2. Amplification factors for the amplitude of the diurnal temperature cycles (in Figure A.1)<br />
as a function of Julian day. The dots represent the monthly averages determined from the data<br />
for three cloudiness classes. The curves are obtained by cubic interpolation between the monthly<br />
averages.
<strong>DAILY</strong> <strong>AIR</strong> <strong>TEMPERATURE</strong> <strong>AND</strong> <strong>PRESSURE</strong> <strong>SERIES</strong> FOR STOCKHOLM (1756–1998) 211<br />
Scaling factors, f cl , were then determined for each class and for each month (all<br />
Januaries, all Februaries etc., separately) from the relation<br />
cloud class<br />
fcl<br />
= (t cloud class<br />
max − t min )<br />
, (A.3)<br />
(t max − t min ) all data<br />
where ‘cloud class’ refers to one of the classes ‘clear’, ‘half clear’ or ‘cloudy’,<br />
using data for 1859–1960; ‘all data’ denotes all data for the same period. This is the<br />
longest possible period with T max and T min measured at the north-facing wall. The<br />
scaling factors are thus thought to be representative also for the conditions before<br />
1859, i.e., the period for which Equation (1) was used and when the thermometer<br />
always was placed on a north-facing wall. Monthly averages of the scaling factors<br />
are listed in Table A.II. Daily scaling factors (Figure A.2) were obtained by cubic<br />
interpolation between the monthly values.<br />
References<br />
Literature (after 1900)<br />
Alexandersson, H.: 1986, ‘A Homogeneity Test Applied to Precipitation Data’, Int. J. Clim. 6, 661–<br />
675.<br />
Alexandersson, H. and Moberg, A.: 1997, ‘Homogenization of Swedish Temperature Data. Part I:<br />
Homogeneity Test for Linear Trends’, Int. J. Clim. 17, 25–34.<br />
Alm, H.: 1982, Stockholms observatorium. Geografisk institution vid Stockholms universitet sedan<br />
1934, Informationsenheten, Stockholms universitet, Stockholm, p. 173. (Reprinted from: Samfundet<br />
S:t Eriks årsbok, 1930).<br />
Bärring, L., Jönsson, P., Achberger, C., Ekström, M., and Alexandersson, H.: 1999, ‘The Lund Instrumental<br />
Record of Meteorological Observations: Reconstruction of Monthly Sea-Level Pressure<br />
1780–1997’, Int. J. Clim.. 19, 1427–1443.<br />
Bergström, H. and Moberg, A.: 2002, ‘Daily Air Temperature and Pressure Series for Uppsala (1722–<br />
1998)’, Clim. Change, this volume.<br />
Boutelje, J. B. and Rydell, R.: 1995, Träfakta – 44 träslag i ord och bild, Trätek, Institutet för<br />
träteknisk forskning, 3rd edn., Stockholm, p. 80.<br />
Camuffo, D.: 1998, Microclimate for Cultural Heritage, Elsevier, Amsterdam, p. 415.<br />
Cocheo, C. and Camuffo, D.: 2002, ‘Corrections of Systematic Errors and Data Homogenisation in<br />
the Daily Temperature Padova Series (1725–1998)’, Clim. Change, this volume.<br />
Ekholm, N.: 1916, Beräkning av luftens månadsmedeltemperatur vid de svenska meteorologiska stationerna,<br />
Bihang till Meteorologiska iakttagelser i Sverige, Band 56, 1914, Almqvist & Wiksell,<br />
Stockholm, p. 110.<br />
Ekström, M.: 1995, En jämförelse av mätplatser för temperaturobservationer vid Stockholms<br />
gamla observatorium, Fil. Mag. examensarbete i geovetenskap, Naturgeografiska institutionen,<br />
Stockholms universitet, p. 45. (Unpublished undergraduate thesis).<br />
Eriksson, B.: 1980a, Statistisk analys av nederbördsdata. Del III. 200-åriga nederbördsserier, SMHI<br />
Reports Meteorology and Climatology 27, p. 54. (English summary).<br />
Eriksson, B.: 1980b, Noggrannheten vid beräkning av dygnsmedelvärden, Meddelande nr. 4, 1980,<br />
Sveriges Meteorologiska och Hydrologiska Institut, Klimatbyrån, p. 13.<br />
Frich, P., Alexandersson, H., Ashcroft, J., Dahlström, B., Demarée, G., Drebs, A., van Engelen,<br />
A. F. V., Førland, E. J., Hanssen-Bauer, I., Heino, R., Jónsson, T., Jonasson, K., Keegan, L.,<br />
Nordli, P.Ø., Schmith, T., Steffensen, P., Tuomenvirta, H., and Tveito, O. E.: 1996, North Atlantic<br />
Climatological Dataset (NACD Version 1) – Final Report, Danish Meteorological Institute,<br />
Scientific Report 96-1, DMI, Copenhagen, p. 47 + appendices.<br />
Hamberg, H. E.: 1906, ‘Moyennes mensuelles et annuelles de la température et extrêmes de température<br />
mensuels pendant les 150 années 1756–1905 à l’observatoire de Stockholm’, Kungl.<br />
Vetenskapsakademiens Handlingar 40 (1), 1–60.
212 <strong>AND</strong>ERS MOBERG ET AL.<br />
Jones, P. D., Davies, T. D., Lister, D. H., Slonosky, V., Jónsson, T., Bärring, L., Jönsson, P., Maheras,<br />
P., Kolyva-Machera, F., Barriendos, M., Martín-Vide, J., Rodríguez, R., Alcoforado, M. J., Wanner,<br />
H., Pfister, C., Luterbacher, J., Rickli, R., Schuepbach, E., Kaas, E., Schmith, T., Jacobeit,<br />
J., and Beck, C.: 1999, ‘Monthly Mean Pressure Reconstructions for Europe for the 1780–1995<br />
Period’, Int. J. Clim. 19, 347–364.<br />
Jones, P. D. Briffa, K. R. Osborn, T. J. Moberg, A., and Bergström, H.: 2001, ‘Relationships between<br />
Circulation Strength and the Variability of Growing Season and Cold Season Climate in Northern<br />
and Central Europe’, The Holocene, inprint.<br />
Keys, R. G.: 1981, ‘Cubic Convolution Interpolation for Digital Image Processing’, IEEE Trans. on<br />
Acoustics, Speech, and Signal Processing 29 (6), 1153–1160.<br />
Kington, J. A.: 1974, ‘The Societas Meteorologica Palatina: An Eighteenth-Century Meteorological<br />
Society’, Weather, November 1974, 416–426.<br />
Linde, F.: 1998, En jämförande analys av instrumentuppställningar vid Stockholms gamla observatorium,<br />
Institutionen för geovetenskaper, meteorologi, Uppsala universitet, p. 51 (Unpublished<br />
undergraduate thesis).<br />
Lodén, L. O.: 1968: Tid: en bok om tideräkning och kalenderväsen, Bonnier, Stockholm, p. 210.<br />
Moberg, A.: 1998, ‘Meteorological Observations in Sweden Made before A. D. 1860’, Paläoklimaforschung/Palaeoclimate<br />
Research 23, 99–119.<br />
Moberg, A. and Bergström, H.: 1997, ‘Homogenization of Swedish Temperature Data. Part III: The<br />
Long Temperature Records from Stockholm and Uppsala’, Int. J. Clim. 17, 667–699.<br />
Moberg, A., Jones, P. D., Barriendos, M., Bergström, H., Camuffo, D., Cocheo, C., Davies, T. D.,<br />
Demarée, G., Martín-Vide, J., Maugeri, M., Rodríguez, R., and Verhoeve, T.: 2000, ‘Day-to-Day<br />
Temperature Variability Trends in 160- to 275-Year-Long Long European Instrumental Records’,<br />
J. Geophys. Res. 105, D18, 22849–22868.<br />
Modén, H.: 1939, Beräkning av medeltemperaturen vid svenska stationer, Statens Meteorologisk-<br />
Hydrografiska Anstalt, Meddelanden, Serien Uppsatser 29, Kungl. Boktryckeriet, P. A. Norstedt<br />
& Söner, Stockholm, p. 13.<br />
Modén, H.: 1963, Jämförelse mellan olika instrumentuppställningar vid gamla observatoriet i<br />
Stockholm, SMHI, Notiser och preliminära rapporter, Meteorologi, 3, Stockholm, p. 8.<br />
Sveriges Meteorologiska och Hydrologiska Institut: 1966, Meteorologiska iakttagelser i Sverige,<br />
Sveriges Meteorologiska och Hydrologiska Institut, Årsbok 47 (1965), del 2:2, Stockholm, pp.<br />
VI–VII.<br />
Yan, Z., Jones, P. D., Moberg, A., Bergström, H., Davies, T. D., and Yang, C.: 2001, ‘Recent Trends<br />
in Weather and Seasonal Cycles: An Analysis of Daily Data from Europe and China’, J. Geophys.<br />
Res. 106, D6, 5123–5138.<br />
Yan, Z., Jones, P. D., Davies, T. D., Moberg, A., Bergström, H., Camuffo, D., Cocheo, C., Maugeri,<br />
M., Demaree, G., Verhoeve, T., Thoen, E., Barriendos, M., Rodríguez, R., Martín-Vide J.,<br />
and Yang, C.: 2002, ‘Trends of Extreme Temperatures in Europe and China Based on Daily<br />
Observations’, Clim. Change, this volume.<br />
Sources (before 1900)<br />
Celsius, A.: 1742, ‘Observationer om twänne beständiga grader på en thermometer’, Kungl.<br />
Vetenskapsakademiens Handlingar 1742, 171–180.<br />
Wargentin, P.: 1749, ‘Vetenskapernas historia. Om Thermometrar’, Kungl. Vetenskapsakademiens<br />
Handlingar 1749, 161–175.<br />
Wargentin, P.: 1778, ‘Ytterligare anmärkningar om svenska climatet, hvad varme och köld angår’,<br />
Kungl. Vetenskapsakademiens Handlingar 1778, 3–19.<br />
(Received 10 August 2000; in revised form 22 October 2001)


