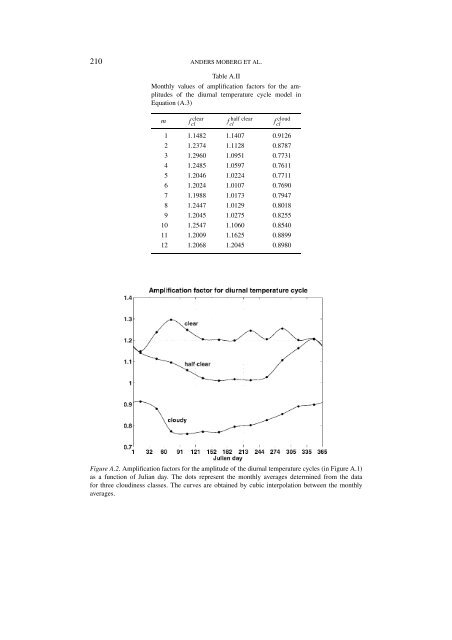
210 <strong>AND</strong>ERS MOBERG ET AL. Table A.II Monthly values of amplification factors for the amplitudes of the diurnal temperature cycle model in Equation (A.3) m f clear cl f half clear cl f cloud cl 1 1.1482 1.1407 0.9126 2 1.2374 1.1128 0.8787 3 1.2960 1.0951 0.7731 4 1.2485 1.0597 0.7611 5 1.2046 1.0224 0.7711 6 1.2024 1.0107 0.7690 7 1.1988 1.0173 0.7947 8 1.2447 1.0129 0.8018 9 1.2045 1.0275 0.8255 10 1.2547 1.1060 0.8540 11 1.2009 1.1625 0.8899 12 1.2068 1.2045 0.8980 Figure A.2. Amplification factors for the amplitude of the diurnal temperature cycles (in Figure A.1) as a function of Julian day. The dots represent the monthly averages determined from the data for three cloudiness classes. The curves are obtained by cubic interpolation between the monthly averages.
<strong>DAILY</strong> <strong>AIR</strong> <strong>TEMPERATURE</strong> <strong>AND</strong> <strong>PRESSURE</strong> <strong>SERIES</strong> FOR STOCKHOLM (1756–1998) 211 Scaling factors, f cl , were then determined for each class and for each month (all Januaries, all Februaries etc., separately) from the relation cloud class fcl = (t cloud class max − t min ) , (A.3) (t max − t min ) all data where ‘cloud class’ refers to one of the classes ‘clear’, ‘half clear’ or ‘cloudy’, using data for 1859–1960; ‘all data’ denotes all data for the same period. This is the longest possible period with T max and T min measured at the north-facing wall. The scaling factors are thus thought to be representative also for the conditions before 1859, i.e., the period for which Equation (1) was used and when the thermometer always was placed on a north-facing wall. Monthly averages of the scaling factors are listed in Table A.II. Daily scaling factors (Figure A.2) were obtained by cubic interpolation between the monthly values. References Literature (after 1900) Alexandersson, H.: 1986, ‘A Homogeneity Test Applied to Precipitation Data’, Int. J. Clim. 6, 661– 675. Alexandersson, H. and Moberg, A.: 1997, ‘Homogenization of Swedish Temperature Data. Part I: Homogeneity Test for Linear Trends’, Int. J. Clim. 17, 25–34. Alm, H.: 1982, Stockholms observatorium. Geografisk institution vid Stockholms universitet sedan 1934, Informationsenheten, Stockholms universitet, Stockholm, p. 173. (Reprinted from: Samfundet S:t Eriks årsbok, 1930). Bärring, L., Jönsson, P., Achberger, C., Ekström, M., and Alexandersson, H.: 1999, ‘The Lund Instrumental Record of Meteorological Observations: Reconstruction of Monthly Sea-Level Pressure 1780–1997’, Int. J. Clim.. 19, 1427–1443. Bergström, H. and Moberg, A.: 2002, ‘Daily Air Temperature and Pressure Series for Uppsala (1722– 1998)’, Clim. Change, this volume. Boutelje, J. B. and Rydell, R.: 1995, Träfakta – 44 träslag i ord och bild, Trätek, Institutet för träteknisk forskning, 3rd edn., Stockholm, p. 80. Camuffo, D.: 1998, Microclimate for Cultural Heritage, Elsevier, Amsterdam, p. 415. Cocheo, C. and Camuffo, D.: 2002, ‘Corrections of Systematic Errors and Data Homogenisation in the Daily Temperature Padova Series (1725–1998)’, Clim. Change, this volume. Ekholm, N.: 1916, Beräkning av luftens månadsmedeltemperatur vid de svenska meteorologiska stationerna, Bihang till Meteorologiska iakttagelser i Sverige, Band 56, 1914, Almqvist & Wiksell, Stockholm, p. 110. Ekström, M.: 1995, En jämförelse av mätplatser för temperaturobservationer vid Stockholms gamla observatorium, Fil. Mag. examensarbete i geovetenskap, Naturgeografiska institutionen, Stockholms universitet, p. 45. (Unpublished undergraduate thesis). Eriksson, B.: 1980a, Statistisk analys av nederbördsdata. Del III. 200-åriga nederbördsserier, SMHI Reports Meteorology and Climatology 27, p. 54. (English summary). Eriksson, B.: 1980b, Noggrannheten vid beräkning av dygnsmedelvärden, Meddelande nr. 4, 1980, Sveriges Meteorologiska och Hydrologiska Institut, Klimatbyrån, p. 13. Frich, P., Alexandersson, H., Ashcroft, J., Dahlström, B., Demarée, G., Drebs, A., van Engelen, A. F. V., Førland, E. J., Hanssen-Bauer, I., Heino, R., Jónsson, T., Jonasson, K., Keegan, L., Nordli, P.Ø., Schmith, T., Steffensen, P., Tuomenvirta, H., and Tveito, O. E.: 1996, North Atlantic Climatological Dataset (NACD Version 1) – Final Report, Danish Meteorological Institute, Scientific Report 96-1, DMI, Copenhagen, p. 47 + appendices. Hamberg, H. E.: 1906, ‘Moyennes mensuelles et annuelles de la température et extrêmes de température mensuels pendant les 150 années 1756–1905 à l’observatoire de Stockholm’, Kungl. Vetenskapsakademiens Handlingar 40 (1), 1–60.