Vijeo Citect Technical Overview - Square D
Vijeo Citect Technical Overview - Square D
Vijeo Citect Technical Overview - Square D

Create successful ePaper yourself
Turn your PDF publications into a flip-book with our unique Google optimized e-Paper software.
Process Analyst<br />
Process Analyst is an intuitive visualization tool designed to help you analyze<br />
the cause of process disturbances and improve productivity in the process.<br />
Process Analyst allows operators and process engineers to analyze the<br />
cause of process disturbances by bringing together trend and alarm<br />
data, which are traditionally stored separately. With Process Analyst,<br />
users can simply view them all on a single integrated display.<br />
Complete flexibility is provided to the user on how the pens can be<br />
displayed. For example, they can be overlaid, stacked or placed in<br />
different panes to reduce clutter and make the display easier to read.<br />
Process Analyst includes many unique features including true<br />
Daylight Savings Time support, accuracy to millisecond resolution,<br />
individual time axis per pen, customizable toolbars, rich printing and<br />
saving of all display settings for easy recall.<br />
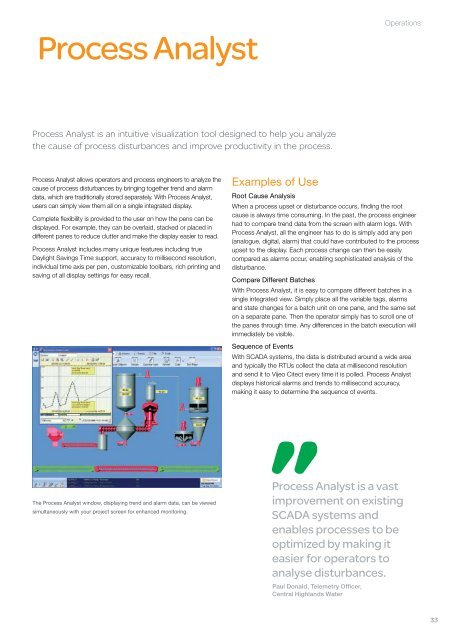
The Process Analyst window, displaying trend and alarm data, can be viewed<br />
simultaneously with your project screen for enhanced monitoring.<br />
Examples of Use<br />
Operations<br />
Root Cause Analysis<br />
When a process upset or disturbance occurs, finding the root<br />
cause is always time consuming. In the past, the process engineer<br />
had to compare trend data from the screen with alarm logs. With<br />
Process Analyst, all the engineer has to do is simply add any pen<br />
(analogue, digital, alarm) that could have contributed to the process<br />
upset to the display. Each process change can then be easily<br />
compared as alarms occur, enabling sophisticated analysis of the<br />
disturbance.<br />
Compare Different Batches<br />
With Process Analyst, it is easy to compare different batches in a<br />
single integrated view. Simply place all the variable tags, alarms<br />
and state changes for a batch unit on one pane, and the same set<br />
on a separate pane. Then the operator simply has to scroll one of<br />
the panes through time. Any differences in the batch execution will<br />
immediately be visible.<br />
Sequence of Events<br />
With SCADA systems, the data is distributed around a wide area<br />
and typically the RTUs collect the data at millisecond resolution<br />
and send it to <strong>Vijeo</strong> <strong>Citect</strong> every time it is polled. Process Analyst<br />
displays historical alarms and trends to millisecond accuracy,<br />
making it easy to determine the sequence of events.<br />
Process Analyst is a vast<br />
improvement on existing<br />
SCADA systems and<br />
enables processes to be<br />
optimized by making it<br />
easier for operators to<br />
analyse disturbances.<br />
Paul Donald, Telemetry Officer,<br />
Central Highlands Water<br />
33