Vijeo Citect Technical Overview - Square D
Vijeo Citect Technical Overview - Square D
Vijeo Citect Technical Overview - Square D

You also want an ePaper? Increase the reach of your titles
YUMPU automatically turns print PDFs into web optimized ePapers that Google loves.
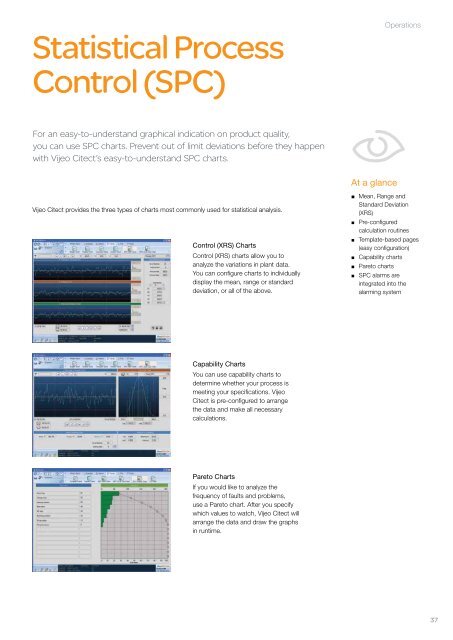
Statistical Process<br />
Control (SPC)<br />
For an easy-to-understand graphical indication on product quality,<br />
you can use SPC charts. Prevent out of limit deviations before they happen<br />
with <strong>Vijeo</strong> <strong>Citect</strong>’s easy-to-understand SPC charts.<br />
<strong>Vijeo</strong> <strong>Citect</strong> provides the three types of charts most commonly used for statistical analysis.<br />
Control (XRS) Charts<br />
Control (XRS) charts allow you to<br />
analyze the variations in plant data.<br />
You can configure charts to individually<br />
display the mean, range or standard<br />
deviation, or all of the above.<br />
Capability Charts<br />
You can use capability charts to<br />
determine whether your process is<br />
meeting your specifications. <strong>Vijeo</strong><br />
<strong>Citect</strong> is pre-configured to arrange<br />
the data and make all necessary<br />
calculations.<br />
Pareto Charts<br />
If you would like to analyze the<br />
frequency of faults and problems,<br />
use a Pareto chart. After you specify<br />
which values to watch, <strong>Vijeo</strong> <strong>Citect</strong> will<br />
arrange the data and draw the graphs<br />
in runtime.<br />
At a glance<br />
Operations<br />
Mean, Range and<br />
Standard Deviation<br />
(XRS)<br />
Pre-configured<br />
calculation routines<br />
Template-based pages<br />
(easy configuration)<br />
Capability charts<br />
Pareto charts<br />
SPC alarms are<br />
integrated into the<br />
alarming system<br />
37