General Guidance for Developing Differential Premium Systems
General Guidance for Developing Differential Premium Systems
General Guidance for Developing Differential Premium Systems

Create successful ePaper yourself
Turn your PDF publications into a flip-book with our unique Google optimized e-Paper software.
October 31, 2011<br />
Methodology used <strong>for</strong> the selection of quantitative indicators<br />
The process of quantitative indicator selection needed to reflect not only the<br />
standard rules of risk analysis, but also specifics of the Kazakhstani economic<br />
environment and its current stage of maturity. In order to choose the most<br />
valuable financial ratios from a broad range of indicators, statistical methods<br />
such as correlation, t-test, and factor analysis were used.<br />
An expert judgement was applied to divide banks into normal and problem<br />
banks due to the lack of reliable and comparable statistics concerning results<br />
of normal and liquidated bank activities. The main reason <strong>for</strong> that is that<br />
Kazakhstan is an emerging market. Statistical methods were then applied to<br />
select the most valuable indicators in order to include them in the testing<br />
process.<br />
For each of the quantitative indicators, an algorithm was developed to justify<br />
the trans<strong>for</strong>mation of the actual values of the indicators into the resulting<br />
“score” as a final output of the model. Use of the indicators’ numerical values<br />
and their weights based on the factor loadings of each indicator is done<br />
through the Factor Analysis. Other methods are based on defining intervals<br />
of actual indicator values that can be achieved.<br />
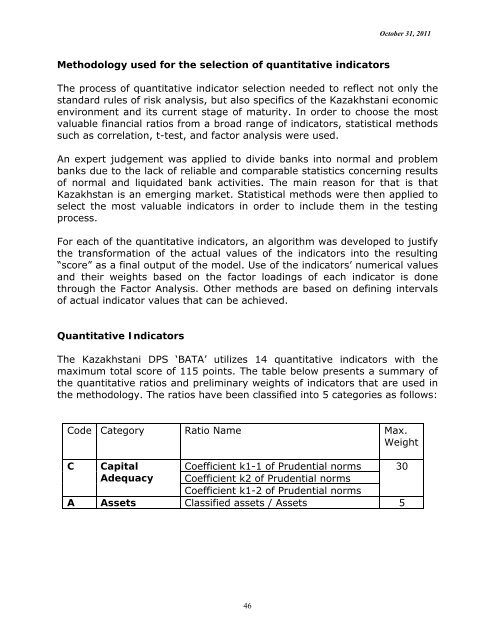
Quantitative Indicators<br />
The Kazakhstani DPS ‘BATA’ utilizes 14 quantitative indicators with the<br />
maximum total score of 115 points. The table below presents a summary of<br />
the quantitative ratios and preliminary weights of indicators that are used in<br />
the methodology. The ratios have been classified into 5 categories as follows:<br />
Code Category Ratio Name Max.<br />
Weight<br />
C Capital Coefficient k1-1 of Prudential norms 30<br />
Adequacy Coefficient k2 of Prudential norms<br />
Coefficient k1-2 of Prudential norms<br />
A Assets Classified assets / Assets 5<br />
46