General Guidance for Developing Differential Premium Systems
General Guidance for Developing Differential Premium Systems
General Guidance for Developing Differential Premium Systems
You also want an ePaper? Increase the reach of your titles
YUMPU automatically turns print PDFs into web optimized ePapers that Google loves.
October 31, 2011<br />
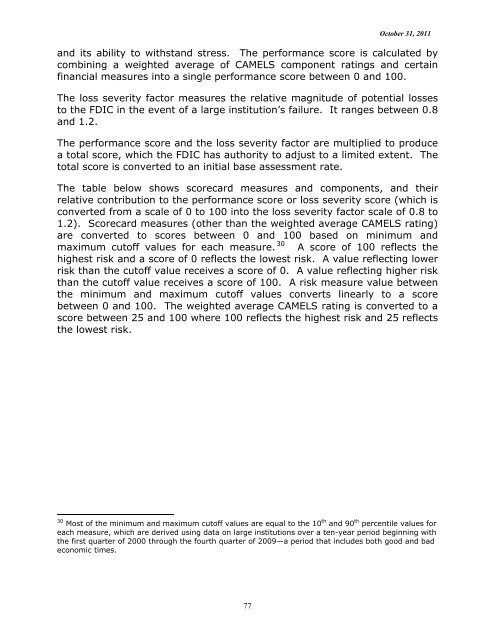
and its ability to withstand stress. The per<strong>for</strong>mance score is calculated by<br />
combining a weighted average of CAMELS component ratings and certain<br />
financial measures into a single per<strong>for</strong>mance score between 0 and 100.<br />
The loss severity factor measures the relative magnitude of potential losses<br />
to the FDIC in the event of a large institution’s failure. It ranges between 0.8<br />
and 1.2.<br />
The per<strong>for</strong>mance score and the loss severity factor are multiplied to produce<br />
a total score, which the FDIC has authority to adjust to a limited extent. The<br />
total score is converted to an initial base assessment rate.<br />
The table below shows scorecard measures and components, and their<br />
relative contribution to the per<strong>for</strong>mance score or loss severity score (which is<br />
converted from a scale of 0 to 100 into the loss severity factor scale of 0.8 to<br />
1.2). Scorecard measures (other than the weighted average CAMELS rating)<br />
are converted to scores between 0 and 100 based on minimum and<br />
maximum cutoff values <strong>for</strong> each measure. 30 A score of 100 reflects the<br />
highest risk and a score of 0 reflects the lowest risk. A value reflecting lower<br />
risk than the cutoff value receives a score of 0. A value reflecting higher risk<br />
than the cutoff value receives a score of 100. A risk measure value between<br />
the minimum and maximum cutoff values converts linearly to a score<br />
between 0 and 100. The weighted average CAMELS rating is converted to a<br />
score between 25 and 100 where 100 reflects the highest risk and 25 reflects<br />
the lowest risk.<br />
30 Most of the minimum and maximum cutoff values are equal to the 10 th and 90 th percentile values <strong>for</strong><br />
each measure, which are derived using data on large institutions over a ten-year period beginning with<br />
the first quarter of 2000 through the fourth quarter of 2009—a period that includes both good and bad<br />
economic times.<br />
77


