Frequency domain seismic forward modelling: A tool for waveform ...
Frequency domain seismic forward modelling: A tool for waveform ...
Frequency domain seismic forward modelling: A tool for waveform ...
You also want an ePaper? Increase the reach of your titles
YUMPU automatically turns print PDFs into web optimized ePapers that Google loves.
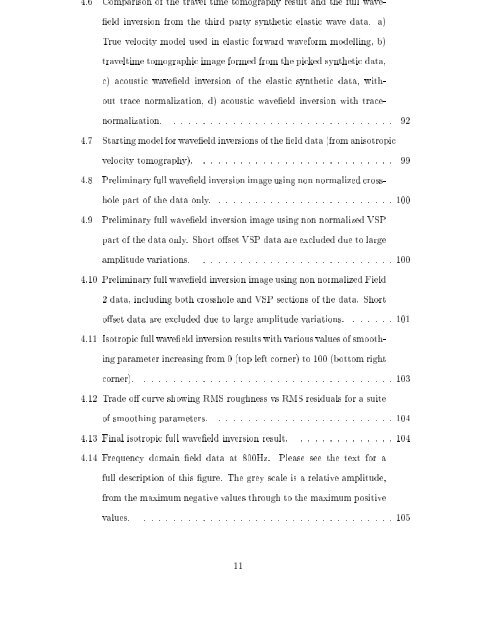
4.6 Comparison of the travel time tomography result and the full wave-<br />
eld inversion from the third party synthetic elastic wave data. a)<br />
True velocity model used in elastic <strong><strong>for</strong>ward</strong> wave<strong>for</strong>m <strong>modelling</strong>, b)<br />
traveltime tomographic image <strong>for</strong>med from the picked synthetic data,<br />
c) acoustic waveeld inversion of the elastic synthetic data, without<br />
trace normalization, d) acoustic waveeld inversion with tracenormalization.<br />
. . . . . . . . . . . . . . . . . . . . . . . . . . . . . . 92<br />
4.7 Starting model <strong>for</strong> waveeld inversions of the eld data (from anisotropic<br />
velocity tomography). . . . . . . . . . . . . . . . . . . . . . . . . . . 99<br />
4.8 Preliminary full waveeld inversion image using non normalized crosshole<br />
part of the data only. . . . . . . . . . . . . . . . . . . . . . . . . 100<br />
4.9 Preliminary full waveeld inversion image using non normalized VSP<br />
part of the data only. Short oset VSP data are excluded due to large<br />
amplitude variations. . . . . . . . . . . . . . . . . . . . . . . . . . . 100<br />
4.10 Preliminary full waveeld inversion image using non normalized Field<br />
2 data, including both crosshole and VSP sections of the data. Short<br />
oset data are excluded due to large amplitude variations. . . . . . . 101<br />
4.11 Isotropic full waveeld inversion results with various values of smoothing<br />
parameter increasing from 0 (top left corner) to 100 (bottom right<br />
corner). . . . . . . . . . . . . . . . . . . . . . . . . . . . . . . . . . . 103<br />
4.12 Trade o curve showing RMS roughness vs RMS residuals <strong>for</strong> a suite<br />
of smoothing parameters. . . . . . . . . . . . . . . . . . . . . . . . . 104<br />
4.13 Final isotropic full waveeld inversion result. . . . . . . . . . . . . . 104<br />
4.14 <strong>Frequency</strong> <strong>domain</strong> eld data at 800Hz. Please see the text <strong>for</strong> a<br />
full description of this gure. The grey scale is a relative amplitude,<br />
from the maximum negative values through to the maximum positive<br />
values. . . . . . . . . . . . . . . . . . . . . . . . . . . . . . . . . . . 105<br />
11


