Elderly Nutrition - Center for Nutrition Policy and Promotion - US ...
Elderly Nutrition - Center for Nutrition Policy and Promotion - US ...
Elderly Nutrition - Center for Nutrition Policy and Promotion - US ...

Create successful ePaper yourself
Turn your PDF publications into a flip-book with our unique Google optimized e-Paper software.
Research Articles<br />
Special Issue<br />
<strong>Elderly</strong> <strong>Nutrition</strong><br />
3 Improving Calcium Intake Among <strong>Elderly</strong> African Americans:<br />
Barriers <strong>and</strong> Effective Strategies<br />
Terra L. Smith, Susan J. Stephens, Mary Ann Smith, Linda Clemens,<br />
<strong>and</strong> Dianne K. Polly<br />
15 The Influence of the Healthy Eating <strong>for</strong> Life Program on Eating Behaviors<br />
of Nonmetropolitan Congregate Meal Participants<br />
Cynthia A. Long, Alma Montano Saddam, Nikki L. Conklin, <strong>and</strong> Scott D. Scheer<br />
25 Using a Concurrent Events Approach to Underst<strong>and</strong> Social Support <strong>and</strong><br />
Food Insecurity Among Elders<br />
Edward A. Frongillo, Pascale Valois, <strong>and</strong> Wendy S. Wolfe<br />
33 Measuring the Food Security of <strong>Elderly</strong> Persons<br />
Mark Nord<br />
47 A Statewide Educational Intervention to Improve Older Americans’<br />
<strong>Nutrition</strong> <strong>and</strong> Physical Activity<br />
M.A. McCamey, N.A. Hawthorne, S. Reddy, M. Lombardo, M.E. Cress,<br />
<strong>and</strong> M.A. Johnson<br />
58 Estimation of Portion Sizes by <strong>Elderly</strong> Respondents<br />
S<strong>and</strong>ria Godwin <strong>and</strong> Edgar Chambers IV<br />
67 Healthy Eating Index Scores <strong>and</strong> the <strong>Elderly</strong><br />
Michael S. Finke <strong>and</strong> S<strong>and</strong>ra J. Huston<br />
74 Factors Affecting <strong>Nutrition</strong>al Adequacy Among Single <strong>Elderly</strong> Women<br />
Deanna L. Sharpe, S<strong>and</strong>ra J. Huston, <strong>and</strong> Michael S. Finke<br />
83 Reduction in Modifiable Osteoporosis-Related Risk Factors Among Adults<br />
in the Older Americans <strong>Nutrition</strong> Program<br />
J.M.K. Cheong, M.A. Johnson, R.D. Lewis, J.G. Fischer, <strong>and</strong> J.T. Johnson
Ann M. Veneman, Secretary<br />
U.S. Department of Agriculture<br />
Eric M. Bost, Under Secretary<br />
Food, <strong>Nutrition</strong>, <strong>and</strong> Consumer Services<br />
Eric J. Hentges, Executive Director<br />
<strong>Center</strong> <strong>for</strong> <strong>Nutrition</strong> <strong>Policy</strong> <strong>and</strong> <strong>Promotion</strong><br />
Steven N. Christensen, Deputy Director<br />
<strong>Center</strong> <strong>for</strong> <strong>Nutrition</strong> <strong>Policy</strong> <strong>and</strong> <strong>Promotion</strong><br />
P. Peter Basiotis, Director<br />
<strong>Nutrition</strong> <strong>Policy</strong> <strong>and</strong> Analysis Staff<br />
<strong>Center</strong> <strong>for</strong> <strong>Nutrition</strong> <strong>Policy</strong> <strong>and</strong> <strong>Promotion</strong><br />
Mission Statement<br />
To improve the health of Americans by developing <strong>and</strong> promoting dietary<br />
guidance that links scientific research to the nutrition needs of consumers.<br />
The U.S. Department of Agriculture (<strong>US</strong>DA) prohibits discrimination in all its programs <strong>and</strong><br />
activities on the basis of race, color, national origin, sex, religion, age, disability, political beliefs,<br />
sexual orientation, or marital or family status. (Not all prohibited bases apply to all programs.)<br />
Persons with disabilities who require alternative means <strong>for</strong> communication of program in<strong>for</strong>mation<br />
(Braille, large print, audiotape, etc.) should contact <strong>US</strong>DA’s TARGET <strong>Center</strong> at (202)<br />
720-2600 (voice <strong>and</strong> TDD).<br />
To file a complaint of discrimination, write <strong>US</strong>DA, Director, Office of Civil Rights, Room<br />
326-W, Whitten Building, 14th <strong>and</strong> Independence Avenue, SW, Washington, DC 20250-<br />
9410 or call (202) 720-5964 (voice <strong>and</strong> TDD). <strong>US</strong>DA is an equal opportunity provider <strong>and</strong><br />
employer.
CENTER FOR NUTRITION POLICY AND PROMOTION<br />
Family Economics <strong>and</strong><br />
<strong>Nutrition</strong> Review<br />
Editor<br />
Julia M. Dinkins<br />
Associate Editor<br />
David M. Herring<br />
Features Editor<br />
Mark Lino<br />
Managing Editor<br />
Jane W. Fleming<br />
Peer Review Coordinator<br />
Hazel Hiza<br />
Family Economics <strong>and</strong> <strong>Nutrition</strong> Review is<br />
written <strong>and</strong> published semiannually by the<br />
<strong>Center</strong> <strong>for</strong> <strong>Nutrition</strong> <strong>Policy</strong> <strong>and</strong> <strong>Promotion</strong>, U.S.<br />
Department of Agriculture, Washington, DC.<br />
The Secretary of Agriculture has determined that<br />
publication of this periodical is necessary in the<br />
transaction of the public business required by<br />
law of the Department.<br />
This publication is not copyrighted. Thus,<br />
contents may be reprinted without permission,<br />
but credit to Family Economics <strong>and</strong> <strong>Nutrition</strong><br />
Review would be appreciated. Use of<br />
commercial or trade names does not imply<br />
approval or constitute endorsement by <strong>US</strong>DA.<br />
Family Economics <strong>and</strong> <strong>Nutrition</strong> Review is<br />
indexed in the following databases: AGRICOLA,<br />
Ageline, Economic Literature Index, ERIC,<br />
Family Studies, PAIS, <strong>and</strong> Sociological<br />
Abstracts.<br />
Family Economics <strong>and</strong> <strong>Nutrition</strong> Review is<br />
<strong>for</strong> sale by the Superintendent of Documents.<br />
Subscription price is $13 per year ($18.20 <strong>for</strong><br />
<strong>for</strong>eign addresses). Send subscription order<br />
<strong>and</strong> change of address to Superintendent of<br />
Documents, P.O. Box 371954, Pittsburgh, PA<br />
15250-7954. (See subscription <strong>for</strong>m on p. 103.)<br />
Original manuscripts are accepted <strong>for</strong><br />
publication. (See “guidelines <strong>for</strong> submissions”<br />
on back inside cover.) Suggestions or<br />
comments concerning this publication should<br />
be addressed to Julia M. Dinkins, Editor,<br />
Family Economics <strong>and</strong> <strong>Nutrition</strong> Review,<br />
<strong>Center</strong> <strong>for</strong> <strong>Nutrition</strong> <strong>Policy</strong> <strong>and</strong> <strong>Promotion</strong>,<br />
<strong>US</strong>DA, 3101 Park <strong>Center</strong> Drive, Room 1034,<br />
Alex<strong>and</strong>ria, VA 22302-1594.<br />
The Family Economics <strong>and</strong> <strong>Nutrition</strong><br />
Review is now available at<br />
www.cnpp.usda.gov (See p. 104)<br />
Research Articles<br />
3 Improving Calcium Intake Among <strong>Elderly</strong> African Americans:<br />
Barriers <strong>and</strong> Effective Strategies<br />
Terra L. Smith, Susan J. Stephens, Mary Ann Smith, Linda Clemens, <strong>and</strong> Dianne K. Polly<br />
15 The Influence of the Healthy Eating <strong>for</strong> Life Program on Eating Behaviors<br />
of Nonmetropolitan Congregate Meal Participants<br />
Cynthia A. Long, Alma Montano Saddam, Nikki L. Conklin, <strong>and</strong> Scott D. Scheer<br />
25 Using a Concurrent Events Approach to Underst<strong>and</strong> Social Support <strong>and</strong><br />
Food Insecurity Among Elders<br />
Edward A. Frongillo, Pascale Valois, <strong>and</strong> Wendy S. Wolfe<br />
33 Measuring the Food Security of <strong>Elderly</strong> Persons<br />
Mark Nord<br />
47 A Statewide Educational Intervention to Improve Older Americans’<br />
<strong>Nutrition</strong> <strong>and</strong> Physical Activity<br />
M.A. McCamey, N.A. Hawthorne, S. Reddy, M. Lombardo, M.E. Cress, <strong>and</strong> M.A. Johnson<br />
58 Estimation of Portion Sizes by <strong>Elderly</strong> Respondents<br />
S<strong>and</strong>ria Godwin <strong>and</strong> Edgar Chambers IV<br />
67 Healthy Eating Index Scores <strong>and</strong> the <strong>Elderly</strong><br />
Michael S. Finke <strong>and</strong> S<strong>and</strong>ra J. Huston<br />
74 Factors Affecting <strong>Nutrition</strong>al Adequacy Among Single <strong>Elderly</strong> Women<br />
Deanna L. Sharpe, S<strong>and</strong>ra J. Huston, <strong>and</strong> Michael S. Finke<br />
83 Reduction in Modifiable Osteoporosis-Related Risk Factors Among Adults<br />
in the Older Americans <strong>Nutrition</strong> Program<br />
J.M.K. Cheong, M.A. Johnson, R.D. Lewis, J.G. Fischer, <strong>and</strong> J.T. Johnson<br />
Regular Items<br />
92 Federal Studies<br />
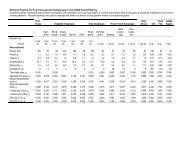
100 Official <strong>US</strong>DA Food Plans: Cost of Food at Home at Four Levels, U.S. Average,<br />
September 2003<br />
101 Consumer Prices<br />
Special Issue<br />
<strong>Elderly</strong> <strong>Nutrition</strong><br />
102 U.S. Poverty Thresholds <strong>and</strong> Related Statistics<br />
Volume 15, Number 1<br />
2003
Foreword<br />
W<br />
ith this issue, we here at the <strong>Center</strong> <strong>for</strong> <strong>Nutrition</strong> <strong>Policy</strong> <strong>and</strong> <strong>Promotion</strong> celebrate the<br />
60 th anniversary of Family Economics <strong>and</strong> <strong>Nutrition</strong> Review. From its beginning as a<br />
monthly newsletter, to its trans<strong>for</strong>mation as a research journal, Family Economics<br />
<strong>and</strong> <strong>Nutrition</strong> Review has provided valuable in<strong>for</strong>mation to the American public. Whether<br />
named Wartime Family Living (1943), Rural Family Living (1945), Family Economics<br />
Review (1957), or Family Economics <strong>and</strong> <strong>Nutrition</strong> Review (1995), this <strong>US</strong>DA publication<br />
has always provided in<strong>for</strong>mation—based on current scientific knowledge—<strong>for</strong> Americans to<br />
make decisions about food, clothing, <strong>and</strong> shelter, as well as provided in<strong>for</strong>mation about other<br />
aspects of daily living (e.g., energy prices, welfare re<strong>for</strong>m, <strong>and</strong> population trends <strong>for</strong> quality<br />
of life).<br />
Started during World War II, Wartime Family Living, a newsletter, kept Americans abreast of<br />
war-related food concerns: distribution, production <strong>and</strong> manufacturing quotas, <strong>and</strong> rationing.<br />
<strong>US</strong>DA Cooperative Extension agents, the audience that translated the in<strong>for</strong>mation in Wartime<br />
Family Living into <strong>for</strong>ms useful to the American public, found this helpful advice in the<br />
December 27, 1943, issue: “Wartime diets <strong>for</strong> good nutrition, presented in April’s Wartime<br />
Family Living, has now been printed <strong>and</strong> is called Family food plans <strong>for</strong> good nutrition.<br />
These plans, a low-cost <strong>and</strong> a moderate-cost one, have been revised slightly since their earlier<br />
release. Both will be helpful in planning diets that will measure up to the yardstick of good<br />
nutrition.”<br />
We have produced several special issues: the Special Economic Problems of Low-Income<br />
Families (1965), the Economic Role of Women in Family Life (1973), Promoting Family<br />
Economic <strong>and</strong> <strong>Nutrition</strong> Security (1998), <strong>and</strong> the Food Guide Pyramid <strong>for</strong> Young Children<br />
(1999). The <strong>US</strong>DA’s 60 th anniversary edition of Family Economics <strong>and</strong> <strong>Nutrition</strong> Review,<br />
a special issue, focuses on our elderly population: By focusing on this growing population,<br />
we are not only addressing some important implications of aging in relation to nutrition <strong>and</strong><br />
well-being, we are also continuing our tradition of linking “scientific research to the nutrition<br />
needs of consumers” <strong>and</strong> thus improving the well-being of American families <strong>and</strong> consumers.<br />
On the 25 th anniversary, Family Economics Review was recognized as having helped the<br />
<strong>US</strong>DA reach its goal of providing Americans with a flow of in<strong>for</strong>mation on problems<br />
affecting their welfare: “Today, Family Economics Review brings together <strong>and</strong> interprets<br />
economic data affecting consumers from <strong>US</strong>DA <strong>and</strong> many Government sources, <strong>for</strong> use by<br />
[Cooperative] Extension workers, college <strong>and</strong> high school teachers, social welfare workers,<br />
<strong>and</strong> other leaders working with farm <strong>and</strong> city people.”<br />
On this 60 th anniversary, Family Economics <strong>and</strong> <strong>Nutrition</strong> Review reflects the <strong>US</strong>DA’s goal<br />
to improve the Nation’s nutrition <strong>and</strong> health through nutrition education <strong>and</strong> promotion. It is<br />
our wish here at the <strong>Center</strong> <strong>for</strong> <strong>Nutrition</strong> <strong>Policy</strong> <strong>and</strong> <strong>Promotion</strong> that Family Economics <strong>and</strong><br />
<strong>Nutrition</strong> Review will continue to serve the needs of the American public.<br />
Julia M. Dinkins<br />
Editor
Research Articles<br />
Improving Calcium Intake Among<br />
<strong>Elderly</strong> African Americans:<br />
Barriers <strong>and</strong> Effective Strategies<br />
Terra L. Smith, PhD, RD<br />
The University of Memphis<br />
Susan J. Stephens, MS, RD<br />
Central North Alabama Health Services, Inc.<br />
Huntsville, AL<br />
Mary Ann Smith, PhD, RD<br />
The University of Memphis<br />
Linda Clemens, EdD, RD<br />
The University of Memphis<br />
Dianne K. Polly, MS, JD<br />
Metropolitan Inter-Faith Association<br />
The objectives of this pilot study were to identify barriers to <strong>and</strong> in<strong>for</strong>med<br />
strategies <strong>for</strong> improving calcium intake among elderly African Americans. To<br />
accomplish these objectives, researchers recruited 56 seniors (age 60 or older)<br />
from a congregate meal site in a large urban senior center in the mid-South<br />
region of the United States. In focus group discussions, participants answered<br />
questions related to food preferences, calcium intake, motivations, <strong>and</strong> barriers<br />
to calcium intake, as well as recommended educational strategies. Researchers<br />
used both quantitative <strong>and</strong> qualitative methods to evaluate the data. The study<br />
revealed eight barriers to dietary calcium intake: concern <strong>for</strong> health <strong>and</strong> disease<br />
states, lack of nutrition knowledge, behaviors related to dairy products, limited<br />
food preferences, financial concerns, lack of food variety, food sanitation concerns,<br />
<strong>and</strong> limited food availability. Participants suggested several educational<br />
strategies, including group discussions, taste-testing sessions, <strong>and</strong> peer<br />
education at various locations. Other suggestions were direct mail, television,<br />
<strong>and</strong> newspapers with large print text <strong>and</strong> colorful depictions of diet-appropriate<br />
ethnic foods. Focus group interactions are excellent means of eliciting nutritionrelated<br />
opinions from African-American elders.<br />
T<br />
he results of the Third National<br />
Health <strong>and</strong> <strong>Nutrition</strong> Examination<br />
Survey (NHANES III)<br />
(Alaimo et al., 1994) agree with the<br />
conclusions of other studies that<br />
the calcium intake of many African<br />
Americans is below recommended<br />
levels (National Research Council, 1989)<br />
<strong>and</strong> especially below the new calcium<br />
goals (Dietary Reference Intakes) <strong>for</strong><br />
the American population (National<br />
Academy Press, 1997; Yates, Schliker,<br />
& Suitor, 1998). The limited intake of<br />
calcium by African Americans places<br />
this subgroup of the American population<br />
at risk <strong>for</strong> chronic diseases that<br />
may be alleviated by achieving adequate<br />
calcium. Although many African<br />
Americans consume milk, the consumption<br />
of dairy products—a major source<br />
of calcium in the United States—by<br />
African-American men <strong>and</strong> women is<br />
significantly lower than that of White<br />
men <strong>and</strong> women (Shimakawa et al.,<br />
1994; Koh & Chi, 1981). Osteoporosis<br />
associated with calcium-intake<br />
deficiencies <strong>and</strong> possibly hypertension<br />
contributes to the high cost<br />
of medical care in the United States<br />
(Riggs, Peck, & Bell, 1991; Joint<br />
National Committee, 1993).<br />
Prevalence of deficiencies in lactase,<br />
an enzyme required to metabolize the<br />
primary milk sugar lactose, is blamed<br />
<strong>for</strong> the low intake of dairy products<br />
among African Americans (Pollitzer<br />
& Anderson, 1989). Although the consumption<br />
of milk <strong>and</strong> dairy products is<br />
inadequate in terms of calcium intake,<br />
nutrient supplementation is not a<br />
solution <strong>for</strong> many African Americans.<br />
Results from the 1992 National Health<br />
Interview Survey Epidemiology<br />
2003 Vol. 15 No. 1 3
Supplement (Slesinski, Subar, & Kahle,<br />
1996) indicate that of the 1,353 Blacks<br />
surveyed, three-fourths (77.2 percent)<br />
seldom or never used any vitamin <strong>and</strong><br />
mineral supplement, less than 5 percent<br />
(4.4 percent) used supplements<br />
occasionally, <strong>and</strong> 18.4 percent used<br />
them daily.<br />
Commonly called the “silent disease”<br />
because pain or symptoms are not<br />
experienced until a fracture occurs,<br />
osteoporosis is a metabolic bone<br />
disease characterized by low bone<br />
mass, which makes bones fragile <strong>and</strong><br />
susceptible to fracture. While African-<br />
American women tend to have higher<br />
bone mineral density than White<br />
women have, they are still at significant<br />
risk of developing osteoporosis.<br />
Furthermore, as African-American<br />
women age, their risk of developing<br />
osteoporosis more closely resembles<br />
the risk among White women. So, as<br />
the number of older women in the<br />
United States increases, an increasing<br />
number of African-American women<br />
with osteoporosis can be expected<br />
(National Institutes of Health, 1998).<br />
Background<br />
The literature is replete with studies<br />
indicating that calcium intakes of<br />
African Americans are below the<br />
recommended dietary guidelines (e.g.,<br />
Alaimo et al., 1994), as well as the<br />
new calcium intake st<strong>and</strong>ards set by<br />
the Institute of Medicine (National<br />
Academy Press, 1997). In addition to<br />
verifying the poor status of calcium<br />
intake among African-American adults,<br />
much of the literature focuses on the<br />
dichotomy of lactose intolerance <strong>and</strong><br />
bone densities of African Americans.<br />
Lactose intolerance is thought to be the<br />
primary barrier to consumption of milk<br />
<strong>and</strong> dairy products among African<br />
Americans (Buchowski, Semenya, &<br />
Johnson, 2002). The empirical work<br />
on lactose intolerance among African<br />
Americans, however, does not establish<br />
that African Americans choose not<br />
to consume milk because of gastrointestinal<br />
distress. Researchers have<br />
found that lactose intolerance among<br />
some African Americans may be<br />
overestimated because of lactose<br />
digesters’ belief that consumption of<br />
milk leads to this distress (Johnson,<br />
Semenya, Buchowski, Enwonwu, &<br />
Scrimshaw, 1993). Even with lactose<br />
intolerance, small quantities of milk<br />
can be consumed with little or no discom<strong>for</strong>t,<br />
<strong>and</strong> specialty milk products<br />
<strong>and</strong> lactase tablets are available to<br />
ameliorate the symptoms related to<br />
lactose consumption. In addition,<br />
promising dietary management strategies<br />
are available, such as consuming<br />
lactose-containing dairy foods more<br />
frequently <strong>and</strong> in smaller amounts as<br />
well as with meals, eating live culture<br />
yogurt, using lactose-digestive aids,<br />
<strong>and</strong> the consumption of calcium<strong>for</strong>tified<br />
foods (Jackson & Savaiano,<br />
2001).<br />
The other side of the dichotomy is bone<br />
mineral density <strong>and</strong> osteoporosis. A<br />
major reason <strong>for</strong> the sense of security<br />
regarding calcium-intake research may<br />
be the higher bone mineral density<br />
of African-American women (e.g.,<br />
Luckey et al., 1989) coupled with<br />
their lower rates of osteoporosis. The<br />
implications are that high bone mineral<br />
density will protect African Americans<br />
from osteoporosis <strong>and</strong> symptoms of<br />
calcium deficiency. Silverman <strong>and</strong><br />
Madison (1988) found that the incidence<br />
of age-adjusted fracture rates<br />
<strong>for</strong> non-Hispanic White women is<br />
greater than twice the rate <strong>for</strong> African<br />
Americans. But low risk does not<br />
translate into no risk. A fact sheet<br />
from the National Institutes of Health<br />
(1998) states that<br />
[A]pproximately 300,000<br />
African-American women<br />
currently have osteoporosis;<br />
between 80 <strong>and</strong> 95 percent of<br />
fractures in African-American<br />
women over 64 are due to<br />
osteoporosis; African-<br />
American women are more<br />
likely than White women to<br />
die following a hip fracture;<br />
as African-American women<br />
age, their risk of hip fractures<br />
doubles approximately every<br />
7 years; [<strong>and</strong>] diseases more<br />
prevalent in the African-<br />
American population, such<br />
as sickle-cell anemia <strong>and</strong><br />
systemic lupus erythematosus,<br />
are linked to osteoporosis.<br />
Some researchers have developed a<br />
prudent approach to this dichotomy.<br />
One group concluded that the “higher<br />
values of bone densities in African-<br />
American women, compared with<br />
White women are caused by a higher<br />
peak bone mass, as a slower rate of<br />
loss from skeletal sites comprised<br />
predominantly of trabecular bone.<br />
Low-risk strategies to enhance peak<br />
bone mass <strong>and</strong> to lower bone loss, such<br />
as calcium <strong>and</strong> vitamin D augmentation<br />
of the diet, should be examined <strong>for</strong><br />
African-American women” (Aloia,<br />
Vaswani, Yeh, & Flaster, 1996). To<br />
promote higher intakes of calcium more<br />
effectively, researchers <strong>and</strong> nutrition<br />
educators need to know more about<br />
food practices in relationship to dietary<br />
calcium. However, little in<strong>for</strong>mation<br />
is available on the effect that food<br />
practices of older African Americans<br />
may have on nutrient intake, particularly<br />
calcium (Cohen, Ralston, Laus,<br />
Bermudez, & Olson, 1998).<br />
The Council on Aging’s congregate<br />
meal feeding program is an excellent<br />
means of studying the problem of<br />
dietary calcium barriers among African-<br />
American elders. Even though the<br />
Council’s meals provide one-third of<br />
the RDA <strong>for</strong> all nutrients, African-<br />
American participants consumed less<br />
calcium, thiamin, iron, fat, carbohydrate,<br />
4 Family Economics <strong>and</strong> <strong>Nutrition</strong> Review
fiber, niacin, <strong>and</strong> vitamin C than did<br />
White participants (Holahan & Kunkel,<br />
1986).<br />
The purpose of the current pilot study<br />
was to examine the barriers to adequate<br />
calcium intake, through focus group<br />
discussions, among the African-<br />
American elderly population that<br />
participates in the congregate meal<br />
program. The in<strong>for</strong>mation from this<br />
study is needed to prepare effective,<br />
relevant, <strong>and</strong> appropriate nutritional<br />
education presentations <strong>and</strong> materials.<br />
Methods<br />
Participant Recruitment<br />
In the mid-South region of the United<br />
States, researchers recruited participants<br />
from a congregate meal site in a<br />
large urban senior center. Researchers<br />
held a recruitment session during which<br />
they explained the project’s focus, time<br />
commitment, <strong>and</strong> purpose to potential<br />
participants; scheduled participants <strong>for</strong><br />
the focus group sessions; <strong>and</strong> distributed<br />
appointment cards. Upon completing<br />
all focus group sessions, participants<br />
received a $15 gift certificate to<br />
a local grocery store. The researchers<br />
completed the official recruitment<br />
process in 1 day; however, the participants,<br />
without prompting, recruited<br />
others. Only African-American elders<br />
60 years <strong>and</strong> older participated in this<br />
study.<br />
Assessment Instruments<br />
The assessment instruments consisted<br />
of the Demographic <strong>and</strong> Calcium<br />
Intake Questionnaire (DCIQ) (Fleming<br />
& Heimbach, 1994) <strong>and</strong> the focus<br />
group questions (box 1). In addition<br />
to collecting demographic data,<br />
researchers used the DCIQ to assess<br />
participants’ food preferences in<br />
relationship to dairy <strong>and</strong> calciumcontaining<br />
foods. To make the focus<br />
group procedures <strong>and</strong> questions more<br />
reliable <strong>and</strong> while taking into account<br />
the age <strong>and</strong> cultural differences<br />
of elderly African Americans, the<br />
researchers used a dietary calcium<br />
intake questionnaire developed <strong>for</strong><br />
low-income Vietnamese mothers<br />
(Reed, Meeks, Nguyen, Cross, &<br />
Garrison, 1998). For example, where<br />
Reed <strong>and</strong> colleagues emphasized Asian<br />
cultural references, the researchers<br />
substituted African-American cultural<br />
references <strong>and</strong> maintained the theoretical<br />
framework of the original template,<br />
which was based on the PRECEDE-<br />
PROCEED model (Green & Kreuter,<br />
1991). This model has three central<br />
components related directly to the<br />
types of questions raised during a<br />
focus group discussion that seeks to<br />
underst<strong>and</strong> how to address, in a better<br />
fashion, dairy calcium needs through<br />
nutrition education: (1) predisposing<br />
(knowledge, attitudes, <strong>and</strong> motivations),<br />
(2) enabling (resources <strong>and</strong><br />
skills), <strong>and</strong> (3) rein<strong>for</strong>cing (praise <strong>and</strong><br />
perceived benefits). Based on the<br />
recommendations of Krueger (1998),<br />
the researchers interspersed these<br />
questions within the procedural<br />
framework described in box 1.<br />
Procedures <strong>for</strong> Data Collection<br />
<strong>and</strong> Data Analysis<br />
Each of the six focus groups was limited<br />
to no more than 12 participants, <strong>and</strong><br />
each session lasted no longer than 1½<br />
hours. A total of 56 African Americans<br />
participated. At the beginning of each<br />
focus group session, the researchers<br />
obtained a written consent from each<br />
participant. Be<strong>for</strong>e group discussions<br />
began, the researchers administered<br />
the DCIQ to participants <strong>and</strong> offered<br />
assistance if needed. To help participants<br />
become com<strong>for</strong>table, the researchers<br />
asked each to “tell us your<br />
name, <strong>and</strong> tell us what your favorite<br />
food is.” To transition to the discussion,<br />
the researchers asked participants<br />
to talk about some of the good points<br />
about their diet <strong>and</strong> how they would<br />
improve their diet.<br />
Participants considered milk<br />
good <strong>for</strong> bones <strong>and</strong> teeth <strong>and</strong><br />
were concerned about bone<br />
health <strong>and</strong> disease prevention<br />
in spite of being unable to<br />
describe calcium-related<br />
deficiency diseases.<br />
2003 Vol. 15 No. 1 5
Box 1. Focus group transition statements <strong>and</strong> questions 1<br />
Transition<br />
Key Questions #1<br />
Key Questions #2<br />
Transition<br />
Key Questions #3<br />
Transition<br />
Key Questions #4<br />
The <strong>US</strong>DA Food Guide Pyramid recommends that adults consume milk <strong>and</strong> dairy products every day.<br />
What dairy products do you commonly consume?<br />
How often do you have foods in this group?<br />
Which of the dairy foods do you select when you eat away from home?<br />
What things hinder you from eating these foods more often?<br />
What keeps you from ordering milk <strong>and</strong> dairy products when you eat away from home?<br />
As you see it, what is the relationship of milk <strong>and</strong> health? What people or materials helped you develop your viewpoint?<br />
Foods in the milk <strong>and</strong> dairy group are high in calcium. Calcium helps prevent several diseases: thinning of the bones or<br />
osteoporosis; high blood pressure or hypertension; <strong>and</strong> weak bones or rickets.<br />
What have you heard about these diseases?<br />
What would you like to know about these diseases?<br />
How does knowing about diseases related to poor calcium intake impact your diet choices?<br />
What would motivate you to eat more of the foods in the dairy group?<br />
So, you are saying that milk is important because of the nutrients it provides such as calcium.<br />
Here is a list of foods with their calcium content.<br />
What are your impressions of this list?<br />
So you eat several of these foods, what keeps you from purchasing/eating other foods on the list?<br />
What would motivate you to eat other foods that contain calcium?<br />
Think about the last time you tried something you never tried be<strong>for</strong>e. How did you go from never eating it to having tried it?<br />
How do your friends <strong>and</strong> family influence the foods you buy or prepare?<br />
So, what I am hearing is that your friends <strong>and</strong> family impact your food choices.<br />
When you think back on it, how much does your family influence the foods you buy or prepare?<br />
What are your thoughts about what your gr<strong>and</strong>children need in terms of milk <strong>and</strong> dairy foods?<br />
Where do you like to get nutrition in<strong>for</strong>mation?<br />
What is your impression about food labels?<br />
Are there places or people who don’t provide nutrition in<strong>for</strong>mation that you would like to hear from?<br />
What nutrition in<strong>for</strong>mation do you get from the following materials or places: brochures, reading materials, recipes high in calcium,<br />
grocery store lists, foods to select in a restaurant, signs, community classes—in the library, community center, <strong>and</strong>/or church?<br />
What are appealing <strong>and</strong> convenient ways <strong>for</strong> us to provide you with in<strong>for</strong>mation about foods <strong>and</strong> nutrition?<br />
What is your impression of the “Got Milk” signs?<br />
What is your family <strong>and</strong> gr<strong>and</strong>children’s impressions of the posters?<br />
What would you like to know about calcium, milk, <strong>and</strong> dairy foods?<br />
How much time would you like to spend learning about calcium?<br />
1 Krueger, 1998; Reed et al., 1998.<br />
Researchers used the focus group<br />
discussion questions to identify the<br />
barriers to calcium intake. This discussion<br />
was followed by a transition to<br />
the key questions. The first <strong>and</strong> second<br />
sets of key questions focused on<br />
current dietary behavior <strong>and</strong> predisposing<br />
factors, respectively; the third<br />
set focused on rein<strong>for</strong>cing factors.<br />
Finally, the fourth set of key questions<br />
focused on enabling factors. Researchers<br />
combined the last two sets of<br />
questions to determine educational<br />
strategies. One additional question in<br />
this combined set focused on participants’<br />
opinion about their gr<strong>and</strong>children’s<br />
need <strong>for</strong> milk <strong>and</strong> dairy<br />
products. To close the discussion,<br />
researchers asked the participants to<br />
give any advice that would help African<br />
Americans increase the calcium content<br />
of their diets.<br />
Both quantitative <strong>and</strong> qualitative<br />
procedures were used to analyze the<br />
data. The Statistical Package <strong>for</strong> the<br />
Social Sciences (SPSS, 1999) was<br />
used to analyze the descriptive data;<br />
frequencies were determined <strong>for</strong> food<br />
preferences <strong>and</strong> the demographic<br />
variables. The models were used to<br />
analyze the qualitative data: (1) the<br />
inductive data analysis model identified<br />
topics, categories, themes, <strong>and</strong> concepts<br />
as a means of bringing <strong>for</strong>th<br />
knowledge (McMillan & Schumacher,<br />
1997) <strong>and</strong> (2) the PRECEDE-PROCEED<br />
model was used to subdivide the<br />
knowledge gained into categories<br />
(Green & Kreuter, 1991).<br />
6 Family Economics <strong>and</strong> <strong>Nutrition</strong> Review
Researchers completed <strong>and</strong> compiled<br />
the qualitative data in the <strong>for</strong>m of tape<br />
recordings <strong>and</strong> h<strong>and</strong>written notes.<br />
During analysis, the researchers<br />
reviewed both the notes <strong>and</strong> the tapes<br />
from each focus group session <strong>and</strong><br />
then used the tape recordings to<br />
complete the notes. Next, researchers<br />
identified barriers, placed the individual<br />
barriers into categories, <strong>and</strong> organized<br />
the categories into patterns or themes<br />
<strong>and</strong> concepts (e.g., related to a predisposing<br />
or an enabling factor).<br />
Results <strong>and</strong> Discussion<br />
The focus group attendance was<br />
excellent, with only six no-shows.<br />
Six other participants attended a focus<br />
group session other than the one they<br />
had originally planned to attend. By<br />
casual observation, we noted that all<br />
but two of the participants appeared to<br />
be able-bodied: one revealed a hearing<br />
loss <strong>and</strong> one used a walker. Even<br />
though over half (n=28) of the African-<br />
American seniors in this study reported<br />
income below the poverty index<br />
(Annual Update of the HHS Poverty<br />
Guidelines, 1999), finances were rarely<br />
mentioned as a barrier to adequate<br />
calcium intake in the focus groups.<br />
These seniors seemed adept at managing<br />
their finances, <strong>and</strong> 40 percent used<br />
resources other than congregate meals,<br />
frequently citing commodity foods as<br />
supplements to their food budgets.<br />
Most African-American participants (84<br />
percent) agreed to provide demographic<br />
in<strong>for</strong>mation (table 1). Six of ten participants<br />
had less than a high school<br />
education, about 6 of 10 had a monthly<br />
income of less than $700, <strong>and</strong> about 6 of<br />
10 were not receiving food assistance.<br />
Almost three-quarters of the participants<br />
were single, separated, divorced,<br />
or widowed; over half (57 percent) lived<br />
alone. Most of the 56 participants<br />
(n=47) completed the food preference<br />
survey, which indicated that greater<br />
than 90 percent of the respondents<br />
liked <strong>and</strong> ate milk <strong>and</strong> dairy products<br />
as well as some other foods with<br />
moderate or high amounts of calcium<br />
(e.g., salmon with bones). However,<br />
some participants, while reviewing a<br />
list of calcium-containing foods, noted<br />
unfamiliarity with relatively new products<br />
such as tofu. In terms of general<br />
categories of calcium-containing<br />
supplements (calcium, antacids, or<br />
vitamins <strong>and</strong> minerals), 83 percent of<br />
the participants reported using supplements<br />
of various types daily, weekly,<br />
or seldom. Fifty-five percent reported<br />
taking at least one of the calciumcontaining<br />
supplements daily, 13<br />
percent reported using calcium supplements<br />
or other antacids (e.g., Tums),<br />
<strong>and</strong> 49 percent reported using vitaminmineral<br />
supplements (data not shown).<br />
Focus group discussions revealed a list<br />
of barriers to calcium intake among<br />
African-American seniors:<br />
• concern <strong>for</strong> health <strong>and</strong> disease<br />
states<br />
• lack of nutrition knowledge<br />
• behaviors related to dairy products<br />
• limited food preferences<br />
• concerns about finances<br />
• lack of food variety<br />
• concerns about food sanitation<br />
• limited food availability<br />
Two subcategories represented the<br />
barriers: predisposing factors <strong>and</strong><br />
enabling factors. Researchers identified<br />
four types of barriers related to predisposing<br />
factors: customs <strong>and</strong> beliefs,<br />
food h<strong>and</strong>ling/sanitation, nutrition<br />
knowledge, <strong>and</strong> health reasons/disease<br />
state/food intolerance. Researchers also<br />
identified four types of barriers related<br />
to enabling factors: food preferences,<br />
financial issues, food variety <strong>and</strong><br />
availability, <strong>and</strong> behaviors. In terms<br />
of food preferences, the participants<br />
discussed the need to learn to eat <strong>and</strong><br />
learn to like new foods to increase<br />
calcium intake. Participants identified<br />
Table 1. Demographic characteristics<br />
of African-American seniors<br />
Variables<br />
Percent<br />
Educational level 1<br />
several marketing <strong>and</strong> educational<br />
strategies to improve the calcium<br />
nutrition knowledge of the African-<br />
American population. Although most<br />
participants had less than a high school<br />
education, they were articulate <strong>and</strong><br />
participated actively in the focus group<br />
discussions. The only physical barrier<br />
mentioned in the focus groups was<br />
digestive problems, which is different<br />
from the findings of others (Fischer &<br />
Johnson, 1990; Skaien, 1982). These<br />
researchers had shown physical<br />
barriers to be a substantial cause<br />
of nutritional deficiencies.<br />
Demographic Data <strong>and</strong><br />
Food Preference<br />
For these participants, fruits, vegetables,<br />
grains, <strong>and</strong> desserts were the<br />
favorite foods. The frequency data<br />
derived from the demographic survey<br />
supported these statements <strong>and</strong><br />
revealed that almost 90 percent of<br />
these participants liked <strong>and</strong> ate food<br />
from all food groups. Several of the<br />
participants stated that collard or<br />
mustard greens were a favorite food.<br />
Of those that mentioned greens as a<br />
favorite food, several said they not only<br />
ate greens <strong>for</strong> dinner but sometimes <strong>for</strong><br />
breakfast or lunch as well.<br />
Because salmon was the only meat<br />
mentioned in the frequency data, meat<br />
preferences were not determined. On<br />
the frequency checklist, the participants<br />
indicated whether they liked or ate<br />
dairy products, but these items were<br />
not mentioned as favorite foods in the<br />
focus group discussions. When the<br />
moderators probed about dairy foods,<br />
many participants indicated they did<br />
not like the taste of the foods or they<br />
had been instructed to eliminate them<br />
from their diet <strong>for</strong> health/disease<br />
reasons. These participants did not<br />
mention total avoidance of calcium-rich<br />
foods.<br />
Barriers to Calcium Intake<br />
One of the challenges <strong>for</strong> underst<strong>and</strong>ing<br />
<strong>and</strong> discussing the barriers<br />
to calcium intake among the urban<br />
African-American elders is the interaction<br />
among factors. For example, lack<br />
of nutritional knowledge may interact<br />
with health status <strong>and</strong> disease state.<br />
Alternatively, concern <strong>for</strong> food<br />
h<strong>and</strong>ling <strong>and</strong> sanitation can interact<br />
with food preferences <strong>and</strong> selections.<br />
Overall, barriers discovered during this<br />
investigation are similar to the barriers<br />
identified by Zablah, Reed, Hegsted,<br />
<strong>and</strong> Keenan (1999) when they interviewed<br />
90 African-American women<br />
who were either pregnant or had<br />
children 5 years old or younger. Zablah<br />
<strong>and</strong> colleagues found that participants<br />
perceived they consumed enough<br />
calcium, disliked the taste of some<br />
calcium-rich foods, experienced<br />
digestion problems, had a perceived<br />
lack of knowledge of products containing<br />
calcium, <strong>and</strong> were concerned<br />
about cholesterol <strong>and</strong> the high-calorie<br />
content of these foods. Thus, both the<br />
mothers of young children <strong>and</strong> elderly<br />
African Americans have concerns<br />
related to dietary calcium intake <strong>and</strong><br />
food sources of calcium.<br />
Barriers Related to<br />
Predisposing Factors<br />
Customs <strong>and</strong> beliefs. In general, participants<br />
considered milk a healthful<br />
food, connected with cows <strong>and</strong> wonderful<br />
family memories. For example,<br />
one participant stated, “. . . [B]eing<br />
raised on the farm, we had to milk the<br />
cows. So we knew that was good. We<br />
always knew. My daddy insisted that<br />
we drink milk.” A participant even<br />
considered milk a healing food, having<br />
recommended milk as a food to a<br />
convalescing friend. This friend, a<br />
member of the same focus group as<br />
the participant, testified that she now<br />
drinks milk daily. However, participants<br />
discussed the image of milk as a child’s<br />
food as well, associating the “Got Milk”<br />
campaign with children. Calcium<br />
requirements were not mentioned in<br />
the context of a chronic disease state or<br />
as a religious dietary restriction. (In a<br />
similar focus group held with Women,<br />
Infants, <strong>and</strong> Children Program participants,<br />
one mother mentioned her plans<br />
to eliminate milk from the diet of an<br />
elementary school-age child because<br />
of her religious beliefs [unpublished<br />
data].) Participants suggested milk as<br />
an aid <strong>for</strong> acute problems, such as<br />
ankle problems <strong>and</strong> “popping bones,”<br />
described as “bones that don’t act<br />
right.”<br />
Food <strong>and</strong> nutrition knowledge.<br />
Participants in the focus group<br />
discussions wanted in<strong>for</strong>mation about<br />
nutrition <strong>and</strong> calcium. Participants<br />
considered milk good <strong>for</strong> bones <strong>and</strong><br />
teeth <strong>and</strong> were concerned about bone<br />
health <strong>and</strong> disease prevention in spite<br />
of being unable to describe calciumrelated<br />
deficiency diseases. However,<br />
one participant discussed her bout<br />
with osteoporosis, <strong>and</strong> the pain<br />
<strong>and</strong> discom<strong>for</strong>t involved with this<br />
debilitating disease. Additional<br />
examples of basic lack of knowledge<br />
included calcium content of foods<br />
<strong>and</strong> complications related to poor<br />
calcium intake. Participants also<br />
confused eggs with dairy products.<br />
In addition, although participants<br />
correctly identified milk <strong>and</strong> cheese<br />
products as containing cholesterol,<br />
they failed to identify lowfat milk <strong>and</strong><br />
cheese products as appropriate dietary<br />
modification <strong>for</strong> those concerned with<br />
dietary cholesterol. For example, one<br />
participant stated, “Well, I like cheese,<br />
but you know they say cheese is so<br />
bad <strong>for</strong> you now <strong>for</strong> cholesterol. So I<br />
don’t eat too much cheese.”<br />
The discussions revealed that participants<br />
were surprised that greens were<br />
a source of calcium. When moderators<br />
provided the participants with a list of<br />
calcium-rich foods that included greens<br />
(100 mg calcium per ½ cup serving),<br />
many said they were unaware that<br />
8 Family Economics <strong>and</strong> <strong>Nutrition</strong> Review
greens were a good source of dietary<br />
calcium. One participant commented,<br />
“I didn’t know [turnip greens] had<br />
calcium. I know I love them.” In<br />
addition to greens, participants<br />
seemed surprised to learn about the<br />
high calcium content of many foods,<br />
such as sardines with bones, prunes,<br />
broccoli, spinach, <strong>and</strong> tofu. Although<br />
the basis of such confusion may be lack<br />
of nutrition knowledge, the confusion<br />
may also relate to how health care<br />
professionals organize nutrition<br />
knowledge. It is possible that the issue<br />
of food categories in terms of nutrients<br />
may represent a difference in the<br />
organizational schema of nutritional<br />
sciences based on nutrients, while that<br />
of the participants’ knowledge may be<br />
based on other factors. Krall, Dwyer,<br />
<strong>and</strong> Coleman (1988) said it this way:<br />
[A] person’s memory is likely<br />
to follow personal schemes<br />
such as food combinations,<br />
time, location, etc. The<br />
categorization scheme, such<br />
as nutrient-related groups, is<br />
not well understood by most<br />
lay persons, [<strong>and</strong> is] there<strong>for</strong>e,<br />
alien to the manner in which<br />
[their] in<strong>for</strong>mation was stored,<br />
[<strong>and</strong>] imposes an arbitrary<br />
structure which potentially<br />
leads to inefficient recall.<br />
In addition, concerns about food<br />
h<strong>and</strong>ling <strong>and</strong> sanitation practices of<br />
food service establishments served<br />
as a deterrent to ordering milk as a<br />
beverage when eating out.<br />
“Now, I wouldn’t order milk<br />
out—because I use to work at<br />
a restaurant . . . . If they bring<br />
[milk] to me in a glass, I<br />
wouldn’t drink it. [Researcher:<br />
How come?]. . . Well, we had<br />
a keg. And, everyone would<br />
dip their h<strong>and</strong> down in that<br />
keg, <strong>and</strong> they’d want the<br />
employees to drink that milk,<br />
. . . Well, we could get milk<br />
[from] the dining room, but<br />
the other help had to get milk<br />
from . . . that keg, <strong>and</strong> I didn’t<br />
think that was right.”<br />
Health reasons, disease state, <strong>and</strong> food<br />
intolerance. Many of the participants<br />
were concerned about health <strong>and</strong><br />
disease-related issues. They were<br />
especially concerned with heart<br />
disease, high blood pressure, high<br />
cholesterol, <strong>and</strong> arthritis. Previous<br />
research also found similar health<br />
concerns in rural African-American<br />
elderly (Lee, Templeton, Marlette,<br />
Walker, & Fahm, 1998; Wallace, Fox, &<br />
Napier, 1996). As one participant in the<br />
1996 study commented: “I drink a little<br />
milk, . . . I can’t h<strong>and</strong>le milk too good<br />
unless I’m at home.” Thus, participants<br />
in the 1996 study sometimes tied these<br />
concerns to food restrictions, especially<br />
when their physician instructed them<br />
to eliminate certain foods from their<br />
diets. The participants reported being<br />
educated by their physician or nurse<br />
(none mentioned a dietitian) about<br />
which foods to avoid. Participants often<br />
followed medical recommendations to<br />
avoid or restrict a food group that was a<br />
calcium source without any instruction<br />
on how to replace the calcium in their<br />
diet.<br />
In terms of lactose intolerance,<br />
symptoms mentioned included<br />
flatulence, <strong>and</strong> stomach problems.<br />
Participants also mentioned that dairy<br />
products, such as milkshakes, were<br />
“too rich <strong>for</strong> the system,” although this<br />
could be related to the fat or sugar<br />
content. Generally, participants did not<br />
specifically mention dietary strategies<br />
<strong>for</strong> managing lactose intolerance, such<br />
as consuming yogurt or acidophilus<br />
milk or using lactase tablets. However,<br />
one participant mentioned the lack of<br />
lactose-free products as a barrier to<br />
purchasing dairy products in food<br />
service establishments.<br />
The focus group participants<br />
expressed an interest in all types<br />
of educational media including<br />
direct mail, television, radio,<br />
newspapers, <strong>and</strong> magazines.<br />
2003 Vol. 15 No. 1 9
Among the elderly, the perception of<br />
milk intolerance appears to vary with<br />
ethnicity <strong>and</strong> gender. Elbon, Johnson,<br />
Fisher, <strong>and</strong> Searcy (1999), in a national<br />
telephone survey of 475 older American<br />
participants, including 27 African<br />
Americans, found that 35 percent of<br />
the African-American respondents<br />
considered themselves milk intolerant,<br />
whereas only 17 percent of the Whites<br />
did so. Twice as many women (21<br />
percent) considered themselves milk<br />
intolerant than did the men (10 percent).<br />
Others found similar avoidance based<br />
on perception (Buchowski, Semenya,<br />
& Johnson, 2002).<br />
Barriers Related to<br />
Enabling Factors<br />
The barriers related to enabling factors<br />
were food preferences, financial issues,<br />
food variety <strong>and</strong> availability, <strong>and</strong><br />
behaviors related to calcium-containing<br />
foods. In terms of food preferences,<br />
to help improve calcium intake, the<br />
participants discussed the need to learn<br />
to eat <strong>and</strong> enjoy new foods <strong>and</strong> learn<br />
how relatives, friends, <strong>and</strong> interactions<br />
at social gatherings (e.g., at church)<br />
influenced their food choices by<br />
introducing new foods. (Participants<br />
demonstrated a willingness to try the<br />
calcium-<strong>for</strong>tified juice provided as<br />
a snack during all focus group<br />
discussions.)<br />
Subjects participated in the tradition of<br />
extended family members influencing<br />
food choices by encouraging their<br />
gr<strong>and</strong>children to drink milk. One subject<br />
told the story of how she learned to eat<br />
broccoli:<br />
“This broccoli, I never was too<br />
fond of it, but my son-in-law,<br />
when they were living here in<br />
town, use to cook dinner on<br />
Sundays <strong>and</strong> invite me over.<br />
And he would fix the broccoli. I<br />
didn’t want to hurt his feelings.<br />
So I started eating broccoli, <strong>and</strong><br />
Table 2. Marketing <strong>and</strong> educational strategies <strong>for</strong> promoting calcium intake<br />
suggested by African-American seniors<br />
Strategies<br />
Direct mail<br />
Media<br />
In<strong>for</strong>mal educational sessions<br />
Location<br />
Desired tactics<br />
n = 56.<br />
sometimes I get it . . . when I go<br />
out, ‘cause I don’t do too much<br />
cooking at home. But, I’ll eat<br />
the broccoli especially, you<br />
know, with some cheese on it.”<br />
In addition, the participants seemed<br />
to categorize foods into good <strong>and</strong> bad<br />
foods as well as in terms of a diseasebased<br />
model, that is, to eliminate foods<br />
due to a disease.<br />
Some participants mentioned financial<br />
concerns as a barrier to intake of milk<br />
products. Financial issues related to<br />
the cost of food are not only a concern<br />
among the urban southern elderly<br />
African Americans, but also among<br />
the rural southern African Americans.<br />
Lee <strong>and</strong> colleagues (1998) found that<br />
more than 70 percent of rural African-<br />
American elders considered food (<strong>and</strong><br />
medical) costs to be a serious issue.<br />
Recommendations<br />
Brochures<br />
Newsletters<br />
Magazines<br />
Television<br />
Radio<br />
Newspapers<br />
Tasting parties<br />
Focus group discussions<br />
Peer education<br />
Senior citizens’ center schools<br />
Library<br />
Grocery store<br />
School or family reunions<br />
Large print text<br />
Colorful with pictures<br />
Diet-appropriate ethnic foods<br />
For example, focus group participants<br />
mentioned cost issues as reasons <strong>for</strong><br />
not ordering milk at a food service<br />
establishment.<br />
Participants indicated that availability<br />
of some calcium-containing foods might<br />
influence consumption (e.g., calciumcontaining<br />
juice). In terms of behaviors,<br />
participants mentioned postponing<br />
drinking milk to avoid flatulence during<br />
social engagements. This behavior<br />
appears to indicate that participants<br />
were struggling with how to maintain<br />
consumption of dairy products in spite<br />
of symptoms of lactose intolerance. In<br />
such cases, nutrition education could<br />
help the elderly develop more effective<br />
strategies <strong>for</strong> managing lactose<br />
intolerance.<br />
10 Family Economics <strong>and</strong> <strong>Nutrition</strong> Review
Marketing <strong>and</strong> education<br />
strategies<br />
The focus group participants expressed<br />
an interest in all types of educational<br />
media including direct mail, television,<br />
radio, newspapers, <strong>and</strong> magazines<br />
(table 2). They found it enjoyable<br />
to learn in social settings, such as<br />
community center classes, church<br />
meetings, family <strong>and</strong> class reunions,<br />
<strong>and</strong> the senior citizens’ center. Tastetesting<br />
sessions in any setting were<br />
particularly appealing to the group.<br />
Other routes of nutrition education<br />
delivery included sessions at the<br />
library, food bank, <strong>and</strong> the commodity<br />
food distribution centers. The input<br />
from the participants involved in the<br />
present study clearly shows that a<br />
number of strategies might be<br />
successful in increasing African-<br />
American seniors’ knowledge<br />
about adequate calcium intake.<br />
One strategy that has benefitted elders<br />
is church-based health promotion.<br />
Ransdell (1995) discussed why such<br />
promotional strategies have been<br />
successful <strong>and</strong> are appropriate <strong>for</strong><br />
many elderly. In addition, the comments<br />
of African-American caregivers that<br />
spiritual activities promote health, as<br />
reported in a recent study (McDonald,<br />
Fink, & Wykle, 1999), probably reflect<br />
the sentiment of many others in the<br />
community. While working with urb<strong>and</strong>welling<br />
minority elders, Wieck (2000)<br />
found that health promotion activities<br />
work best when the focus is on small,<br />
achievable goals in the context of<br />
short-focused educational sessions.<br />
Hurdle (2001) discussed the importance<br />
of social support as a component of<br />
health promotion activities. Hurdle’s<br />
report helps, in part, to explain the<br />
positive response of the elders to the<br />
focus group approach used by this<br />
study. The focus group may have<br />
helped support “connectedness”<br />
(Belenky, Clinchy, Goldberger, &<br />
Tarule, 1986), <strong>and</strong> may help with the<br />
sense of community fostered by the<br />
center at which the focus groups were<br />
conducted. Furthermore, others found<br />
that women were more likely than men<br />
to participate in health-promoting<br />
activities <strong>and</strong> relaxation, while men were<br />
more likely than women to participate in<br />
exercise (Felton, Parsons, & Bartoces,<br />
1997). There<strong>for</strong>e, gender patterns of<br />
response to health promotion should<br />
be considered when planning healthpromoting<br />
activities.<br />
Summary <strong>and</strong><br />
Recommendations<br />
In this pilot study, focus group interactions<br />
were excellent means to elicit<br />
African-American elders’ opinions<br />
about barriers <strong>and</strong> educational<br />
strategies related to calcium intake.<br />
The results may not be generally<br />
applicable, because they pinpoint the<br />
existence of barriers to adequate<br />
calcium intake among one group of<br />
African-American seniors. Within this<br />
group, health/disease states <strong>and</strong> lack<br />
of knowledge appeared to be the<br />
primary <strong>and</strong> secondary barriers reported,<br />
respectively. Although similar<br />
studies quantify calcium intake in this<br />
population, they provide only limited<br />
insight of the barriers. There<strong>for</strong>e,<br />
further studies are necessary to validate<br />
the current findings. A future research<br />
plan could include correlating calcium<br />
intake data with results from focus<br />
group discussions.<br />
The participants in the present study<br />
provided suggestions that are beneficial<br />
<strong>for</strong> educators who develop materials<br />
<strong>and</strong> methods <strong>for</strong> nutrition instruction.<br />
Specifically, the elderly participants<br />
requested disease-specific calcium<br />
education directed to their level of<br />
learning <strong>and</strong> that would be provided<br />
in a community-based <strong>and</strong> socially<br />
centered environment. The seniors<br />
in this study wanted the following<br />
in<strong>for</strong>mation: linkage between calcium<br />
sources <strong>and</strong> specific disease states,<br />
calcium content of foods, high-calcium<br />
recipes provided in grocery stores at<br />
the point of purchase, cooking demonstrations<br />
or taste-testing parties<br />
featuring calcium-rich foods, <strong>and</strong><br />
strategies <strong>for</strong> managing dairy-related<br />
food intolerance.<br />
Health care providers, social workers,<br />
food assistance program managers,<br />
volunteers who work with the elderly,<br />
<strong>and</strong> family members must also be<br />
educated on adequate calcium intake<br />
<strong>for</strong> these seniors. Educational programs<br />
should concentrate on introducing new<br />
foodstuffs into seniors’ diets <strong>and</strong><br />
teaching them to substitute item that<br />
have been omitted from their diets<br />
<strong>for</strong> medical reasons with alternative<br />
calcium-containing foods. Identification<br />
<strong>and</strong> recognition of calcium barriers<br />
should be determined across cultures<br />
<strong>and</strong> age groups, if educators hope to<br />
promote adequate calcium intakes.<br />
2003 Vol. 15 No. 1 11
References<br />
Alaimo, K., McDowell, M.A., Briefel, R.R., Bischof, A.M., Caughman, C.R., Loria,<br />
C.M. et al. (1994, November 14). Dietary Intake of Vitamins, Minerals, <strong>and</strong> Fiber of<br />
Persons Ages 2 Months <strong>and</strong> Over in the United States: Third National Health <strong>and</strong><br />
<strong>Nutrition</strong> Examination Survey, Phase 1, 1988-91. Advance Data No. 258.<br />
Hyattsville, MD: National <strong>Center</strong> <strong>for</strong> Health Statistics.<br />
Aloia, J.F., Vaswani, A., Yeh, J.K., & Flaster, E. (1996). Risk <strong>for</strong> osteoporosis in<br />
black women. Calcified Tissue International, 59(6), 415-423.<br />
Annual Update of the HHS Poverty Guidelines, 7 Federal Register 13428-13430<br />
(1999) (codified at 42 CFR 124).<br />
Belenky, M.F., Clinchy, B.M., Goldberger, N.R., & Tarule, J.M. (1986). Women’s<br />
Ways of Knowing: The Development of Self, Voice, <strong>and</strong> Mind. New York: Basic<br />
Books.<br />
Buchowski, M.S., Semenya, J., & Johnson, A.O. (2002). Dietary calcium intake in<br />
lactose maldigesting intolerant <strong>and</strong> tolerant African American women. Journal of<br />
the American College of <strong>Nutrition</strong>, 21(1), 47-54.<br />
Cohen, N.L., Ralston, P.A., Laus, M.J., Bermudez, O., & Olson, R.B. (1998). Food<br />
practices, service use, <strong>and</strong> dietary quality in elderly Blacks. Journal of <strong>Nutrition</strong><br />
<strong>for</strong> the <strong>Elderly</strong>, 17(4), 17-34.<br />
Elbon, S.M., Johnson, M.A., Fisher, J.G., & Searcy, C.A. (1999). The influence of<br />
perceived milk intolerance on dairy product consumption in older American adults.<br />
Journal of <strong>Nutrition</strong> <strong>for</strong> the <strong>Elderly</strong>, 19(1), 25-39.<br />
Felton, G.M., Parsons, M.A., & Bartoces, M.G. (1997). Demographic factors:<br />
Interaction effects on health-promoting behaviors <strong>and</strong> health related factors.<br />
Public Health Nursing, 14(6), 361-367.<br />
Fischer, J., & Johnson, M.A. (1990). Low body weight <strong>and</strong> weight lose in the aged.<br />
Journal of the American Dietetic Association, 90(12), 1697-1706.<br />
Fleming, K.H., & Heimbach, J.T. (1994). Consumption of calcium in the U.S.: Food<br />
sources <strong>and</strong> intake levels. Journal of <strong>Nutrition</strong>, 124(8), 1426S-1430S.<br />
Green, L.W., & Kreuter, M.W. (1991). Health <strong>Promotion</strong> Planning: An<br />
Educational <strong>and</strong> Environmental Approach (2 nd ed.). Mountain View, CA:<br />
Mayfield Pub. Co.<br />
Holahan, K.B., & Kunkel, M.E. (1986). Contribution of the Title III meals program to<br />
nutrient intake of participants. Journal of <strong>Nutrition</strong> <strong>for</strong> the <strong>Elderly</strong>, 6(1), 45-54.<br />
Hurdle, D.E. (2001). Social support: A critical factor in women’s health <strong>and</strong> health<br />
promotion. Health & Social Work, 26(2), 72-79.<br />
12 Family Economics <strong>and</strong> <strong>Nutrition</strong> Review
Jackson, K.A., & Savaiano, D.A. (2001). Lactose maldigestion, calcium intake <strong>and</strong><br />
osteoporosis in African-, Asian-, <strong>and</strong> Hispanic-Americans. Journal of the<br />
American College of <strong>Nutrition</strong>, 20(Suppl. 2), 198S-207S.<br />
Johnson, A.O., Semenya, J.G., Buchowski, M.S., Enwonwu, C.O., & Scrimshaw,<br />
N.S. (1993). Correlation of lactose maldigestion, lactose intolerance, <strong>and</strong> milk<br />
intolerance. The American Journal of Clinical <strong>Nutrition</strong>, 57(3), 399-401.<br />
Joint National Committee. (1993). The Fifth Report of the Joint National Committee<br />
on Detection, Evaluation <strong>and</strong> Treatment on High Blood Pressure (JNCV). Archives<br />
of Internal Medicine, 153(2), 154-183.<br />
Koh, E.T., & Chi, M.S. (1981). Clinical signs found in association with nutritional<br />
deficiencies as related to race, sex, <strong>and</strong> age of adults. The American Journal of<br />
Clinical <strong>Nutrition</strong>, 34(8), 1562-1568.<br />
Krall, E., Dwyer, J., & Coleman, K. (1988). Factors influencing accuracy of<br />
dietary recall. <strong>Nutrition</strong> Research, 8, 829-841.<br />
Krueger, R.A. (1998). Developing Questions <strong>for</strong> Focus Groups: Focus Group Kit<br />
3. Thous<strong>and</strong> Oaks, CA: Sage Publications.<br />
Lee, C.J., Templeton, S.B., Marlette, M., Walker, R.S., & Fahm, E.G. (1998). Diet<br />
quality <strong>and</strong> nutrient intakes of Black southern rural elderly. Journal of <strong>Nutrition</strong><br />
<strong>for</strong> the <strong>Elderly</strong>, 17(4), 1-15.<br />
Luckey, M.M., Meier, D.E., M<strong>and</strong>eli, P.J., Decosta, M.C., Hubbard, M.L., &<br />
Goldsmith, S.J. (1989). Radial <strong>and</strong> vertebral bone density in White <strong>and</strong> Black<br />
women: Evidence <strong>for</strong> racial differences in premenopausal bone homeostasis. The<br />
Journal of Clinical Endocrinology <strong>and</strong> Metabolism, 69(4), 762-770.<br />
McDonald, P.E., Fink, S.V., & Wykle, M.L. (1999). Self-reported healthpromoting<br />
behaviors of Black <strong>and</strong> White caregivers. Western Journal of Nursing<br />
Research, 21(4), 538-548.<br />
McMillan, J.H., & Schumacher, S. (1997). Research in Education: A Conceptual<br />
Introduction. New York: Harper Collins College Publishers.<br />
National Academy Press. (1997). Dietary Reference Intakes: For Calcium,<br />
Phosphorus, Magnesium, Vitamin D <strong>and</strong> Fluoride. St<strong>and</strong>ing Committee on the<br />
Scientific Evaluation of Dietary Reference Intakes, Food <strong>and</strong> <strong>Nutrition</strong> Board,<br />
Institute of Medicine. Washington, DC: Author.<br />
National Institutes of Health. (1998). Osteoporosis <strong>and</strong> African American women.<br />
Retrieved February 23, 2001, from http://www.osteo.org.<br />
National Research Council. (1989). Recommended Dietary Allowances, (10th ed.).<br />
Washington, DC: National Academy Press.<br />
Pollitzer, W.S., & Anderson, J.J. (1989). Ethnic <strong>and</strong> genetic differences in bone<br />
mass: A review with a hereditary vs environmental perspective. American Journal<br />
of Clinical <strong>Nutrition</strong>, 50(6), 1244-1259.<br />
2003 Vol. 15 No. 1 13
Ransdell, L.B. (1995). Church-based health promotion: An untapped resource <strong>for</strong><br />
women 65 <strong>and</strong> older. American Journal of Health <strong>Promotion</strong>, 9(5), 333-336.<br />
Reed, D.B., Meeks, P.M., Nguyen, L., Cross, E.W., & Garrison, M.E.B. (1998).<br />
Assessment of nutrition education needs related to increasing dietary calcium<br />
intake in low-income Vietnamese mothers using focus group discussions. Journal<br />
of <strong>Nutrition</strong> Education, 30(3), 155-163.<br />
Riggs, B.L., Peck, W.A., & Bell, N.H. (1991). Physician’s Resource Manual on<br />
Osteoporosis: A Decision-Making Guide (2 nd ed.). Washington, DC: National<br />
Osteoporosis Foundation.<br />
Shimakawa, T., Sorlie, P., Carpenter, M.A., Dennis, B., Tell, G.S., Watson, R.,<br />
et al. (1994). Dietary intake patterns <strong>and</strong> sociodemographic factors in the<br />
atherosclerosis risk in communities study: ARIC study investigators. Preventive<br />
Medicine, 23(6), 769-780.<br />
Silverman, S.L., & Madison, R.E. (1988). Decreased incidence of hip fracture in<br />
Hispanics, Asians, <strong>and</strong> Blacks: Cali<strong>for</strong>nia hospital discharge data. American<br />
Journal of Public Health, 78(11), 1482-1483.<br />
Skaien, P. (1982). Inadequate nutrition in the elderly: A stumbling block to good<br />
health. In T. J. Wells, (Ed.), Aging <strong>and</strong> Health <strong>Promotion</strong>. Rockville, MD: Aspen<br />
Publishers, Inc.<br />
Slesinski, M.J., Subar, A.F., & Kahle, L.L. (1996). Dietary intake of fat, fiber <strong>and</strong><br />
other nutrients is related to the use of vitamin <strong>and</strong> mineral supplements in the<br />
United States: The 1992 National Health Interview Survey. Journal of <strong>Nutrition</strong>,<br />
126(12), 3001-3008.<br />
SPSS Reference Guide, Windows Version 10. (1999). Chicago, IL: SPSS Inc.<br />
Wallace, D.C., Fox, T.A., & Napier, E. (1996). Community-based service utilization<br />
among African American elderly. Journal of Gender, Culture, <strong>and</strong> Health, 1(4),<br />
295-308.<br />
Wieck, K.L. (2000). Health promotion <strong>for</strong> inner-city minority elders. Journal of<br />
Community Health Nursing, 17(3), 131-139.<br />
Yates, A.A., Schliker, S.A., & Suitor, C.W. (1998). Dietary Reference Intakes: The<br />
new basis <strong>for</strong> recommendations <strong>for</strong> calcium <strong>and</strong> related nutrients, B vitamins, <strong>and</strong><br />
cholene. Journal of the American Dietetic Association, 98(6), 699-706.<br />
Zablah, E.M., Reed, D.B., Hegsted, M., & Keenan, M.J. (1999). Barriers to calcium<br />
intake in African American women. Journal of Human <strong>Nutrition</strong> <strong>and</strong> Dietetics,<br />
12(2), 123-132.<br />
14 Family Economics <strong>and</strong> <strong>Nutrition</strong> Review
The Influence of the Healthy Eating<br />
<strong>for</strong> Life Program on Eating<br />
Behaviors of Nonmetropolitan<br />
Congregate Meal Participants<br />
Cynthia A. Long, MS, RD<br />
Ohio State University Extension—<br />
Craw<strong>for</strong>d County<br />
Alma Montano Saddam, PhD, RD<br />
The Ohio State University<br />
Nikki L. Conklin, PhD<br />
Ohio State University Extension<br />
Scott D. Scheer, PhD<br />
The Ohio State University <strong>and</strong><br />
Ohio State University Extension<br />
Current research indicates that when older adults increase their consumption of<br />
fruits <strong>and</strong> vegetables, they maintain or improve their health. Thus, their quality of<br />
life can be improved <strong>and</strong> health care costs lowered. A purposive sample of older<br />
adults (treatment group, n=50; control group, n=51) attending congregate meals<br />
participated in this study, with the treatment group receiving four lessons on<br />
fruits <strong>and</strong> vegetables over 4 weeks. The Stages of Change construct of the<br />
Transtheoretical Model was used to identify separate stages of change related<br />
to fruit- <strong>and</strong> vegetable-eating behaviors. Pre- versus post-test results showed that<br />
the treatment group’s consumption of vegetables changed significantly, a positive<br />
movement from a lower stage of change (e.g., from Precontemplation, which was<br />
30 percent at pre-test <strong>and</strong> 12 percent at post-test) to a higher category at posttest<br />
(e.g., taking action to change, or maintaining, their fruit- <strong>and</strong> vegetable-eating<br />
behaviors). Based on findings of this study, lessons on fruits <strong>and</strong> vegetables<br />
that include the Healthy Eating <strong>for</strong> Life Program (HELP) may promote positive<br />
changes in eating behaviors of nonmetropolitan participants of congregate<br />
meals <strong>and</strong> should be considered <strong>for</strong> study with similar older adult populations.<br />
T<br />
he older adult population in the<br />
United States is growing quickly<br />
(Price, 2001). The older adult<br />
population is projected to increase<br />
throughout the next several decades.<br />
In 2000, <strong>for</strong> example, 35.0 million<br />
Americans (12.4 percent) were 65 years<br />
old <strong>and</strong> older (Hetzel & Smith, 2001).<br />
By 2010, 39.7 million Americans (13.2<br />
percent) will be 65 years old <strong>and</strong> over,<br />
<strong>and</strong> by 2030, up to 20 percent of the<br />
U.S. population will be over age 65<br />
(U.S. Census Bureau, 2000a; U.S.<br />
Census Bureau, 2000b). Along with this<br />
redistribution of the U.S. population,<br />
concerns related to aging may increase,<br />
including those related to the health<br />
<strong>and</strong> well-being of the older generation<br />
(Rogers, 1999).<br />
For example, the U.S. Department<br />
of Agriculture reported that Americans’<br />
diets need to improve, including those<br />
of the elderly (Basiotis, Carlson,<br />
Gerrior, Juan, & Lino, 2002). Although<br />
aging is not itself a cause of malnutrition,<br />
related risk factors can<br />
affect older adults’ nutritional intake,<br />
contribute to malnutrition (Wellman,<br />
Weddle, Kranz, & Brain, 1997), <strong>and</strong> be<br />
“multiple <strong>and</strong> synergistic” (American<br />
Dietetic Association [ADA], 2000).<br />
Other factors that may contribute to<br />
the dietary status of the members of<br />
this growing older population are the<br />
types of nutrition messages they<br />
receive <strong>and</strong> their readiness to change<br />
diet-related behaviors.<br />
2003 Vol. 15 No. 1 15
Background<br />
A 1996 report by the American Dietetic<br />
Association discussed the increased<br />
challenges of competing with<br />
conflicting nutrition messages that<br />
consumers receive from a variety of<br />
sources. The public needs sciencebased<br />
in<strong>for</strong>mation that not only<br />
educates, but also encourages the<br />
adoption of more healthful nutritionrelated<br />
behaviors. An update of this<br />
Association’s report notes that research<br />
is needed to develop <strong>and</strong> test costeffective<br />
methods <strong>for</strong> evaluating the<br />
efficacy of nutrition education<br />
programs. For effective behavior<br />
change, nutrition education programs<br />
must be based on the target audience’s<br />
needs, behaviors, motivations, <strong>and</strong><br />
desires. And the gap between<br />
knowledge of nutrition <strong>and</strong> actual<br />
healthful eating practices must be<br />
narrowed by providing nutrition<br />
in<strong>for</strong>mation in a usable <strong>for</strong>m to<br />
consumers (ADA, 1996).<br />
In the 1970s, Prochaska <strong>and</strong> colleagues<br />
began studying how people make<br />
changes. Their ef<strong>for</strong>ts led to the<br />
development of the Transtheoretical<br />
Model, of which the Stages of Change<br />
is a construct (Prochaska, Norcross,<br />
& DiClemente, 1994). Prochaska,<br />
attempting to bring together the<br />
components of the major psychotherapy<br />
theories regarding how people<br />
acquire successful behavior change,<br />
found that the many theories could be<br />
summarized by principles called the<br />
“processes of change.” He was<br />
especially interested in how “selfchangers”<br />
progress along a continuum<br />
of change—from Precontemplation to<br />
Contemplation, Preparation, Action,<br />
Maintenance, <strong>and</strong> Termination—<br />
without therapy or a professional<br />
program (box 1).<br />
According to this construct, successful<br />
change requires that self-changers<br />
know the stage in which they are<br />
located <strong>and</strong> subsequently use<br />
appropriately timed strategies.<br />
Initial thoughts were that self-changers<br />
moved linearly from one stage to<br />
the next. In reality, successful selfchangers<br />
may recycle through the<br />
Stages of Change several times be<strong>for</strong>e<br />
successfully reaching the Maintenance<br />
or Termination stage (Prochaska,<br />
Norcross, & DiClemente, 1994).<br />
In studies of health behaviors, older<br />
adults have been found to fall primarily<br />
into the Precontemplation or<br />
Maintenance stage, there<strong>for</strong>e, calling<br />
<strong>for</strong> nutrition education ef<strong>for</strong>ts to be<br />
targeted at the Precontemplation stage<br />
(Nigg et al., 1999), where people do<br />
not perceive there is a need to change.<br />
The assumption is that people at the<br />
Precontemplation stage <strong>for</strong> adoption<br />
of a healthful diet need in<strong>for</strong>mation<br />
that assists them in becoming aware<br />
of the personal benefits of healthful<br />
eating behaviors (La<strong>for</strong>ge, Greene,<br />
& Prochaska, 1994). Persons in the<br />
Maintenance stage⎯where behavior<br />
changes have occurred <strong>for</strong> more than<br />
6 months⎯may experience some<br />
relapse (Kristal, Glanz, Curry, &<br />
Patterson, 1999), may need in<strong>for</strong>mation<br />
about local resources, <strong>and</strong> may<br />
need strategies to help them deal with<br />
barriers to maintaining their dietary<br />
changes.<br />
Implications <strong>for</strong> nutrition education<br />
programs <strong>for</strong> older adults include<br />
underst<strong>and</strong>ing <strong>and</strong> applying successful<br />
program elements, providing a clear<br />
plan <strong>for</strong> education <strong>and</strong> having that<br />
education based on segmented needs<br />
of the older population, adapting<br />
locally, <strong>and</strong> using existing services to<br />
provide education. These implications<br />
point to the need <strong>for</strong> research of<br />
behavior-based nutrition education<br />
<strong>for</strong> older adults (Contento et al., 1995).<br />
Thus, this study examines the influence<br />
of a nutrition education<br />
intervention⎯the Healthy Eating<br />
<strong>for</strong> Life Program (HELP)⎯on the eating<br />
behaviors of a select group of older<br />
adults that participated in congregate<br />
meal programs. Because the scientific<br />
evidence supporting the healthful<br />
benefits of fruit <strong>and</strong> vegetable<br />
consumption is significant (U.S.<br />
Department of Health <strong>and</strong> Human<br />
Services [DHHS], 2000; Tate & Patrick,<br />
2000; Gerrior, 1999), we focus on<br />
behavior changes related to the<br />
consumption of these food items.<br />
According to current research, older<br />
adults may maintain or improve their<br />
health by increasing their intake of<br />
fruits <strong>and</strong> vegetables, thus possibly<br />
lowering health care costs <strong>and</strong><br />
increasing their quality of life<br />
(ADA, 2000; Gerrior, 1999). <strong>Nutrition</strong><br />
education curricula <strong>for</strong> older adults<br />
are available <strong>for</strong> use, but the ability of<br />
these curricula to increase the servings<br />
of fruits <strong>and</strong> vegetables consumed by<br />
older adults is uncertain (Clarke &<br />
Mahoney, 1996; Contento et al, 1995).<br />
Hence, more evaluation studies are<br />
needed of the influence of nutrition<br />
education programs that are designed<br />
<strong>for</strong> older adults at congregate meal<br />
sites.<br />
Methods<br />
Subjects<br />
The target population <strong>for</strong> this study<br />
consisted of community-dwelling,<br />
nonmetropolitan older adults who<br />
attended congregate meal sites. The<br />
participants were at least 60 years old<br />
(as required <strong>for</strong> attendance at the<br />
congregate meals), with the exception<br />
of spouses under 60 years old who<br />
could attend meals when accompanying<br />
their older spouse.<br />
The treatment group was chosen from<br />
three Ohio counties; the control group,<br />
16 Family Economics <strong>and</strong> <strong>Nutrition</strong> Review
Box 1 – Basic definitions of the Stages of Change Construct of the Transtheoretical Model <strong>and</strong> operational<br />
definitions used in this study<br />
Basic definition<br />
Precontemplation<br />
No intention of changing behavior <strong>and</strong> does not see a need<br />
to change.<br />
Contemplation<br />
Acknowledges need to change behavior <strong>and</strong> begins to think<br />
seriously about doing so during the next 6 months or so.<br />
Preparation<br />
Plans to take action during the next month to change<br />
a behavior.<br />
Operational definition<br />
Participant consumed fewer than 3 to 4 servings of fruits (vegetables)<br />
each day <strong>and</strong> did not say he or she was seriously thinking about eating<br />
more servings of fruits (vegetables) during the next 6 months.<br />
Participant consumed fewer than 3 to 4 servings of fruits (vegetables)<br />
each day <strong>and</strong> said he or she was seriously thinking about eating more<br />
servings of fruits (vegetables) during the next 6 months.<br />
Participant consumed fewer than 3 to 4 servings of fruits (vegetables)<br />
each day <strong>and</strong> was planning to eat more servings of fruits (vegetables)<br />
during the next 30 days.<br />
Action<br />
Takes action to change behavior but action has lasted <strong>for</strong> Participant consumed 3 to 4 or more servings of fruits (vegetables)<br />
6 months or less. each day <strong>and</strong> has been consuming this amount of fruits (vegetables)<br />
<strong>for</strong> 6 months or less.<br />
Maintenance<br />
Has been practicing a changed behavior <strong>for</strong> more than Participant consumed 3 to 4 or more servings of fruits (vegetables)<br />
6 months. each day <strong>and</strong> has been consuming this amount of fruits (vegetables)<br />
<strong>for</strong> more than 6 months.<br />
Termination<br />
Has reached ultimate goal of behavior change, with no<br />
concern <strong>for</strong> relapse.<br />
Note: Stages of change definitions are by Prochaska, Norcross, <strong>and</strong> DiClemente (1994).<br />
from another Ohio county. 1 The Area<br />
Agency on Aging, county offices of<br />
Ohio State University Extension, <strong>and</strong><br />
coordinators of the congregate meal<br />
sites assisted with site selection, which<br />
needed to be more rural than urban or<br />
nonmetropolitan. 2 Fifty treatment <strong>and</strong><br />
51 control participants were selected. 3<br />
1 The data <strong>for</strong> this study were collected as<br />
part of the multi-State ef<strong>for</strong>t to test the<br />
lesson plans of the HELP.<br />
2 Ohio was selected to provide data from<br />
a nonurban population, as part of a<br />
coordinated ef<strong>for</strong>t to compare data<br />
among States.<br />
Survey Instruments<br />
Three instruments were used in this<br />
study: a demographics instrument, a<br />
questionnaire entitled Checkup on Your<br />
Good Eating Practices, <strong>and</strong> a Stages of<br />
Change instrument that consisted of<br />
3 The size of the sample was based on guidance<br />
from the HELP <strong>Elderly</strong> <strong>Nutrition</strong> Education<br />
Coordinating Group: Mary P. Clarke, PhD,<br />
RD, Kansas State University; Sherrie M.<br />
Mahoney, MS, Kansas Extension Service;<br />
Jacquelyn McClell<strong>and</strong>, PhD, RD, North<br />
Carolina State University; William D. Hart,<br />
PhD, RD, St. Louis University; Denise<br />
Brochetti, PhD, Virginia Polytechnic Institute<br />
<strong>and</strong> State University; Alma Montano Saddam,<br />
PhD, RD, The Ohio State University.<br />
two subscales—one <strong>for</strong> fruits <strong>and</strong><br />
another <strong>for</strong> vegetables. These<br />
instruments were developed by<br />
Extension nutrition professionals of<br />
the HELP <strong>Elderly</strong> <strong>Nutrition</strong> Education<br />
Coordinating Group that developed<br />
the HELP instructor’s manual.<br />
The demographics instrument collected<br />
in<strong>for</strong>mation on gender, age, race,<br />
number in household, educational<br />
level, income, how often meals were<br />
eaten with someone else, <strong>and</strong> how<br />
often meals <strong>and</strong> snacks were eaten.<br />
Checkup on Your Good Eating<br />
Practices consisted of seven questions<br />
related to eating fruits <strong>and</strong> vegetables,<br />
2003 Vol. 15 No. 1 17
<strong>and</strong> the Stages of Change instrument<br />
consisted of eight separate questions,<br />
four each <strong>for</strong> fruits <strong>and</strong> <strong>for</strong> vegetables<br />
(box 2). Questions on the Stages of<br />
Change instrument asked older adults<br />
the number of servings of fruits <strong>and</strong><br />
vegetables they were eating, how long<br />
they had been eating that number of<br />
servings, <strong>and</strong> whether they were<br />
seriously thinking of increasing this<br />
number either in the next 30 days or<br />
in the next 6 months. These questions<br />
were based on the criteria of the<br />
Transtheoretical Model Stages of<br />
Change construct (W.D. Hart, personal<br />
communication, October 19, 2001).<br />
Thus, the questions were based on a<br />
st<strong>and</strong>ardized length of time individuals<br />
had been working on, or intended to<br />
implement, a behavior change.<br />
The Extension nutrition specialists,<br />
dietetic nutrition professionals, <strong>and</strong><br />
county Extension agents (who also<br />
field tested the teaching materials)<br />
tested the instruments <strong>for</strong> content<br />
<strong>and</strong> face validity. The instruments<br />
were reviewed <strong>for</strong> content accuracy<br />
<strong>and</strong> suitability <strong>for</strong> the older adult<br />
target audience, after which appropriate<br />
adjustments were made.<br />
Extensive field testing addressed any<br />
issues related to reliability. Cronbach’s<br />
Alpha was used to test internal<br />
consistency of the instruments. The<br />
instrument Checkup on Your Good<br />
Eating Practices tested at an alpha of<br />
.77. The subscale <strong>for</strong> Stages of Change<br />
<strong>for</strong> fruit-related behaviors tested at<br />
an alpha of .53, <strong>and</strong> the subscale <strong>for</strong><br />
Stages of Change <strong>for</strong> vegetable-related<br />
behaviors tested at an alpha of .63.<br />
Research in applying the Stages of<br />
Change construct to measurement<br />
of behavior change of nutritional<br />
behaviors is relatively new. There<strong>for</strong>e,<br />
the alpha levels were considered<br />
acceptable (Nunnally, 1967).<br />
Box 2 – Major Survey Instruments 1<br />
Checkup on Your Good Eating Practices: Example questions<br />
(Answer choices: Almost never, Seldom, Often, Almost always, <strong>and</strong> Doesn’t apply.)<br />
What do you do?<br />
Include at least three food groups in my breakfast<br />
(e.g., milk, fruit, <strong>and</strong> grains such as bread <strong>and</strong> cereal)?<br />
Eat 3 or more servings of different vegetables daily?<br />
Eat at least 1 serving of vitamin A-rich foods daily<br />
(e.g., dark green, leafy [spinach, kale, broccoli] <strong>and</strong> deep yellow<br />
[sweet potatoes, cantaloupe, apricots])?<br />
Choose potatoes prepared in lower fat ways (not fried)?<br />
Eat 2 or more servings of different fruits daily?<br />
Choose at least 1 serving of vitamin C-rich foods daily<br />
(e.g., orange juice, grapefruit, broccoli, cabbage, tomatoes)?<br />
Include at least 1 serving from each of the five food groups<br />
(i.e., grains, fruits, vegetables, meat group, <strong>and</strong> milk products)?<br />
Stages of Change: Questions<br />
Separate questions were asked <strong>for</strong> fruit- <strong>and</strong> vegetable-eating behaviors.<br />
How many servings of fruits (vegetables) do you eat each day?<br />
0<br />
1 or 2<br />
3 or 4<br />
5 or more<br />
Don’t know<br />
About how long have you been eating this amount of fruits (vegetables)?<br />
Less than 1 month<br />
1 to 3 months<br />
4 to 6 months<br />
Longer than 6 months<br />
Don’t know<br />
Are you seriously thinking about eating more servings of fruits (vegetables)<br />
starting sometime in the next 6 months?<br />
Yes<br />
No<br />
I already eat enough<br />
Undecided<br />
Are you planning to eat more servings of fruits (vegetables) during the next 30 days?<br />
Yes<br />
No<br />
I already eat enough<br />
Undecided<br />
1 HELP evaluation instruments developed by Mary P. Clarke, PhD, RD; Jacquelyn McClell<strong>and</strong>,<br />
PhD, RD; William D. Hart, PhD, RD; <strong>and</strong> Alma Montano Saddam, PhD, RD of the <strong>Elderly</strong><br />
<strong>Nutrition</strong> Education Coordinating Group.<br />
18 Family Economics <strong>and</strong> <strong>Nutrition</strong> Review
Treatment <strong>and</strong> Analysis<br />
The HELP was developed as a joint<br />
project of the Cooperative Extension<br />
Services at Kansas State University,<br />
The Ohio State University, North<br />
Carolina State University, <strong>and</strong> St. Louis<br />
University. The program’s theme<br />
focused on having participants depend<br />
primarily on food <strong>for</strong> good nutritional<br />
health <strong>and</strong> encouraging them to eat a<br />
variety of nutritious foods even though<br />
the adults’ calorie needs may have<br />
declined. HELP lessons were designed<br />
to facilitate movement of nutrition<br />
behaviors along a continuum—from<br />
being unaware of eating habits <strong>and</strong><br />
health connections to applying skills<br />
to maintain healthful eating behaviors<br />
(Clarke & Mahoney, 1996).<br />
The HELP lessons specifically<br />
addressed nutritional needs of older<br />
adults. The connection between good<br />
health <strong>and</strong> healthful eating habits was<br />
emphasized. The fruit <strong>and</strong> vegetable<br />
lessons also presented practical ways<br />
<strong>for</strong> small households to purchase<br />
<strong>and</strong> store fruits <strong>and</strong> vegetables.<br />
Suggestions were shared <strong>for</strong> preparing<br />
fruits <strong>and</strong> vegetables that are easier<br />
to chew; lower in salt, sugar, <strong>and</strong> fat;<br />
<strong>and</strong> preserve other nutrients. The<br />
recipes, varying in texture, flavor,<br />
<strong>and</strong> temperature, were chosen<br />
because of their ability to appeal<br />
to the changing taste buds of many<br />
older adults.<br />
The treatment group was taught a<br />
series of four HELP nutrition lessons.<br />
The lessons <strong>for</strong> the first 2 weeks<br />
focused on vegetables, with a lesson<br />
on potatoes included, while the<br />
second 2 weeks focused on fruits.<br />
The objectives of the lessons related<br />
to the following: suggested number<br />
<strong>and</strong> sizes of servings; vegetables <strong>and</strong><br />
fruits as sources of various nutrients<br />
<strong>and</strong> few calories; links between eating<br />
vegetables <strong>and</strong> fruits <strong>and</strong> decreased<br />
risk <strong>for</strong> some diseases; cost-effective<br />
purchasing, storage, <strong>and</strong> preparation<br />
of vegetables <strong>and</strong> fruits; <strong>and</strong> vegetables<br />
<strong>and</strong> fruits with less fat, salt,<br />
<strong>and</strong> sugar.<br />
A dish featuring vegetables or fruits<br />
was brought to each class <strong>for</strong> participants<br />
to taste. Also, at each of the four<br />
sessions, the participants were given<br />
h<strong>and</strong>outs of the lessons, “challenges”<br />
<strong>for</strong> planning behavior changes, copies<br />
of recipes (including those tasted in<br />
class) in the HELP, <strong>and</strong> educational<br />
aids (e.g., refrigerator magnets of<br />
vegetables <strong>and</strong> fruits). For each group<br />
(one each from three counties), all<br />
lessons were taught in the same order<br />
by the researcher who used the same<br />
visuals, dishes to taste, <strong>and</strong> style of<br />
presentation. The control group did not<br />
receive the weekly lessons. However,<br />
after completing the post-test, they<br />
were offered a set of h<strong>and</strong>outs <strong>and</strong> the<br />
HELP recipes. Pre- <strong>and</strong> post-tests,<br />
respectively, were administered to the<br />
control group from September through<br />
December 1998, with these results<br />
being used to test <strong>and</strong> retest the study<br />
instruments. The instruments tested<br />
reliably below .05, with the exception of<br />
the question that dealt with how long<br />
the reported number of vegetables had<br />
been eaten. This question, however,<br />
was accepted as reliable because of the<br />
slightly lower number of participants<br />
answering the question.<br />
To consider this study quasiexperimental<br />
<strong>and</strong> a nonequivalent<br />
control-group design, we made ef<strong>for</strong>ts<br />
to select similar treatment <strong>and</strong> control<br />
groups. Analysis of the demographics<br />
conducted on treatment <strong>and</strong> control<br />
groups was only significantly different<br />
on one variable: how often they ate<br />
meals with someone else.<br />
For the questionnaire Checkup on Your<br />
Good Eating Practices, we summed a<br />
score <strong>for</strong> each treatment <strong>and</strong> control<br />
group participant by using answers<br />
from seven questions related to fruit<br />
<strong>and</strong> vegetable behavior (total possible<br />
For vegetable-eating behaviors,<br />
the treatment groups’ pre-test<br />
responses were mostly indicative<br />
of Precontemplation, followed<br />
closely by Maintenance,<br />
<strong>and</strong> then Preparation . . . .<br />
2003 Vol. 15 No. 1 19
score of 28, after eliminating “doesn’t<br />
apply”). A paired-sample t-test was<br />
used to compare the means of the pre<strong>and</strong><br />
post-test scores <strong>for</strong> each group.<br />
Post- <strong>and</strong> pre-test matched summed<br />
scores were also measured with a sign<br />
test. This test determined whether<br />
significant differences exist between<br />
positive <strong>and</strong> negative changes from<br />
the pre-test to the post-test. These<br />
changes, derived by subtracting pretest<br />
from post-test results, were placed<br />
into three categories: negative differences,<br />
positive differences, or ties<br />
(i.e., no change).<br />
For the Stages of Change instrument,<br />
we used sign tests to measure differences<br />
of matched cases from pre-test<br />
to post-test administration, excluding<br />
“don’t know” <strong>for</strong> the number of<br />
servings, how long this amount of<br />
fruits <strong>and</strong> vegetables had been eaten,<br />
<strong>and</strong> <strong>for</strong> computed stages of change <strong>for</strong><br />
fruit- <strong>and</strong> vegetable-eating behaviors<br />
<strong>for</strong> participants in both groups. An<br />
algorithm was used to calculate a<br />
separate stage of change <strong>for</strong> eating<br />
fruits <strong>and</strong> vegetables (box 1). Pre- <strong>and</strong><br />
post-test fruit <strong>and</strong> vegetable stages<br />
were calculated <strong>for</strong> the treatment <strong>and</strong><br />
control participants, except <strong>for</strong> those<br />
without sufficient data to categorize.<br />
Results<br />
Sample Characteristics<br />
Overall, the older adults in the<br />
treatment <strong>and</strong> control groups were<br />
similar. Seventy-six percent of the<br />
50 participants in the treatment group<br />
were women, <strong>and</strong> 92 percent were<br />
White. Sixty-seven percent of the<br />
51 participants in the control group<br />
were women, <strong>and</strong> 94 percent were<br />
White (data not shown).<br />
Table 1. Post-test/pre-test sign test <strong>for</strong> Checkup on Your Good Eating Practices<br />
regarding fruit- <strong>and</strong> vegetable-eating behaviors of elderly participants<br />
Treatment group 1 Control group 2<br />
Percent<br />
Negative differences 32 31<br />
Positive differences 59 43<br />
Ties 9 26<br />
1 n = 44.<br />
2 n = 49.<br />
Eating Practices<br />
Results from the questionnaire<br />
entitled Checkup on Your Good Eating<br />
Practices showed that, compared<br />
with the control group, a significant<br />
difference existed between the means<br />
<strong>for</strong> the treatment group from the pretest<br />
to the post-test. From the preto<br />
the post-test, mean scores by the<br />
treatment group increased from 20.86 to<br />
22.73 (p
Table 2. Pre-test <strong>and</strong> post-test computed Stages of Change <strong>for</strong> fruit- <strong>and</strong> vegetableeating<br />
behaviors of elderly participants<br />
Treatment group 1 Fruits Vegetables<br />
Stage of change Pre-test Post-test Pre-test Post-test<br />
Percent<br />
Maintenance 32 32 28 46<br />
Action 0 8 4 10<br />
Preparation 20 20 24 26<br />
Contemplation 4 8 0 0<br />
Precontemplation 24 28 30 12<br />
Cannot categorize 20 4 14 6<br />
Control group 2 Fruits Vegetables<br />
Stage of change Pre-test Post-test Pre-test Post-test<br />
Percent<br />
Maintenance 20 18 47 33<br />
Action 2 6 0 4<br />
Preparation 25 19 8 18<br />
Contemplation 2 4 2 2<br />
Precontemplation 43 49 33 33<br />
Cannot categorize 8 4 10 10<br />
Our findings indicate that the<br />
HELP nutrition lessons made a<br />
difference . . . in how some older<br />
adults in the treatment group<br />
thought about changes, planned<br />
<strong>for</strong> changes, or made changes in<br />
their fruit- <strong>and</strong> vegetable-eating<br />
behaviors.<br />
1 n = 50.<br />
2 n = 51.<br />
others planned to take action during<br />
the next month to change their<br />
vegetable-eating behavior. At the posttest,<br />
members of the treatment group<br />
most frequently characterized their<br />
vegetable-eating behavior as being<br />
related to Maintenance, followed by<br />
Preparation, <strong>and</strong> Precontemplation<br />
(46, 26, <strong>and</strong> 12 percent, respectively), a<br />
different pattern than was the case at<br />
the pre-test phase. The control group’s<br />
responses at pre-test were mostly in<br />
two categories: Maintenance (47<br />
percent) <strong>and</strong> Precontemplation (33<br />
percent). The post-test category <strong>for</strong><br />
Precontemplation remained at 33<br />
percent, but the Preparation category<br />
was 18 percent, a change from the pretest<br />
(8 percent). Also, control group<br />
participants categorizing their behavior<br />
as Maintenance dropped to 33 percent<br />
at the post-test phase.<br />
Results from the sign tests revealed no<br />
significant difference between pre-test<br />
<strong>and</strong> post-test results <strong>for</strong> neither the<br />
treatment group nor the control group<br />
<strong>for</strong> stage of change related to fruiteating<br />
behaviors nor <strong>for</strong> the control<br />
group <strong>for</strong> stage of change related to<br />
vegetable-eating behaviors (table 3).<br />
However, a significant positive change<br />
<strong>for</strong> stage of change <strong>for</strong> the treatment<br />
group’s vegetable-eating behaviors<br />
existed. This positive change shows<br />
movement from a lower stage of change<br />
category to a higher category from the<br />
pre-test to the post-test.<br />
Limitations of the Study<br />
Findings were limited to the older<br />
adults in this study. Participants were<br />
not r<strong>and</strong>omly selected because they<br />
were attendees of pre-arranged class<br />
sites, <strong>and</strong> some self-selection occurred.<br />
2003 Vol. 15 No. 1 21
Measurable behavior change may have<br />
been limited because of the short span<br />
of weeks in which treatment took place.<br />
Other considerations were (1) the<br />
environments of the congregate meal<br />
sites that varied in lighting, seating<br />
arrangements, distractions, <strong>and</strong><br />
participant attentiveness <strong>and</strong> (2) the<br />
nutrition education on fruits <strong>and</strong><br />
vegetables that the control group may<br />
have received from other sources prior<br />
to this study.<br />
Conclusions<br />
This study specifically examined the<br />
influence of nutrition education on the<br />
eating behaviors of older adults who<br />
resided in nonmetropolitan or semirural<br />
geographic areas <strong>and</strong> who were<br />
also participants of congregate meal<br />
programs. Based on recent trends, the<br />
nonmetropolitan or semi-rural older<br />
adult population is an important group<br />
to focus on because of factors such as<br />
the out-migration of younger persons<br />
in these areas <strong>and</strong> the sometimessegmented<br />
nutrition <strong>and</strong> health care<br />
services (ADA, 2000; Rogers, 1999).<br />
Further study is recommended of not<br />
only this geographic audience but also<br />
of a comparison of this audience with<br />
urban older adults who participate in<br />
congregate meal programs.<br />
Our findings indicate that the HELP<br />
nutrition lessons made a difference,<br />
measured by real <strong>and</strong> statistical<br />
significance, in how some older adults<br />
in the treatment group thought about<br />
changes, planned <strong>for</strong> changes, or made<br />
changes in their fruit- <strong>and</strong> vegetableeating<br />
behaviors. Additionally, there is<br />
merit to the use <strong>and</strong> further study of<br />
the questions on the Stages of Change<br />
instrument <strong>for</strong> fruit- <strong>and</strong> vegetableeating<br />
behaviors; that is, <strong>for</strong> the<br />
categorization of older adults’<br />
behaviors into the Precontemplation,<br />
Contemplation, Preparation, Action,<br />
or Maintenance stages.<br />
Table 3. Post-test/pre-test sign test <strong>for</strong> Stages of Change computed <strong>for</strong> fruit- <strong>and</strong><br />
vegetable-eating behaviors of elderly participants<br />
Treatment 1 Control 2<br />
Fruits<br />
Percent<br />
Negative differences 24 16<br />
Positive differences 22 20<br />
Ties 54 64<br />
Treatment 1 Control 2<br />
Vegetables<br />
Percent<br />
Negative differences 8 17<br />
Positive differences 41* 5<br />
Ties 51 78<br />
1 n = 37 <strong>for</strong> fruit-eating behaviors, <strong>and</strong> n = 37 <strong>for</strong> vegetable-eating behaviors.<br />
2 n = 45 <strong>for</strong> fruit-eating behaviors, <strong>and</strong> n = 41 <strong>for</strong> vegetable-eating behaviors.<br />
*Differences in behavior changes from the pre-test to the post-test are significant, at p
References<br />
American Dietetic Association. (2000). Position of the American Dietetic<br />
Association: <strong>Nutrition</strong>, aging, <strong>and</strong> the continuum of care. Journal of the American<br />
Dietetic Association, 100(5), 580-595.<br />
American Dietetic Association. (1996). Position of the American Dietetic<br />
Association: <strong>Nutrition</strong> education <strong>for</strong> the public. Journal of the American Dietetic<br />
Association, 96(11), 1183-1187.<br />
Basiotis, P.P., Carlson, A., Gerrior, S.A., Juan, W.Y., & Lino, M. (2002). The Healthy<br />
Eating Index: 1999-2000. U.S. Department of Agriculture, <strong>Center</strong> <strong>for</strong> <strong>Nutrition</strong><br />
<strong>Policy</strong> <strong>and</strong> <strong>Promotion</strong>. CNPP-12.<br />
Clarke, M.P., & Mahoney, S.M. (1996). A Healthy Eating <strong>for</strong> Life Program <strong>for</strong><br />
Mature Adults. Kansas State University Agricultural Experiment Station <strong>and</strong><br />
Cooperative Extension Service.<br />
Contento, I., Balch, G.I., Bronner, Y.L., Lytle, L.A., Maloney, S.K., Olson, C.M.,<br />
et al. (1995). <strong>Nutrition</strong> education <strong>for</strong> older adults. Journal of <strong>Nutrition</strong> Education,<br />
27, 339-346.<br />
Gerrior, S.A. (1999). Dietary changes in older Americans from 1977 to 1996:<br />
Implications <strong>for</strong> dietary quality. Family Economics <strong>and</strong> <strong>Nutrition</strong> Review, 12(2),<br />
3-14.<br />
Hetzel, L. & Smith, A. (2001). The 65 Years <strong>and</strong> Over Population: 2000. Brief<br />
C2KBR/01-10. U.S. Census Bureau.<br />
Kristal, A.R., Glanz, K., Curry, S.J., & Patterson, R.E. (1999). How can stages<br />
of change be best used in dietary intervention? Journal of the American Dietetic<br />
Association, 99(6), 679-684.<br />
La<strong>for</strong>ge, R.G., Greene, G.W., & Prochaska, J.O. (1994). Psychological factors<br />
influencing low fruit <strong>and</strong> vegetable consumption. Journal of Behavioral Science,<br />
17(4), 361-374.<br />
Nigg, C.R., Burbank, P.M., Padula, C., Dufresne, R., Rossi, J.S., Velicir, W.F.,<br />
et al. (1999). Stages of change across ten health risk behaviors <strong>for</strong> older adults.<br />
The Gerontologist, 39(4), 473-482.<br />
Nunnally, J.C. (1967). Psychometric Theory. New York, NY: McGraw-Hill.<br />
Price, C.A. (2001). The Impact of Demographic Changes on Society. Presentation<br />
at Northwest District Family <strong>Nutrition</strong> Program In-Service on Aging. Columbus,<br />
Ohio.<br />
Prochaska, J.O., Norcross, J.C., & DiClemete, C.C. (1994). Changing <strong>for</strong> Good.<br />
New York, NY: William Morrow <strong>and</strong> Company, Inc./Avon Books.<br />
2003 Vol. 15 No. 1 23
Rogers, C.C. (1999). Changes in the Older Population <strong>and</strong> Implications <strong>for</strong> Rural<br />
Areas. Food <strong>and</strong> Rural Economics Division, Economic Research Service, U.S.<br />
Department of Agriculture. Rural Development Research Report Number 90.<br />
Tate, M.J., & Patrick, S. (2000). Healthy People 2010 targets healthy diet <strong>and</strong><br />
healthy weight as critical goals. Journal of the American Dietetic Association,<br />
100(3), 300.<br />
U.S. Department of Health <strong>and</strong> Human Services. (2000). Healthy People 2010.<br />
Washington, DC.<br />
U.S. Census Bureau. (2000a). Projections of the Total Resident Population by<br />
5-Year Age Groups, <strong>and</strong> Sex with Special Age Categories: Middle Series, 2006<br />
to 2010. Retrieved July 29, 2003, from www.census.gov/population/projections/<br />
nation/summary/np-t3-c.txt.<br />
U.S. Census Bureau. (2000b). Projections of the Total Resident Population by<br />
5-Year Age Groups, <strong>and</strong> Sex with Special Age Categories: Middle Series, 2025<br />
to 2045. Retrieved July 29, 2003, from www.census.gov/population/projections/<br />
nation/summary/np-t3-f.txt.<br />
Wellman, N.S., Weddle, D.O., Kranz, S., & Brain, C.T. (1997). Elder insecurities:<br />
Poverty, hunger, malnutrition. Journal of the American Dietetic Association,<br />
97(10 Suppl.), S120-S122.<br />
24 Family Economics <strong>and</strong> <strong>Nutrition</strong> Review
Using a Concurrent Events<br />
Approach to Underst<strong>and</strong><br />
Social Support <strong>and</strong> Food<br />
Insecurity Among Elders<br />
Edward A. Frongillo, PhD<br />
Cornell University<br />
Pascale Valois, MSc<br />
Fonds de la Recherche en Santé du Québec<br />
Wendy S. Wolfe, PhD<br />
Cornell University<br />
This study tested a concurrent events approach to underst<strong>and</strong> better the<br />
relationships between social support <strong>and</strong> food insecurity of a sample (n=9)<br />
of low-income elders that had participated in an earlier study (n=53) in Upstate<br />
New York. This approach involved the use of time-intensive telephone interviews<br />
over a span of 4 months. Results indicated that the concurrent events approach<br />
provided a fuller underst<strong>and</strong>ing of food insecurity, social support, other events,<br />
<strong>and</strong> experiences among these elderly participants. The researchers found that<br />
the telephone interviews helped with obtaining a better underst<strong>and</strong>ing of the<br />
elders’ “monthly cycle” of food insecurity <strong>and</strong> the importance of food exchange<br />
as a source of social <strong>and</strong> food support among elders, a finding that had not<br />
been captured in the two in-depth retrospective interviews of the earlier study.<br />
M<br />
any elders experience hunger<br />
<strong>and</strong> food insecurity because of<br />
low incomes, limited mobility,<br />
or poor health (Cook & Brown, 1992;<br />
Cohen, Burt, & Schulte, 1993; Lee &<br />
Frongillo, 2001a; Nord et al., 2002).<br />
Food insecurity among elders contributes<br />
to poor diet <strong>and</strong> malnutrition,<br />
which exacerbates disease, increases<br />
disability, decreases resistance to<br />
infection, <strong>and</strong> extends hospital stays<br />
(Administration on Aging, 1994;<br />
Torres-Gil, 1996; Lee & Frongillo,<br />
2001b). Food insecurity is defined as<br />
“the inability to acquire or consume an<br />
adequate quality or sufficient quantity<br />
of food in socially acceptable ways, or<br />
the uncertainty that one will be able to<br />
do so” (Radimer, Olson, Greene,<br />
Campbell, & Habicht, 1992).<br />
Food insecurity among the elderly also<br />
includes the inability to obtain <strong>and</strong> use<br />
food in the household (e.g., to gain<br />
access to, prepare, <strong>and</strong> eat available<br />
food) because of functional impairments,<br />
health problems, or lack of<br />
social support (Lee & Frongillo, 2001a).<br />
Social support affects whether an<br />
elderly person with financial or physical<br />
limitations or both experiences food<br />
insecurity. This support can result<br />
from in<strong>for</strong>mal social networks, such<br />
as family <strong>and</strong> friends, or more <strong>for</strong>mal<br />
programs, such as food programs<br />
(Wolfe, Olson, Kendall, & Frongillo,<br />
1996). Functional impairments, health<br />
problems, <strong>and</strong> lack of social support<br />
have significant relations with food<br />
insecurity (Burt, 1993; Frongillo,<br />
Rauschenbach, Roe, & Williamson,<br />
1992; New York State Department<br />
of Health <strong>and</strong> Office <strong>for</strong> the Aging,<br />
1996; Qu<strong>and</strong>t & Rao, 1999; Roe, 1990;<br />
Wolfe et al., 1996). Social support<br />
<strong>and</strong> food insecurity interact in complex<br />
ways. At least partly due to methodological<br />
limitations, these interactions<br />
are neither well understood nor easy<br />
to study (Lee & Frongillo, 2001c).<br />
For example, equivocal evidence has<br />
revealed the buffering effect of social<br />
2003 Vol. 15 No. 1 25
support among elders (Newsom &<br />
Schulz, 1996; Lee & Frongillo, 2001a).<br />
For some elders, family or friends—<br />
even if needed routinely—cannot<br />
always help as planned, resulting<br />
sometimes in hunger or food insecurity.<br />
Although it is important to underst<strong>and</strong><br />
these types of situations, it is difficult<br />
to obtain adequate details about these<br />
experiences from one or even two indepth<br />
interviews (Wolfe et al., 1996).<br />
When experiences such as these occur,<br />
participants tend to talk in general terms<br />
about what they did <strong>and</strong> suggest that<br />
they are okay. However, they often do<br />
not mention exactly what they consumed<br />
or mention the anxiety they<br />
experienced. In addition, they tend to<br />
talk more about one or two problematic<br />
times that resulted in greater anxiety or<br />
more severe food insecurity rather than<br />
including other less severe examples of<br />
lack of support or of the variability or<br />
precariousness of their support. Thus,<br />
it has been difficult to obtain the details<br />
that are needed to underst<strong>and</strong> more<br />
fully the relation of social support to<br />
food insecurity in this population.<br />
Many low-income elders also experience<br />
a monthly financial cycle that<br />
results in a food insecurity cycle—<br />
having less food insecurity <strong>and</strong> anxiety<br />
at the beginning of the month when<br />
they receive their monthly checks <strong>and</strong><br />
experiencing greater food insecurity<br />
<strong>and</strong> anxiety at the end of the month<br />
when their money has been spent<br />
(Wolfe et al., 1996). Some low-income<br />
elders are so accustomed to this<br />
monthly cycle that they do not talk<br />
about these difficulties (even when<br />
asked) unless they happen to be interviewed<br />
during that time. It is unclear,<br />
however, how various management<br />
strategies relate to this monthly cycle.<br />
Thus, the ways that both <strong>for</strong>mal<br />
<strong>and</strong> in<strong>for</strong>mal social support serve to<br />
improve the food security of elders are<br />
not well understood, partly because of<br />
methodological limitations in research<br />
designs. In general, underst<strong>and</strong>ing the<br />
biological, psychological, <strong>and</strong> social<br />
dynamics of events, needs, practices,<br />
<strong>and</strong> help-seeking <strong>and</strong> other behaviors<br />
of elders is important to assessing <strong>and</strong><br />
interpreting their experiences. It is, as<br />
well, important to underst<strong>and</strong>ing how<br />
food assistance programs <strong>and</strong> other<br />
<strong>for</strong>mal actions might contribute to<br />
improving food security. For example,<br />
1 of the 10 recommendations about<br />
health outcomes developed by an<br />
Institute of Medicine (1996) committee<br />
was to determine “the impact on health<br />
outcomes when older individuals make<br />
transitions between types of care,<br />
treatment settings, <strong>and</strong> health plans.”<br />
Acquiring such underst<strong>and</strong>ing requires<br />
new research approaches that allow<br />
<strong>for</strong> describing <strong>and</strong> sorting out complex,<br />
dynamic patterns of each elder’s<br />
experience across an appropriate timeframe<br />
(Lee & Frongillo, 2001c). For<br />
similar reasons, <strong>and</strong> in the absence<br />
of r<strong>and</strong>omized intervention trials, new<br />
research approaches are also needed<br />
<strong>for</strong> assessing the effect of programs,<br />
such as home-delivered meals <strong>and</strong><br />
home-care services.<br />
Time-intensive, event-focused<br />
approaches may be particularly<br />
valuable <strong>for</strong> underst<strong>and</strong>ing complex,<br />
dynamic patterns (Tuma & Hannan,<br />
1984; Blossfeld & Rohwer, 1995),<br />
because they are used to study<br />
transitions across a set of discrete<br />
states, including the length of time<br />
intervals between entry into <strong>and</strong> exit<br />
from specific states (e.g., well vs. ill).<br />
The transitions are studied in relation<br />
to other discrete events <strong>and</strong> changes in<br />
continual states. These event-focused<br />
approaches hold advantages <strong>for</strong> causal<br />
inference over both cross-sectional<br />
<strong>and</strong> traditional longitudinal approaches<br />
because of the detailed knowledge of<br />
the occurrence <strong>and</strong> timing of events.<br />
These approaches are particularly<br />
suited <strong>for</strong> research with elders because<br />
of the highly dynamic nature of factors<br />
that affect their nutrition <strong>and</strong> health<br />
(Lee & Frongillo, 2001c).<br />
This study tested an innovative,<br />
events-focused, qualitative research<br />
approach to underst<strong>and</strong> better the<br />
relationships between social support<br />
<strong>and</strong> food insecurity of low-income<br />
elders. This new concurrent events<br />
approach involved studying a small<br />
group of food-insecure elders intensively<br />
<strong>for</strong> a prolonged period to help<br />
underst<strong>and</strong> the intricacies of the variability<br />
<strong>and</strong> uncertainty of social support<br />
as well as other events experienced<br />
in relation to food insecurity. The<br />
approach is referred to as “concurrent”<br />
because the researchers monitored<br />
study participants frequently over time<br />
(Gordis, 2000).<br />
Methods<br />
We previously conducted a study of<br />
53 food-insecure low-income elderly<br />
men <strong>and</strong> women who lived in their own<br />
homes in three large cities in Upstate<br />
New York. In this earlier study, we<br />
completed two in-depth interviews with<br />
each elder. The purpose of the earlier<br />
study was to underst<strong>and</strong> better the<br />
experience of elderly food insecurity<br />
<strong>and</strong> thus contribute to previous<br />
research of food insecurity among<br />
elders (Wolfe et al., 1996, 1998). For<br />
the study reported here, we selected<br />
a subset of nine of these elders.<br />
When we conducted the earlier study,<br />
six of the nine elders in the study<br />
reported here were food insecure <strong>and</strong><br />
three, relying heavily on social support<br />
strategies <strong>for</strong> food, were marginally<br />
food secure. The sample consisted<br />
of seven Caucasian women, one<br />
Caucasian man, <strong>and</strong> one African-<br />
American man whose ages ranged<br />
from 59 to 76 (an average of 68 years).<br />
Four had impaired mobility (two in<br />
wheelchairs) <strong>and</strong> one had occasional<br />
dizzy spells. Six lived alone; one with<br />
26 Family Economics <strong>and</strong> <strong>Nutrition</strong> Review
her daughter <strong>and</strong> husb<strong>and</strong>, who died<br />
during the study; one, with her elderly<br />
boyfriend; <strong>and</strong> one, with her teenaged<br />
gr<strong>and</strong>son. Two received both food<br />
stamps <strong>and</strong> home-delivered meals.<br />
Three of the elders received homedelivered<br />
meals only—one, not because<br />
she needed them, but because she<br />
helped deliver these meals. Of the<br />
nine elders, only two participated in<br />
congregate meals <strong>and</strong> received food<br />
from food pantries; two did not<br />
participate in any food programs.<br />
Monthly incomes of the elderly<br />
participants ranged from $400 to $900,<br />
averaging $738 each month. Six lived<br />
in subsidized housing; all had been<br />
employed most of their lives; two had<br />
not completed high school, five were<br />
high school graduates, <strong>and</strong> two<br />
attended some college.<br />
Each participant was interviewed<br />
weekly by telephone <strong>for</strong> 4 months<br />
(December 2000 to March 2001) by<br />
one of the authors who per<strong>for</strong>med all<br />
of the interviews by using an interview<br />
guide <strong>and</strong> a tape recorder. Participants<br />
were asked about the past week: their<br />
food situation (i.e., how they obtain<br />
their groceries, whether they had any<br />
help with meals, whether they attended<br />
any food programs, or whether they<br />
had problems accessing food), their use<br />
of social networks, frequency of family<br />
contacts, changes in their health or<br />
social support, <strong>and</strong> events of the past<br />
week. Rapport was established quickly<br />
during the telephone conversations,<br />
because the same interviewer had<br />
interviewed each participant twice in<br />
his or her home during the previous<br />
year. The weekly contact helped to<br />
increase rapport further, which is<br />
important <strong>for</strong> gathering this type of<br />
sensitive in<strong>for</strong>mation. In<strong>for</strong>med consent<br />
(to participate <strong>and</strong> to tape record the<br />
telephone interviews) was obtained<br />
in the first interview.<br />
Analysis was ongoing: Each week prior<br />
to the next telephone interview, the<br />
interviewer listened to, took detailed<br />
notes from, <strong>and</strong> analyzed the interview<br />
of the previous week. From this<br />
analysis, the interviewer developed<br />
follow-up questions to probe more fully<br />
<strong>for</strong> emerging issues. Following the final<br />
interviews, these records were further<br />
analyzed, summarized, reviewed, <strong>and</strong><br />
discussed by all three authors.<br />
Results <strong>and</strong> Discussion<br />
Usefulness of the Concurrent<br />
Events Approach <strong>for</strong><br />
Underst<strong>and</strong>ing Social Support<br />
<strong>and</strong> Food Insecurity<br />
As expected, the time-intensive telephone<br />
interviews produced a fuller<br />
underst<strong>and</strong>ing of some issues that<br />
arose in our earlier research with this<br />
population. One finding was the<br />
surprising extent <strong>and</strong> importance of<br />
food exchange as a source of social<br />
<strong>and</strong> food support among elders, a<br />
finding that had not been captured in<br />
the in-depth interviews. For example,<br />
one woman took home-delivered meals<br />
to others in her building <strong>and</strong> sold Avon<br />
products, both of which placed her in<br />
situations where people gave her food<br />
they had received from the homedelivered<br />
meal program, food pantries,<br />
or restaurants. These food gifts, plus<br />
the free home-delivered meals she<br />
received <strong>for</strong> working <strong>for</strong> them, were<br />
important to her food security.<br />
Another woman, with very low mobility,<br />
lived alone <strong>and</strong> relied on her family <strong>for</strong><br />
support. Because this was not always<br />
reliable, this participant became a<br />
member of a food network in her<br />
apartment building <strong>for</strong> seniors. This<br />
network included elaborate food-trade<br />
<strong>and</strong> food-access strategies. For<br />
example, in addition to receiving halfpint<br />
cartons of milk from a neighbor’s<br />
home-delivered meals, this study<br />
participant received food from a woman<br />
who did not use all the food that her<br />
The weekly telephone calls<br />
provided good rapport between<br />
the elderly food-insecure<br />
participants <strong>and</strong> the interviewer<br />
<strong>and</strong> a fuller underst<strong>and</strong>ing of food<br />
insecurity, social support, other<br />
events, <strong>and</strong> experiences among<br />
these elderly participants.<br />
2003 Vol. 15 No. 1 27
children brought to her. In return, our<br />
participant made homemade soup <strong>and</strong><br />
brought portions to others.<br />
Another person received food from the<br />
“bread fairy,” an elderly neighbor who<br />
went regularly to the food pantry to get<br />
<strong>and</strong> then distribute loaves of day-old<br />
bread to various needy residents. A<br />
fourth elderly woman was diabetic <strong>and</strong><br />
had recently begun sharing the food<br />
she prepared with others. The foods<br />
included items such as diabetic<br />
desserts that she shared with a diabetic<br />
neighbor whom she also took food<br />
shopping. Extensive food-sharing<br />
among elders has been elucidated by<br />
others (e.g., Qu<strong>and</strong>t, Arcury, Bell,<br />
McDonald, & Vitolins, 2001).<br />
The study was intended to produce a<br />
better underst<strong>and</strong>ing of the variability<br />
<strong>and</strong> uncertainty of social support in<br />
relation to food insecurity, since the<br />
findings from the earlier in-depth interviews<br />
suggested that social support<br />
was important <strong>for</strong> food security but<br />
often was not consistent or reliable in<br />
many cases. What we found, however,<br />
was that at least in this group, the<br />
social support of most participants did<br />
not change over the 4 months of the<br />
study (e.g., elders maintained routine<br />
patterns regarding who took them<br />
shopping).<br />
In fact, having non-changing situations<br />
was important to these elders. The only<br />
exception was the elderly participant<br />
who reported both in the in-depth <strong>and</strong><br />
telephone interviews that her daughter<br />
took her shopping once a month.<br />
However, this supposed routine help<br />
did not occur during the first 2 months<br />
of our weekly telephone interviews. As<br />
a result, this participant had to borrow<br />
food from her neighbors <strong>and</strong> had to<br />
order canned food from a drug store<br />
that delivered—although she preferred<br />
fresh food. This situation also made<br />
her home-delivered meals more vital<br />
than ever. Another participant who<br />
experienced a major life event during<br />
the study—the loss of her husb<strong>and</strong>—<br />
did not lose her social support or food<br />
insecurity as might have been expected<br />
because she also lived with her<br />
daughter.<br />
Results such as these suggest that a<br />
longer follow-up period may be needed<br />
to underst<strong>and</strong> the effects of variability<br />
in social support <strong>for</strong> most elders.<br />
Perhaps, when changes in social<br />
support occur <strong>for</strong> most elders, the<br />
changes are over a longer period,<br />
such as those associated with climatic<br />
seasons.<br />
Usefulness of the Concurrent<br />
Events Approach <strong>for</strong><br />
Underst<strong>and</strong>ing Other Events <strong>and</strong><br />
Experiences Related to Food<br />
Insecurity<br />
The weekly telephone interviews were<br />
valuable <strong>for</strong> gaining a fuller underst<strong>and</strong>ing<br />
of the daily lives of these<br />
food-insecure elders. By talking with<br />
the participants weekly, the researchers<br />
found that the interviews also helped<br />
with obtaining a better underst<strong>and</strong>ing<br />
of the elders’ “monthly cycle” of<br />
food insecurity <strong>and</strong> also allowed<br />
good rapport <strong>and</strong> confidence to be<br />
established. The telephone interviews<br />
also allowed the researcher to ask<br />
more direct questions <strong>and</strong> the elderly<br />
participants to share additional<br />
personal in<strong>for</strong>mation. Some examples<br />
follow.<br />
(1) One elderly woman was not<br />
classified as food insecure based<br />
on the earlier study, but the weekly<br />
contacts helped to elucidate how much<br />
she actually relied on food stamps—<br />
particularly at the end of the month.<br />
Her food money began to be depleted<br />
during the third week of the month;<br />
during the end of the month, her food<br />
situation actually changed. For example,<br />
she had to substitute foods like french<br />
toast <strong>for</strong> dinner rather than eating meals<br />
that included meat. Because of the<br />
rapport established between the<br />
interviewer <strong>and</strong> another participant,<br />
the elderly woman making these<br />
substitutions was com<strong>for</strong>table enough<br />
to describe one of her food-access<br />
strategies: smuggling food from the<br />
congregate lunches to be eaten <strong>for</strong> her<br />
dinner. Although this was not allowed<br />
(because of concerns <strong>for</strong> food safety),<br />
she regularly brought containers <strong>for</strong><br />
extra food.<br />
(2) The weekly interviews helped<br />
researchers underst<strong>and</strong> the support<br />
system of one African-American man<br />
who had very little family support, but<br />
he seemed to have a number of friends<br />
that took him shopping. Later in the<br />
study, however, he revealed that he<br />
often paid these friends <strong>for</strong> rides <strong>and</strong><br />
there<strong>for</strong>e was reluctant to call them as<br />
much as he needed.<br />
(3) The concurrent events approach<br />
was intended to allow us to underst<strong>and</strong><br />
<strong>and</strong> describe what <strong>and</strong> how events<br />
occurred on a week-to-week basis, as<br />
well as how these events affect elders’<br />
food insecurity. We previously found<br />
that major sicknesses <strong>and</strong> other<br />
stressful events affected the food<br />
situation of the elders <strong>and</strong>, thus, their<br />
food insecurity (Wolfe et al., 1996).<br />
Although few participants endured<br />
very stressful events during the<br />
4 months of study, Christmas turned<br />
out to be one such event. The weekly<br />
interviews provided an underst<strong>and</strong>ing<br />
of the importance of Christmas <strong>and</strong> the<br />
stress it may cause because of the need<br />
to have extra money to buy special<br />
food, presents <strong>for</strong> gr<strong>and</strong>children, <strong>and</strong><br />
other items. Christmas, there<strong>for</strong>e,<br />
sometimes resulted in greater food<br />
insecurity. For example, one woman<br />
who wanted to bake <strong>for</strong> her family <strong>and</strong><br />
friends bought extra staple foods <strong>and</strong><br />
saved some money during the fall so<br />
that she could purchase extra baking<br />
supplies. Un<strong>for</strong>tunately, she was <strong>for</strong>ced<br />
to use this stocked food when her<br />
28 Family Economics <strong>and</strong> <strong>Nutrition</strong> Review
money started to become depleted<br />
because of extra Christmas expenses.<br />
The interviews also highlighted the<br />
importance of charitable food baskets<br />
at Christmas <strong>for</strong> some participants.<br />
(4) Another event occurred when the<br />
Caucasian male participant—on the<br />
recommendation of others in his<br />
building—decided to try food shopping<br />
rather than eating out at a snack bar<br />
each evening. By following this<br />
recommendation, he spent more money<br />
than he would have spent otherwise.<br />
The result: Be<strong>for</strong>e the end of the<br />
month, this elderly participant needed<br />
to borrow money <strong>and</strong> use credit to eat.<br />
Perhaps this was because he was not<br />
used to shopping <strong>for</strong> groceries.<br />
(5) One elderly woman’s health, social<br />
support, <strong>and</strong> food situation changed<br />
dramatically during the 4-month study.<br />
This participant was on a diet described<br />
as lowfat, low-cholesterol, low-sugar,<br />
low-sodium, <strong>and</strong> limited-greens. (The<br />
latter was due to a history of blood<br />
clots <strong>and</strong> medication <strong>for</strong> it. Based on<br />
her interpretations, she believed she<br />
was not allowed to eat anything<br />
“green.”) The weekly telephone<br />
contact produced a greater underst<strong>and</strong>ing<br />
of how complicated it was<br />
<strong>for</strong> this participant to follow her diet—<br />
especially given her low income. In<br />
addition, during the time that the<br />
telephone interviews were conducted,<br />
this elderly participant experienced<br />
several major life changes. After having<br />
heart surgery, she moved in with her<br />
elderly boyfriend so that he could<br />
take care of her. At the same time, she<br />
continued to pay <strong>for</strong> her own house,<br />
which caused financial difficulties.<br />
(She did not feel secure enough with<br />
her new situation to sell her house.)<br />
Living with her boyfriend who had<br />
no diet limitation made it even more<br />
difficult <strong>for</strong> her to follow her fairly strict<br />
diet. Our previous work showed that<br />
the ability to eat the “right foods <strong>for</strong><br />
health” was an important aspect of food<br />
security among the elderly, <strong>and</strong> her new<br />
social situation seemed to make this<br />
woman even more food insecure. Then,<br />
just be<strong>for</strong>e our study ended, she was<br />
diagnosed with breast cancer. This new<br />
life-altering event—plus the negative<br />
effect of living with someone with very<br />
different food habits—caused her to<br />
conclude that her diet really did not<br />
matter anyway. As a result, she<br />
stopped following her diet. It’s likely<br />
that her food situation changed further<br />
after her cancer surgery, which was<br />
scheduled after the end of our study.<br />
Thus, using the new concurrent events<br />
approach, compared with the two indepth<br />
interviews alone, produced a<br />
fuller underst<strong>and</strong>ing of changes as<br />
they occurred. This fuller underst<strong>and</strong>ing<br />
probably would not have<br />
been achieved with retrospective indepth<br />
interviews or event histories<br />
(Tuma & Hannan, 1984; Blossfeld &<br />
Rohwer, 1995). During the 4-month<br />
timeframe, however, there were not<br />
many substantial changes. The<br />
approach was relatively easy <strong>and</strong><br />
inexpensive to implement, requiring<br />
only about 10 minutes to interview<br />
each participant each week.<br />
Conclusions<br />
The weekly telephone calls provided<br />
good rapport between the elderly foodinsecure<br />
participants <strong>and</strong> the interviewer<br />
<strong>and</strong> provided a fuller underst<strong>and</strong>ing<br />
of food insecurity, social<br />
support, other events, <strong>and</strong> experiences<br />
among these elderly participants. These<br />
calls added to what was achieved in<br />
the two prior in-depth interviews. The<br />
concurrent events approach was not<br />
efficient <strong>for</strong> underst<strong>and</strong>ing the variability<br />
of social support or the effect<br />
of stressful events on food insecurity,<br />
however, because these events did not<br />
occur very often. The approach might<br />
be more efficient (<strong>for</strong> the same amount<br />
of interviewer time input) by first<br />
The concurrent events approach<br />
is likely to be useful <strong>for</strong><br />
investigation following an event<br />
or transition such as participating<br />
in the home-delivered meals<br />
program, moving into senior<br />
housing, loss of a spouse, moves<br />
by family members, or a change<br />
in health condition.<br />
2003 Vol. 15 No. 1 29
interviewing a new person in his or<br />
her home once or twice, followed by<br />
weekly telephone calls <strong>for</strong> a month,<br />
<strong>and</strong> then monthly telephone calls <strong>for</strong><br />
at least several months or up to a year.<br />
When an important event or change<br />
is identified, weekly telephone calls<br />
can be made <strong>for</strong> several weeks to<br />
investigate that event or change.<br />
The concurrent events approach is<br />
likely to be useful <strong>for</strong> investigation<br />
following an event or a transition such<br />
as participating in the home-delivered<br />
meals program, moving into senior<br />
housing, losing a spouse, moves by<br />
family members, or a change in health<br />
condition. The concurrent events<br />
approach could identify the early<br />
effects of programs <strong>and</strong> provide muchneeded<br />
evidence about whether <strong>and</strong><br />
how being a program participant (e.g.,<br />
Meals on Wheels recipient) is helpful.<br />
For example, one could investigate<br />
whether elders receiving homedelivered<br />
meals eat the meals, establish<br />
a relationship with the delivery person,<br />
or have changes in their mental state.<br />
Participants could be recruited by<br />
using either a <strong>for</strong>mal or an in<strong>for</strong>mal<br />
surveillance system (such as through<br />
contacts in housing offices or through<br />
home-delivered meals programs) that<br />
provides prompt notification when<br />
someone is making a transition. Soon<br />
after this notification, the participant<br />
could be interviewed, as frequently as<br />
once a week or once a month, to obtain<br />
a more detailed <strong>and</strong> accurate assessment<br />
of any changes in food status<br />
<strong>and</strong> social support.<br />
telephone. Variants of this approach<br />
might involve brief in-person follow-up<br />
interviews or incorporation of some<br />
quantitative questions.<br />
Acknowledgments<br />
We thank Elizabeth Conrey, Amy<br />
Terhune, <strong>and</strong> the anonymous reviewers<br />
<strong>for</strong> helpful comments on an earlier draft.<br />
This research was primarily funded by<br />
a grant from the Cornell Gerontology<br />
Research Institute, an Edward R.<br />
Roybal <strong>Center</strong> supported by the<br />
National Institute on Aging (1 P50<br />
AG11711-01). This research was also<br />
supported in part by a grant (99-34324-<br />
8120) from the Cooperative State<br />
Research, Education, <strong>and</strong> Extension<br />
Service (CSREES), United States<br />
Department of Agriculture (<strong>US</strong>DA);<br />
<strong>and</strong> by Cornell University Agricultural<br />
Experiment Station Federal <strong>for</strong>mula<br />
funds, Project No. NYC-399425<br />
received from CSREES, <strong>US</strong>DA.<br />
This study has demonstrated the<br />
usefulness of an innovative, feasible,<br />
<strong>and</strong> inexpensive concurrent events<br />
research approach <strong>for</strong> investigating<br />
nutrition issues in the elderly. The<br />
two key elements of the approach are<br />
the initial establishment of rapport by<br />
using one or two in-depth, in-person,<br />
qualitative interviews <strong>and</strong> then frequent<br />
follow-up qualitative interviews via<br />
30 Family Economics <strong>and</strong> <strong>Nutrition</strong> Review
References<br />
Administration on Aging, U.S. Department of Health <strong>and</strong> Human Services, National<br />
Aging In<strong>for</strong>mation <strong>Center</strong>. (1994). Food <strong>and</strong> <strong>Nutrition</strong> <strong>for</strong> Life: Malnutrition <strong>and</strong><br />
Older Americans. Report No. NAIC-12 (December). Washington, DC.<br />
.<br />
Blossfeld, H., & Rohwer, G. (1995). Techniques of Event History Modeling: New<br />
Approaches to Causal Analysis. Manhwa, NJ: Lawrence Erlbaum Association.<br />
Burt, M.R. (1993). Hunger Among the <strong>Elderly</strong>: Local <strong>and</strong> National Comparison.<br />
Washington, DC: The Urban Institute.<br />
Cohen, B.E., Burt, M.R., & Schulte, M.M. (1993). Hunger <strong>and</strong> Food Insecurity<br />
Among the <strong>Elderly</strong>. Washington, DC: The Urban Institute.<br />
Cook, J.T., & Brown, J.L. (1992). Estimating the Number of Hungry Americans.<br />
Tufts University, Med<strong>for</strong>d, MA: <strong>Center</strong> <strong>for</strong> Hunger, Poverty <strong>and</strong> <strong>Nutrition</strong> <strong>Policy</strong><br />
Working Paper No. HE01-090292.<br />
Frongillo, E.A., Rauschenbach, B.S., Roe, D.A., & Williamson, D.F. (1992).<br />
Characteristics related to elderly persons’ not eating <strong>for</strong> 1 or more days:<br />
Implications <strong>for</strong> meal programs. American Journal of Public Health, 82(4),<br />
600-602.<br />
Gordis, L. (2000). Epidemiology (2nd ed.). Philadelphia: W.B. Saunders Company.<br />
Institute of Medicine. (1996). Health Outcomes <strong>for</strong> Older People: Questions <strong>for</strong> the<br />
Coming Decade. Committee to Develop an Agenda <strong>for</strong> Health Outcomes Research<br />
<strong>for</strong> <strong>Elderly</strong> People. Division of Health Care Services. Washington, DC: National<br />
Academy Press.<br />
Lee, J.S., & Frongillo, E.A. (2001a). Factors associated with food insecurity among<br />
<strong>US</strong> elderly: Importance of functional impairments. Journal of Gerontology: Social<br />
Sciences, 56B, S94-S99.<br />
Lee, J.S., & Frongillo, E.A. (2001b). <strong>Nutrition</strong>al <strong>and</strong> health consequences are<br />
associated with food insecurity among U.S. elderly persons. Journal of <strong>Nutrition</strong>,<br />
131, 1503-1509.<br />
Lee, J.S., & Frongillo, E.A. (2001c). Underst<strong>and</strong>ing needs is important <strong>for</strong> assessing<br />
the impact of food assistance program participation on nutritional <strong>and</strong> health<br />
status in U.S. elderly persons. Journal of <strong>Nutrition</strong>, 131, 765-773.<br />
New York State Department of Health <strong>and</strong> Office <strong>for</strong> the Aging. (1996). <strong>Nutrition</strong><br />
Survey of the <strong>Elderly</strong> in New York State. Albany, NY.<br />
Newsom, J.T., & Schulz, R. (1996). Social support as a mediator in the relation<br />
between functional status <strong>and</strong> quality of life in older adults. Psychology <strong>and</strong><br />
Aging, 11, 34-44.<br />
2003 Vol. 15 No. 1 31
Nord, M., Kabbani, N., Tiehen, L., Andrews, M., Bickel, G., & Carlson, S. (2002).<br />
Household Food Security in the United States, 2000: Measuring Food Security<br />
in the United States. Washington, DC: U.S. Department of Agriculture, Economic<br />
Research Service.<br />
Qu<strong>and</strong>t, S.A., Arcury, T.A., Bell, R.A., McDonald, J., & Vitolins, M.Z. (2001). The<br />
social <strong>and</strong> nutritional meaning of food sharing among older rural adults. Journal of<br />
Aging Studies, 15, 145-162.<br />
Qu<strong>and</strong>t, S.A., & Rao, P. (1999). Hunger <strong>and</strong> food security among older adults in a<br />
rural community. Human Organizations, 58(1), 28-35.<br />
Radimer, K.L., Olson, C.M., Greene, J.C. , Campbell, C.C., & Habicht, J.P. (1992).<br />
Underst<strong>and</strong>ing hunger <strong>and</strong> developing indicators to assess it in women <strong>and</strong><br />
children. Journal of <strong>Nutrition</strong> Education, 24, 36S-45S.<br />
Roe, D.A. (1990). In-home nutritional assessment of inner-city elderly. Journal of<br />
<strong>Nutrition</strong>, 120(Suppl. 11), 1538-1543.<br />
Torres-Gil, F.M. (1996). Malnutrition <strong>and</strong> hunger in the elderly. <strong>Nutrition</strong> Reviews,<br />
54(1), S7-S8.<br />
Tuma, N., & Hannan, M. (1984). Social Dynamics: Models <strong>and</strong> Methods.<br />
San Diego, CA: Academic Press.<br />
Wolfe, W.S., Olson, C.M., Kendall, A., & Frongillo, E.A. (1996). Underst<strong>and</strong>ing<br />
food insecurity in the elderly: A conceptual framework. Journal of <strong>Nutrition</strong><br />
Education, 28, 92-100.<br />
Wolfe, W.S., Olson, C.M., Kendall, A., & Frongillo, E.A. (1998). Hunger <strong>and</strong> food<br />
insecurity in the elderly: Its nature <strong>and</strong> measurement. Journal of Aging <strong>and</strong><br />
Health, 10, 327-350.<br />
32 Family Economics <strong>and</strong> <strong>Nutrition</strong> Review
Measuring the Food Security of<br />
<strong>Elderly</strong> Persons<br />
Mark Nord, PhD<br />
Economic Research Service<br />
U.S. Department of Agriculture<br />
This study assessed the appropriateness of the U.S. Food Security Scale <strong>for</strong><br />
measuring the food security of elderly persons <strong>and</strong>, in particular, whether<br />
measured prevalence rates of food insecurity <strong>and</strong> hunger among the elderly<br />
were likely to be biased, relative to those of the nonelderly. The findings, based<br />
on analysis of 3 years of data from the Current Population Survey Food Security<br />
Supplement, consistently indicated that the Food Security Scale fairly represented<br />
the food security status of elderly persons, compared with the food security status<br />
of nonelderly persons. Statistical analysis of the multiple-indicator scale found no<br />
indication that the scale underrepresented the prevalence of food insecurity or<br />
hunger among the elderly because they interpreted or responded to questions<br />
in the Food Security Scale differently than did the nonelderly. Responses to<br />
questions other than those in the scale indicated that some elderly did face<br />
food-access problems other than insufficient resources to buy food—most notably<br />
problems getting to a food store. However, these problems were no more likely<br />
<strong>for</strong> the elderly than <strong>for</strong> the nonelderly to be so serious that desired eating patterns<br />
were disrupted or food intake was insufficient. A small proportion of elderly<br />
households classified as food-secure obtained food assistance from Federal <strong>and</strong><br />
community programs, suggesting that some of these households were less than<br />
fully food-secure <strong>and</strong> that some may, indeed, be food-insecure. However, foodsecure<br />
elderly-only households were less likely than the food-secure nonelderly<br />
households to rely on food assistance programs that are accessible to both.<br />
E<br />
lderly persons are more foodsecure<br />
than are nonelderly<br />
persons, according to recent<br />
nationally representative food security<br />
surveys sponsored by the U.S. Department<br />
of Agriculture (<strong>US</strong>DA) (Nord,<br />
2002; Nord et al., 2002; Guthrie &<br />
Lin, 2002; Andrews, Nord, Bickel,<br />
& Carlson, 2000; Bickel, Carlson, &<br />
Nord, 1999). In these surveys, food<br />
security—defined as access at all times<br />
to enough food <strong>for</strong> an active, healthy<br />
life <strong>for</strong> all household members—is<br />
measured by a series of questions<br />
about behaviors <strong>and</strong> experiences<br />
known to characterize households that<br />
are having difficulty meeting their food<br />
needs (Fitchen, 1981; Fitchen, 1988;<br />
Radimer, Olson, & Campbell, 1990;<br />
Radimer, Olson, Green, Campbell &<br />
Habicht, 1992; Wehler, Scott, &<br />
Anderson, 1992). The U.S. Food<br />
Security Scale, calculated from responses<br />
to these questions, measures<br />
the food security of the household<br />
<strong>and</strong> classifies each as food-secure,<br />
food-insecure without hunger, or foodinsecure<br />
with hunger (Bickel, Nord,<br />
Price, Hamilton, & Cook, 2000; Hamilton<br />
et al., 1997a; 1997b). Concerns have<br />
been raised about whether this<br />
measurement method, based on selfreported<br />
food-access conditions <strong>and</strong><br />
behaviors, fairly represents the food<br />
security of elderly persons, compared<br />
with that of non-elderly persons. Food<br />
insecurity is known to be associated<br />
with poor nutrition <strong>and</strong> health<br />
2003 Vol. 15 No. 1 33
outcomes <strong>for</strong> elderly people, <strong>and</strong> age<br />
aggravates the negative effects of poor<br />
nutrition on the elderly; so accurate,<br />
reliable measurements of the food<br />
security of the elderly are important<br />
both <strong>for</strong> monitoring <strong>and</strong> research<br />
purposes (Sahyoun & Basiotis, 2000;<br />
Guthrie & Lin, 2002). In this study, I<br />
assess the appropriateness of the U.S.<br />
Food Security Scale <strong>for</strong> measuring the<br />
food security of elderly persons <strong>and</strong>,<br />
in particular, whether prevalence rates<br />
of food insecurity <strong>and</strong> hunger are<br />
comparable between households with<br />
<strong>and</strong> without elderly persons present.<br />
Statistics based on the September 2000<br />
Food Security Survey Module—the<br />
most recent food security data<br />
available—indicate that 94 percent<br />
of households with an elderly person<br />
(i.e., age 65 or over) present were<br />
food-secure throughout the year (Nord,<br />
2002). Thus, the remaining 6 percent<br />
of households with elderly persons<br />
were food-insecure, meaning that at<br />
some time during the previous year,<br />
these households were either uncertain<br />
of having or unable to acquire enough<br />
food to meet basic needs of all their<br />
members because they had insufficient<br />
money or other resources <strong>for</strong> food.<br />
One in four of the food-insecure elderly<br />
households (1.5 percent of all elderly<br />
households) were food-insecure to the<br />
extent that one or more household<br />
members were hungry at least some<br />
time during the year because they could<br />
not af<strong>for</strong>d enough food. The other<br />
three-fourths of food-insecure elderly<br />
households obtained enough food to<br />
avoid hunger by using a variety of<br />
coping strategies such as eating less<br />
varied diets, participating in Federal<br />
food assistance programs, or getting<br />
emergency food from community food<br />
pantries. These rates of food insecurity<br />
<strong>and</strong> hunger were about half those of<br />
households with no elderly members,<br />
<strong>and</strong> this relationship was observed at<br />
all income levels, including households<br />
with incomes below the Federal poverty<br />
line. The extent of food insecurity <strong>and</strong><br />
hunger among elderly households<br />
remained almost unchanged from that<br />
of 1995 (when the first nationally<br />
representative food security survey<br />
was conducted) through 2000. The<br />
corresponding prevalence rates <strong>for</strong> the<br />
nonelderly, on the other h<strong>and</strong>, declined<br />
substantially during this period of<br />
economic growth.<br />
There are two areas of greatest concern<br />
regarding application of the st<strong>and</strong>ard<br />
methods <strong>for</strong> measuring food security<br />
to the elderly. The first is whether the<br />
questions in the Food Security Scale<br />
are understood similarly by the elderly<br />
<strong>and</strong> the nonelderly <strong>and</strong> whether they<br />
experience <strong>and</strong> respond to food insecurity<br />
in similar ways. The st<strong>and</strong>ard<br />
method depends on self-reported<br />
conditions <strong>and</strong> behaviors related to<br />
food access <strong>and</strong>, as such, may be<br />
subject to differences in how people<br />
underst<strong>and</strong> <strong>and</strong> interpret the questions<br />
<strong>and</strong> may be subject to biases in the<br />
direction of perceived social desirability.<br />
For example, ethnographic<br />
findings have suggested that the least<br />
severe question in the Food Security<br />
Scale, which asks whether respondents<br />
worried that their food would run out<br />
be<strong>for</strong>e they received money to buy<br />
more, might be less sensitive <strong>for</strong> elders.<br />
Some elderly persons, at least, report<br />
that they just do not worry about such<br />
things.<br />
The second area of concern is whether<br />
the Food Security Scale is appropriately<br />
sensitive to obstacles that particularly<br />
affect elders’ ability to get adequate,<br />
nutritious meals. The Food Security<br />
Scale measures, specifically, food<br />
insecurity <strong>and</strong> hunger that are caused by<br />
insufficient money or other resources<br />
<strong>for</strong> food. Each question in the scale<br />
specifies this resource constraint as a<br />
reason <strong>for</strong> the behavior or condition—<br />
<strong>for</strong> example: “In the last 12 months,<br />
did you ever cut the size of your meals<br />
or skip meals because there wasn’t<br />
enough money <strong>for</strong> food?” Factors<br />
other than economic resource<br />
constraints (e.g., health problems,<br />
mobility limitations, <strong>and</strong> lack of<br />
transportation) may be obstacles to<br />
elders’ ability to obtain adequate<br />
nutritious meals, <strong>and</strong> food-access<br />
problems caused by such factors might<br />
not be registered by the Food Security<br />
Scale (Guthrie & Lin, 2002).<br />
Data <strong>and</strong> Methods<br />
Data to assess these concerns about<br />
measuring the food security of elderly<br />
persons were drawn from the August<br />
1998, April 1999, <strong>and</strong> September 2000<br />
Current Population Survey Food<br />
Security Supplements (CPS-FSS).<br />
The CPS-FSS is an annual, nationally<br />
representative survey of about 42,000<br />
households, which is conducted as a<br />
supplement to the monthly CPS labor<br />
<strong>for</strong>ce survey. In each household, the<br />
person most knowledgeable about the<br />
food purchased <strong>and</strong> eaten in the home<br />
responds to the questions in the Food<br />
Security Supplement. Annual statistics<br />
on household food security in the<br />
United States are published by the<br />
<strong>US</strong>DA <strong>and</strong> are based on data from<br />
the CPS-FSS.<br />
Separate analysis files were constructed<br />
<strong>for</strong> households in which all persons<br />
were age 65 or older (i.e., elderly-only<br />
households) <strong>and</strong> households in which<br />
no person was age 65 or older (i.e.,<br />
nonelderly households). Households<br />
with mixed elderly <strong>and</strong> nonelderly—<br />
about 7 percent of all households—<br />
were excluded from the analysis.<br />
34 Family Economics <strong>and</strong> <strong>Nutrition</strong> Review
Scaling Analysis: Do the <strong>Elderly</strong><br />
<strong>and</strong> Nonelderly Experience<br />
<strong>and</strong> Respond Similarly to<br />
Food Insecurity?<br />
To assess whether the questions in the<br />
Food Security Scale are understood<br />
similarly by the elderly <strong>and</strong> the nonelderly<br />
<strong>and</strong> whether they experience<br />
<strong>and</strong> respond similarly to food insecurity,<br />
I compared response patterns<br />
of elderly-only <strong>and</strong> nonelderly households.<br />
To do so, I used statistical<br />
methods based on the Rasch measurement<br />
model—the methods originally<br />
used to develop the Food Security<br />
Scale. This analysis exploits one of<br />
the strengths of multiple-indicator<br />
measures such as the Food Security<br />
Scale: associations among the indicators<br />
comprising the scale provide<br />
evidence of its validity <strong>and</strong> reliability.<br />
Furthermore, if the patterns of association<br />
among the items in a multipleindicator<br />
measure are similar in two<br />
populations, this suggests that the items<br />
relate similarly in the two populations<br />
to the underlying phenomenon that<br />
accounts <strong>for</strong> their interrelationships;<br />
that is, the items measure the same<br />
phenomenon in the two populations.<br />
These methods of scale assessment<br />
are more widely used in psychometric<br />
research <strong>and</strong> educational testing than<br />
in nutrition <strong>and</strong> economic research, so<br />
I present first a brief summary of the<br />
Rasch model <strong>and</strong> the scale assessment<br />
statistics based on it. More detailed<br />
in<strong>for</strong>mation on the Rasch model <strong>and</strong><br />
associated statistics is available<br />
elsewhere. 1<br />
1<br />
See Wright (1977; 1983), Wright & Masters<br />
(1982), Baker (1992), Hambleton, Swaminathan,<br />
& Rogers (1991), <strong>and</strong> Fischer & Molenaar<br />
(1995), <strong>and</strong> the Website of the MESA<br />
psychometric laboratory at the University<br />
of Chicago at www.rasch.org. In<strong>for</strong>mation<br />
about applications of Rasch methods to the<br />
development <strong>and</strong> assessment of food security<br />
scales is available in Hamilton et al. (1997a;<br />
1997b), Ohls, Radbill, & Schirm (2001), Bickel<br />
et al. (2000), <strong>and</strong> Nord (2000).<br />
An essential characteristic of the Food<br />
Security Scale is that the items comprising<br />
it vary across a wide range of<br />
severity of food insecurity. The precise<br />
severity level of each item (the “item<br />
calibration” or “item score”) is estimated<br />
empirically from the overall<br />
pattern of response to the scale items by<br />
the interviewed households. However,<br />
the range of severity of the conditions<br />
identified by the items is also intuitively<br />
evident from inspection of the items.<br />
For example, not eating <strong>for</strong> a whole<br />
day is a more severe manifestation of<br />
food insecurity than is cutting the size<br />
of meals or skipping meals. These<br />
differences in severity are observed<br />
in two ways in the response patterns<br />
of surveyed households.<br />
First, more severe items are less<br />
frequently affirmed than less severe<br />
items. Second, households that affirm<br />
a specific item are likely to have also<br />
affirmed all items that are less severe,<br />
while households that deny the item<br />
are likely to also deny all items that<br />
are more severe. These typical response<br />
patterns are not universal, but they are<br />
predominant, <strong>and</strong> among households<br />
that do deviate from the typical<br />
patterns, the extent of deviation<br />
tends to be slight.<br />
The Rasch model <strong>for</strong>malizes the<br />
concept of severity-ordering of items<br />
<strong>and</strong> provides st<strong>and</strong>ard statistical<br />
methods to estimate the severity level<br />
measured by each item <strong>and</strong> the severity<br />
level experienced by each household.<br />
The model also assesses the extent to<br />
which the response patterns observed<br />
in a data set are consistent with the<br />
severity-order concept. The food<br />
security of households can be thought<br />
of as a continuum, which is represented<br />
by a graduated scale, from fully secure<br />
to severely insecure with hunger<br />
evident. The Rasch model links the<br />
severity of items to this same scale as<br />
follows: Imagine a household becoming<br />
progressively more food-insecure. At<br />
very low levels of food insecurity, the<br />
household denies all items in the Food<br />
Security Scale. As insecurity increases,<br />
the household reaches a level where it<br />
begins to report, “We worried whether<br />
our food would run out be<strong>for</strong>e we got<br />
money to buy more” (the least severe<br />
item in the scale), while continuing to<br />
deny the more severe items. That low<br />
level of insecurity is the severity score<br />
of the “worried” item.<br />
At some more severe level, the household<br />
begins to report, “The food we<br />
bought didn’t last, <strong>and</strong> we didn’t have<br />
money to get more,” while continuing<br />
to affirm the “worried” item but<br />
denying all of the more severe items.<br />
This higher severity level is the severity<br />
score of the item “Food we bought<br />
didn’t last.” Of course, not all households<br />
experience or report food security<br />
in exactly the same manner, so these<br />
relationships are only probablistically<br />
true. Technically, half of all households<br />
with severity scores equal to that of an<br />
item will affirm that item. That is, the<br />
average household at this level of<br />
severity is right on the edge, equally<br />
likely to say “yes” or “no” to the item.<br />
As a household becomes more foodinsecure,<br />
it is progressively more likely<br />
it will affirm each item. The Rasch<br />
model is based on a specific mathematical<br />
function that relates the probability<br />
of a household affirming an item<br />
to the difference between the severitylevel<br />
of the household <strong>and</strong> the severity<br />
score of the item (box 1). Average item<br />
discrimination <strong>and</strong> item-fit statistics,<br />
used in this study to compare response<br />
patterns of elderly <strong>and</strong> nonelderly<br />
households with questions in the Food<br />
Security Scale, are based on the<br />
consistency with which households’<br />
responses con<strong>for</strong>m to this expected<br />
pattern. These statistics are based on<br />
the proportions of expected <strong>and</strong><br />
unexpected responses. Expected<br />
responses are denials of an item by<br />
households with severity scores below<br />
2003 Vol. 15 No. 1 35
Box 1. The Rasch Model: Ordering severity level of items <strong>and</strong><br />
severity level experienced by households<br />
The single-parameter Rasch model, which is used to create the Food Security<br />
Scale, assumes that the log of the odds of a household affirming an item is<br />
proportional to the difference between the “true” severity level of the<br />
household <strong>and</strong> the “true” severity level of the item. That is, the odds that a<br />
household at severity-level h will affirm an item at severity-level i is expressed<br />
as: P h,i /Q h,i = e (h-i) where P is the probability that the household will affirm the<br />
item, Q is the probability the household will deny the item (that is, 1-p), <strong>and</strong><br />
e is the base of the natural logarithms.<br />
Item infit is an in<strong>for</strong>mation-weighted fit statistic that compares the observed<br />
responses of all households with the responses expected under the<br />
assumptions of the Rasch model. It is calculated as follows:<br />
INFIT 1 = SUM [(X i,h – P i,h ) 2 ] / SUM [P i,h - P i,h 2 ]<br />
where:<br />
X i,h is the observed response of household h to item i<br />
(1 if response is yes, 0 if response is no);<br />
P i,h is the probability of an affirmative response by household h to<br />
item i under Rasch assumptions, given the item calibration <strong>and</strong><br />
the estimated level of severity of food insecurity in the household.<br />
The expected value of each item’s infit statistic is 1.0 if the data con<strong>for</strong>m<br />
to Rasch model assumptions. Values above 1.0 indicate that the item<br />
discriminates less sharply than the average of all items in the scale.<br />
Item outfit is an outlier-sensitive fit statistic that compares the observed<br />
responses of all households with the responses expected under the<br />
assumptions of the Rasch model. It is calculated as the average across<br />
households of the squared error divided by the expected squared error.<br />
OUTFIT i = SUM [(X i,h – P i,h ) 2 / P i,h - P i,h 2 ] / N<br />
where:<br />
X i,h is the observed response of household h to item i<br />
(1 if response is yes, 0 if response is no);<br />
P i,h is the probability of an affirmative response by household h to<br />
item i under Rasch assumptions, given the item calibration <strong>and</strong><br />
the estimated level of severity of food insecurity in the household;<br />
N is the number of households.<br />
The expected value of each item’s outfit statistic is 1.0 if the data con<strong>for</strong>m to<br />
Rasch model assumptions. Values above 1.0 indicate a higher than expected<br />
proportion of “erratic” responses⎯affirmative responses to a severe item by<br />
households that affirmed few other items or denials of a low-severity item by<br />
households that affirmed many other items.<br />
For further in<strong>for</strong>mation on these item-fit statistics, see Wright <strong>and</strong> Masters<br />
(1982, pp. 94ff.), Bond <strong>and</strong> Fox (2001, pp. 176ff.).<br />
36 Family Economics <strong>and</strong> <strong>Nutrition</strong> Review
that of the item <strong>and</strong> affirmations of<br />
the item by households with severity<br />
scores higher than that of the item.<br />
Unexpected responses are the opposite.<br />
An item with high discrimination has<br />
fewer unexpected responses than does<br />
an item with low discrimination. Thus,<br />
if the same set of items is found to<br />
have higher average discrimination in<br />
one population than in another, this<br />
indicates that the responses were more<br />
consistently ordered, <strong>and</strong> the underlying<br />
phenomenon was measured more<br />
precisely, in the first population.<br />
The Rasch model assumes that all<br />
items discriminate equally <strong>and</strong> that<br />
items discriminate equally <strong>for</strong> all subpopulations.<br />
Comparing average item<br />
discrimination between scales fitted<br />
separately <strong>for</strong> the elderly <strong>and</strong> the<br />
nonelderly tests empirically whether<br />
the latter assumption is true. Lower<br />
item discrimination in a subpopulation<br />
would mean either that the behaviors<br />
<strong>and</strong> conditions indicated by the items<br />
were less consistently ordered in that<br />
subpopulation or that respondents’<br />
answers to the questions were less<br />
consistently related to the behaviors<br />
<strong>and</strong> conditions in question. The latter<br />
condition would occur if the questions<br />
were not well understood by the<br />
respondents or were not understood<br />
to mean the same thing by all<br />
respondents.<br />
Item-fit statistics compare the extent of<br />
unexpected responses <strong>for</strong> each specific<br />
item to those of the average of all items<br />
in the scale. The two most commonly<br />
reported item-fit statistics “infit” <strong>and</strong><br />
“outfit” are used in this study to assess<br />
whether the elderly responded less<br />
consistently or more erratically than<br />
did the nonelderly to specific items in<br />
the scale (box 1). For both statistics, a<br />
value of 1 indicates that the extent of<br />
unexpected responses to the item is at<br />
the average <strong>for</strong> all items in the scale.<br />
Values above 1 indicate a disproportionate<br />
share of unexpected responses<br />
<strong>and</strong>, there<strong>for</strong>e, lower discrimination<br />
of the item; values below 1 indicate<br />
a smaller proportion of unexpected<br />
responses <strong>and</strong> higher discrimination<br />
of the item. Infit is “in<strong>for</strong>mationweighted”<br />
so that it is sensitive to<br />
responses by households with severity<br />
scores in the range near the severity<br />
level of the particular item. Outfit is<br />
sensitive to unexpected responses from<br />
households with severities much higher<br />
or lower than that of the item—that<br />
is, to highly improbable or erratic<br />
responses (outliers). Outfit is calculated<br />
as the sum of squared errors divided<br />
by the sum of squared errors expected<br />
under model assumptions.<br />
I conducted separate scaling analyses<br />
<strong>for</strong> elderly-only <strong>and</strong> nonelderly households<br />
<strong>and</strong> compared the results.<br />
Households that affirm none of the<br />
scale questions, typically nearly 80<br />
percent of all U.S. households <strong>and</strong><br />
a larger proportion of elderly-only<br />
households, <strong>and</strong> those few households<br />
that affirm all questions to which<br />
they respond do not provide any<br />
in<strong>for</strong>mation about the relative severity<br />
of the items in the scale. Households<br />
with these “extreme” responses must be<br />
excluded from scaling analyses. After<br />
these necessary exclusions, the sample<br />
of households available <strong>for</strong> the scaling<br />
analysis from the combined CPS-FSS<br />
<strong>for</strong> the 3 years consisted of 2,036<br />
elderly-only households <strong>and</strong> 17,033<br />
nonelderly households, sufficiently<br />
large samples to provide stable, reliable<br />
scale statistics.<br />
I recoded responses to the food security<br />
questions into dichotomous scale items<br />
by following st<strong>and</strong>ard editing procedures,<br />
as described in the Guide to<br />
Measuring Household Food Security,<br />
Revised 2000 (Bickel et al., 2000).<br />
Child-referenced items were excluded<br />
from both scales in order to maximize<br />
comparability, because the elderlyonly<br />
households were not asked these<br />
questions. Data <strong>for</strong> the two age groups<br />
were fitted separately to the Rasch<br />
model by using joint-maximumlikelihood<br />
methods implemented by<br />
ERSRasch (a set of SAS programs<br />
developed by ERS <strong>for</strong> Rasch analysis<br />
of food security data).<br />
The elderly-only <strong>and</strong> nonelderly scales<br />
were st<strong>and</strong>ardized to the same metric<br />
(that of the st<strong>and</strong>ard 18-item household<br />
scale described in Bickel et al., 2000)<br />
so that discrimination parameters <strong>and</strong><br />
item severities could be meaningfully<br />
compared between the two scales. The<br />
scales were st<strong>and</strong>ardized by applying<br />
a linear trans<strong>for</strong>mation to each scale’s<br />
item scores so that means of the item<br />
scores could be equated to mean<br />
absolute deviation of item scores<br />
in the two scales. This particular<br />
st<strong>and</strong>ardization is justified by the<br />
assumption that the scale characteristic<br />
most likely to be the same between the<br />
two populations is the average severity<br />
of the items.<br />
The additive constant in the linear<br />
trans<strong>for</strong>mation simply provides<br />
identification. (Rasch scales are unique<br />
only up to an additive trans<strong>for</strong>mation,<br />
so an identifying constant is supplied<br />
arbitrarily in the process of model<br />
estimation.) The multiplicative constant<br />
in the linear trans<strong>for</strong>mation adjusts <strong>for</strong><br />
any differences in the average item<br />
discrimination in the two subpopulations.<br />
The Rasch model assumes that<br />
item discrimination is the same in all<br />
subpopulations. However, we also<br />
assume that any given item represents<br />
the same level of food insecurity <strong>for</strong><br />
respondents in both subpopulations.<br />
Comparing the discrimination<br />
parameters required to obtain the<br />
same item dispersion in scales fitted<br />
separately to elderly <strong>and</strong> nonelderly<br />
household response data allows one<br />
to test whether these two assumptions<br />
are compatible.<br />
Alternatively, average item discrimination<br />
in the two subpopulations can be<br />
2003 Vol. 15 No. 1 37
compared by estimating item scores<br />
separately <strong>for</strong> each group with discrimination<br />
coefficients set at 1 <strong>and</strong><br />
then comparing the mean absolute<br />
deviations of item scores in the two<br />
scales. The two methods are exactly<br />
equivalent. The multiplier required to<br />
equate mean absolute deviation is the<br />
inverse of the discrimination coefficient<br />
that would have to be specified to<br />
achieve the same mean absolute<br />
deviation of item scores. Adjusting<br />
the item scores has the advantage of<br />
facilitating comparison of relative<br />
item severities between the two<br />
subpopulations.<br />
I compared average item discrimination,<br />
item-fit statistics, <strong>and</strong> relative item<br />
severity scores of the elderly-only scale<br />
with those of the nonelderly scale.<br />
Average item discrimination <strong>and</strong> itemfit<br />
statistics provide in<strong>for</strong>mation about<br />
the consistency of ordering of responses<br />
to the questions in the scale. If elderlyonly<br />
responses were less consistently<br />
ordered or more erratic, then the<br />
average item discrimination <strong>for</strong> their<br />
scale would be lower, <strong>and</strong> item-fit<br />
statistics of affected items would be<br />
higher, than the corresponding statistics<br />
<strong>for</strong> the nonelderly scale.<br />
If the two age groups understood a<br />
question differently, or if the behavior<br />
or condition in question related<br />
differently to food insecurity <strong>for</strong> the<br />
two groups, then the severity score of<br />
that item relative to those of other items<br />
would differ between the scales <strong>for</strong> the<br />
two groups. On the other h<strong>and</strong>, similar<br />
relative severity scores across all items<br />
<strong>for</strong> the two age groups would suggest<br />
that the items are understood similarly<br />
by the two groups <strong>and</strong> that the two<br />
groups experience <strong>and</strong> respond to food<br />
insecurity similarly.<br />
Other Indications of Food<br />
Problems Faced by the <strong>Elderly</strong><br />
CPS-FSS asked respondents several<br />
questions additional to those that<br />
constitute the Food Security Scale.<br />
These other questions identified various<br />
food problems that may have been<br />
encountered. One of these questions,<br />
the so-called food sufficiency question,<br />
has been used <strong>for</strong> many years in food<br />
consumption <strong>and</strong> health surveys. It<br />
asks: “Which of these statements best<br />
describes the food eaten in your<br />
household—(1) enough of the kinds<br />
of food we want to eat, (2) enough but<br />
not always the kinds of food we want<br />
to eat, (3) sometimes not enough to eat,<br />
or (4) often not enough to eat?” This<br />
question does not explicitly specify a<br />
resource constraint as the cause of the<br />
food condition <strong>and</strong> may, there<strong>for</strong>e, be<br />
sensitive to food-access problems that<br />
are not caused directly by insufficient<br />
money to buy food.<br />
I compared the proportions of elderlyonly<br />
<strong>and</strong> nonelderly households<br />
reporting in each category of this<br />
question to assess whether food<br />
problems other than insufficient<br />
resources to buy food were more<br />
prevalent <strong>for</strong> elderly than nonelderly<br />
households. I also cross-classified<br />
households in each age group by their<br />
food sufficiency status <strong>and</strong> food<br />
security status to assess whether the<br />
Food Security Scale was less sensitive<br />
to food problems revealed by the food<br />
sufficiency question <strong>for</strong> elderly than <strong>for</strong><br />
nonelderly households.<br />
Households responding “We had<br />
enough but not always the kinds of food<br />
we want to eat” were then asked the<br />
following: “Here are some reasons why<br />
people don’t always have the kinds of<br />
food they want. For each one, please<br />
tell me if that is a reason why YOU<br />
don’t always have the kinds of food you<br />
want to eat.” Reasons presented <strong>for</strong> a<br />
yes or no response were<br />
• Not enough money <strong>for</strong> food<br />
• Kinds of food we want not available<br />
• Not enough time <strong>for</strong> shopping or<br />
cooking<br />
• Too hard to get to the store<br />
• On a special diet<br />
Households responding that they<br />
sometimes or often did not have enough<br />
to eat were asked a similar follow-up.<br />
“Here are some reasons why people<br />
don’t always have enough to eat. For<br />
each one, please tell me if that is a<br />
reason why YOU might not always<br />
have enough to eat.” Reasons presented<br />
<strong>for</strong> a yes or no response were<br />
• Not enough money <strong>for</strong> food<br />
• Not enough time <strong>for</strong> shopping or<br />
cooking<br />
• Too hard to get to the store<br />
• On a diet<br />
• No working stove available<br />
• Not able to cook or eat because of<br />
health problems<br />
I compared the proportions of the<br />
elderly-only <strong>and</strong> nonelderly households<br />
reporting selected problems to examine<br />
whether food problems other than<br />
insufficient resources to buy food<br />
affected the elderly more so than they<br />
did the nonelderly. The food security<br />
status of households reporting each<br />
food access problem was also examined<br />
to assess whether the Food Security<br />
Scale is less sensitive to other food<br />
access problems <strong>for</strong> the elderly than<br />
<strong>for</strong> the nonelderly.<br />
Only data from the 1999 <strong>and</strong> 2000<br />
CPS-FSS were used <strong>for</strong> the analysis<br />
of the food sufficiency question <strong>and</strong><br />
its follow-ups because a somewhat<br />
different set of follow-up questions was<br />
asked in 1998. Mixed-age households<br />
(elderly <strong>and</strong> nonelderly living together)<br />
were excluded from the analysis as<br />
were those who did not respond to the<br />
38 Family Economics <strong>and</strong> <strong>Nutrition</strong> Review
food sufficiency question (3.9 percent).<br />
Unlike the scaling analysis, however,<br />
this analysis included households that<br />
denied or affirmed all scale items, so<br />
the sample sizes were large in spite of<br />
restricting the analysis to 2 years of<br />
data: 13,078 elderly-only households<br />
<strong>and</strong> 59,203 nonelderly households.<br />
Other Indicators of Unmet Food<br />
Needs Among Food-Secure<br />
<strong>Elderly</strong> <strong>and</strong> Nonelderly<br />
Households<br />
Some households turn to Federal or<br />
community food assistance programs<br />
when they have insufficient money <strong>and</strong><br />
other resources <strong>for</strong> food. Households<br />
that use these programs <strong>and</strong> are<br />
classified as food-secure may either<br />
have underreported the extent to which<br />
they are food insecure or may have<br />
depended on these programs to get<br />
enough food to be food-secure. To<br />
assess the extent of these conditions,<br />
I compared the proportions of foodsecure<br />
elderly-only <strong>and</strong> nonelderly<br />
households that used four food<br />
assistance programs that are available<br />
to elderly-only households <strong>and</strong> are<br />
reported in the CPS-FSS: the Food<br />
Stamp Program, senior meals (either<br />
Meals on Wheels or meals at a senior<br />
center), getting emergency food from<br />
a food pantry, <strong>and</strong> eating meals at an<br />
emergency soup kitchen.<br />
CPS-FSS data from the 1998, 1999,<br />
<strong>and</strong> 2000 surveys were combined <strong>for</strong><br />
this analysis. Most households with<br />
annual incomes above about 185<br />
percent of the Federal poverty line were<br />
not asked questions about their use of<br />
food programs, so the analysis was<br />
restricted to households with incomes<br />
below this level. The 3-year CPS-FSS<br />
sample of low-income food-secure<br />
households consisted of 7,072 elderlyonly<br />
households <strong>and</strong> 14,524 nonelderly<br />
households. For the analysis of food<br />
stamp participation, the analysis was<br />
further restricted to households with<br />
annual incomes below 130 percent of<br />
the Federal poverty line to exclude<br />
most households that were not incomeeligible<br />
<strong>for</strong> food stamps. This sample<br />
consisted of 3,467 elderly-only<br />
households <strong>and</strong> 9,152 nonelderly<br />
households.<br />
Results<br />
Scaling Analysis<br />
The response patterns of elderly-only<br />
households reflected greater consistency<br />
with the severity order of the<br />
items than did those of nonelderly<br />
households. With the dispersion of<br />
item scores equated, the discrimination<br />
parameter was 1.25 <strong>for</strong> elderly-only<br />
households versus 1.02 <strong>for</strong> nonelderly<br />
households (table 1). This indicates<br />
somewhat greater consistency in the<br />
way in which the elderly experience<br />
<strong>and</strong> manage food insecurity <strong>and</strong> may<br />
also indicate more consistent underst<strong>and</strong>ing<br />
of the questions by elderly<br />
respondents.<br />
Item-fit statistics confirm that the<br />
greater consistency of elderly-only<br />
responses was generally true <strong>for</strong> all<br />
items in the scale. There are no hard<strong>and</strong>-fast<br />
rules <strong>for</strong> assessing item-fit<br />
statistics, but infits in the range of 0.8<br />
to 1.2 are generally considered to be<br />
quite good, <strong>and</strong> 0.7 to 1.3 may be<br />
acceptable (Hamilton et al., 1997b;<br />
Linacre & Wright, 1994). Infit statistics<br />
<strong>for</strong> both samples were within an<br />
acceptable range <strong>and</strong> were remarkably<br />
similar between the two age groups <strong>for</strong><br />
corresponding items. 2 The outfit<br />
statistic <strong>for</strong> “Worried food would run<br />
out” was somewhat high (indicating<br />
erratic responses) in both samples but<br />
less so in the elderly sample. The most<br />
2<br />
The lower-than-expected infits <strong>for</strong> the two pairs<br />
of mutually dependent items (the frequency-ofoccurrence<br />
follow-up items <strong>and</strong> their base items)<br />
in both scales are artifacts of the statistical<br />
dependence of these items.<br />
Results of the scaling analysis<br />
allay concerns that the st<strong>and</strong>ard<br />
scale underreports the prevalence<br />
of food insecurity <strong>and</strong> hunger<br />
among the elderly because of<br />
differences in how they interpret<br />
<strong>and</strong> respond to the questions in<br />
the Food Security Survey Module.<br />
2003 Vol. 15 No. 1 39
Table 1. Item severity scores <strong>and</strong> fit statistics <strong>for</strong> elderly-only <strong>and</strong> nonelderly Food Security Scales<br />
<strong>Elderly</strong>-only households Nonelderly households<br />
(n=2,036) (n=17,033)<br />
Severity Severity<br />
Item score 1 Infit 2 Outfit 3 score 1 Infit 2 Outfit 3<br />
Worried food would run out 1.74 1.05 4.30 1.29 1.10 8.41<br />
Food bought didn’t last 2.64 .85 1.80 2.57 .98 3.83<br />
Couldn’t af<strong>for</strong>d balanced meals 2.83 1.22 12.70 3.61 1.23 4.07<br />
Cut size of meal or skipped meal 5.54 .77 .60 5.29 .71 .55<br />
Ate less than felt should 5.53 .96 .71 5.52 .87 .77<br />
Cut size of meal or skipped meal, 3+ months 6.16 .76 .39 6.43 .77 .48<br />
Hungry but didn’t eat 8.06 .86 .32 7.56 .95 .70<br />
Lost weight 8.45 1.11 1.26 8.74 1.04 .60<br />
Didn’t eat <strong>for</strong> whole day 9.53 .95 .42 9.28 .87 .53<br />
Didn’t eat <strong>for</strong> whole day, 3+ months 10.01 .83 .19 10.21 .79 .23<br />
Mean 6.04 6.05<br />
Mean absolute deviation 2.39 2.39<br />
St<strong>and</strong>ard deviation 2.81 2.81<br />
Discrimination coefficient 4 1.25 1.02<br />
1 The severity score of an item reflects the level of severity of food insecurity in households that are equally likely to report or to deny that the condition existed during the<br />
year. The metric of the severity scores is logistic (log-odds), <strong>and</strong> the zero point is arbitrary.<br />
2 Infit is a measure of the extent to which responses of all households to an item deviate from expectations based on the statistical measurement model used to create the<br />
scale (the Rasch model). Infits higher than 1 indicate a higher proportion of inconsistent responses (i.e., lower discrimination) than the other items in the scale. Infits lower<br />
than 1 indicate a lower proportion of inconsistent responses (higher discrimination) than the other items in the scale.<br />
3 Outfit is similar to infit except that it is more sensitive to highly erratic responses (outliers). Values higher than 1 indicate a higher-than-expected proportion of erratic<br />
responses (e.g., denial of a low-severity item by a household that affirms many higher-severity items). Values lower than 1 indicate fewer such responses than<br />
would be expected under model assumptions.<br />
4 Discrimination parameters were adjusted to equate the mean absolute deviation of item scores <strong>for</strong> each scale to that of the corresponding items in the st<strong>and</strong>ard<br />
scale as described in Guide to Measuring Household Food Security, Revised 2000 (Bickel et al., 2000). A constant was then added to each scale to equate the<br />
mean of the item scores to that of the corresponding items in the st<strong>and</strong>ard scale.<br />
notable outfit statistic was the high<br />
value (12.7) <strong>for</strong> “Couldn’t af<strong>for</strong>d<br />
balanced meals” in the elderly<br />
subsample. This indicates that elderlyonly<br />
responses to this item were more<br />
erratic than their responses to other<br />
items <strong>and</strong> more erratic than responses<br />
of the nonelderly to this item. Because<br />
“Couldn’t af<strong>for</strong>d balanced meals” is a<br />
low-severity item (2.83), these erratic<br />
or improbable responses would have<br />
been denials of this item by households<br />
that affirmed many other items. It is not<br />
known whether these reflect genuine<br />
differences in how food insecurity is<br />
experienced by different elderly<br />
households, misunderst<strong>and</strong>ing of the<br />
item by some elderly respondents, or<br />
coding errors by interviewers. Outfits<br />
this high can result from highly<br />
unexpected responses by just a few<br />
discrepant cases (three or four cases<br />
in a sample of this size), so further<br />
research is warranted prior to drawing<br />
conclusions about the suitability of the<br />
item <strong>for</strong> assessing food security of the<br />
elderly.<br />
Relative item severities were generally<br />
consistent between the elderly-only<br />
<strong>and</strong> nonelderly scales (fig. 1). This is<br />
evidence that the scale measures the<br />
same underlying phenomenon in both<br />
populations: that the questions are<br />
understood similarly by elderly <strong>and</strong><br />
nonelderly persons <strong>and</strong> that the two<br />
groups experience <strong>and</strong> respond to food<br />
insecurity similarly. An underlying<br />
assumption of the Rasch model is<br />
that the inter-relationships among<br />
the indicator items result from the<br />
relationships of each individual item<br />
to the underlying phenomenon (in this<br />
case, food insecurity). Thus, similar<br />
patterns of relationships among the<br />
indicator items in two populations are<br />
evidence that the items relate similarly<br />
to the underlying phenomenon in the<br />
two populations. If elderly people<br />
underreport food insecurity <strong>and</strong> hunger,<br />
then they do so with remarkable<br />
consistency across almost all of the<br />
items. The item about worrying is<br />
somewhat more severe (less often<br />
reported at similar levels of severity)<br />
on the elderly-only scale, as suggested<br />
by ethnographic research findings, but<br />
the difference is only about 0.45 logistic<br />
units, corresponding to an odds ratio<br />
of 0.64 (calculated by exponentiating<br />
the difference in item scores; 90 percent<br />
confidence interval is 0.58 to 0.70).<br />
40 Family Economics <strong>and</strong> <strong>Nutrition</strong> Review
Figure 1. Comparison of item severity scores, 1 elderly-only households versus nonelderly households<br />
12<br />
Item score, households with only elderly persons<br />
10<br />
8<br />
6<br />
4<br />
2<br />
Did not eat <strong>for</strong> whole day, 3+ months<br />
Did not eat <strong>for</strong> whole day<br />
Item<br />
Lost weight<br />
Equal score<br />
Hungry but did not eat<br />
Cut size of meals or skipped meals, 3+ months<br />
Cut size of meal or skipped meal<br />
Ate less than felt should<br />
Couldn't af<strong>for</strong>d balanced meals<br />
Food bought did not last<br />
Worried food would run out<br />
0<br />
0 2 4 6 8 10 12<br />
Item score, households with no elderly<br />
1<br />
The severity score of an item reflects the level of severity of food insecurity in households that are equally likely to report or to deny that the condition existed during the year.<br />
Note: An item falling on the “equal score” line would represent the same level of food insecurity in households with only elderly persons as in households with no elderly person<br />
present.<br />
The most notable difference in item<br />
scores of elderly-only households,<br />
compared with the nonelderly, is the<br />
lower item severity (more frequently<br />
reported at similar levels of severity)<br />
on the elderly-only scale of the item<br />
“We couldn’t af<strong>for</strong>d to eat balanced<br />
meals.” This item was 0.78 logistic<br />
units less severe <strong>for</strong> the elderly,<br />
corresponding to an odds ratio of 2.2<br />
(90 percent confidence interval 2.01 to<br />
2.39). That is, elderly-only households<br />
were more than twice as likely to report<br />
this condition as were nonelderly<br />
households at the same overall level of<br />
food insecurity. It is possible that this<br />
occurs because the elderly’s perceived<br />
st<strong>and</strong>ard of what a balanced meal<br />
consists of is more stringent than is<br />
true of the nonelderly. Thus it is harder<br />
to achieve, <strong>and</strong> they are more likely to<br />
report being unable to af<strong>for</strong>d a balanced<br />
meal.<br />
The item about balanced meals is the<br />
threshold item <strong>for</strong> classifying households<br />
as food-insecure. That is, it is<br />
the third item in severity order, <strong>and</strong><br />
households must affirm at least three<br />
items to be classified as food-insecure. 3<br />
There<strong>for</strong>e, its lower severity in the<br />
elderly scale would result in a slight<br />
upward bias on the prevalence of food<br />
insecurity among the elderly, compared<br />
with the nonelderly, as measured by<br />
the st<strong>and</strong>ard methods. This bias occurs<br />
because each group of households with<br />
the same raw score actually includes<br />
households with a range of “true” food<br />
security severity levels. If all of the<br />
items except the balanced meals item<br />
have the same item scores in elderly<br />
<strong>and</strong> nonelderly households, <strong>and</strong> if the<br />
3<br />
Under Rasch assumptions, a raw score <strong>for</strong><br />
the number of affirmative responses is an<br />
ordinal measure of the underlying construct<br />
(food insecurity in this case), provided<br />
households respond to the same set of<br />
questions. Thus, classification of households<br />
as to their food security status is based on<br />
their raw scores. Households that affirm 3<br />
or more of the 10 items in the scale assessed<br />
in this article are classified as food insecure<br />
irrespective of which 3 items they affirm.<br />
Households that affirm 6 or more of the<br />
items are classified as food insecure with<br />
hunger.<br />
2003 Vol. 15 No. 1 41
alanced meals item has a lower<br />
severity score <strong>for</strong> the elderly than <strong>for</strong><br />
the nonelderly, then some elderly<br />
households with “true” food security<br />
just below the food insecurity threshold<br />
will, nevertheless, affirm the balanced<br />
meals item <strong>and</strong> there<strong>for</strong>e be misclassified<br />
as food insecure by the<br />
st<strong>and</strong>ard food security classification<br />
procedures.<br />
The severity scores of items near the<br />
hunger threshold (cut size of meals or<br />
skipped meals in 3 or more months)<br />
were almost the same <strong>for</strong> the elderlyonly<br />
<strong>and</strong> nonelderly scales. There<strong>for</strong>e,<br />
estimates of the prevalence of hunger<br />
among the elderly are not likely to<br />
be biased <strong>and</strong> can be meaningfully<br />
compared with those of the general<br />
population.<br />
Other Indications of Food<br />
Problems Faced by the <strong>Elderly</strong><br />
<strong>Elderly</strong>-only households were about<br />
half as likely as nonelderly households<br />
to register food problems in response to<br />
the food sufficiency question, a ratio<br />
consistent with their relative rates of<br />
food insecurity <strong>and</strong> hunger based on the<br />
Food Security Scale. About 10 percent<br />
of elderly-only households indicated<br />
any problem (they did not always have<br />
enough to eat or they did not always<br />
have the kinds of food they wanted to<br />
eat), compared with nearly 20 percent<br />
of the nonelderly (table 2). Among<br />
elderly-only households, 1.7 percent<br />
reported that they sometimes or often<br />
did not have enough to eat, compared<br />
with 4.2 percent of nonelderly<br />
households. On both measures, the<br />
elderly/nonelderly differences could<br />
reflect a general stoicism of the elderly<br />
with regard to food needs, but the<br />
similar pattern across the two measures<br />
suggests, at least, that food-access<br />
problems other than insufficient<br />
resources to buy food do not affect<br />
the elderly in substantially larger<br />
proportions, compared with the<br />
effect on the nonelderly.<br />
Table 2. Food sufficiency status versus food security status of elderly-only <strong>and</strong><br />
nonelderly households, average 1999-2000<br />
<strong>Elderly</strong>-only Nonelderly<br />
households households<br />
Food sufficiency status (n=13,078) (n=59,203)<br />
Percent<br />
Enough of the kinds of food we want to eat 89.89 80.46<br />
Food-secure 88.76 78.09<br />
Food-insecure without hunger 1.03 2.06<br />
Food-insecure with hunger .10 .30<br />
Enough to eat but not always the kinds of food we want 8.44 15.30<br />
Food-secure 6.09 9.65<br />
Food-insecure without hunger 1.81 4.43<br />
Food-insecure with hunger .54 1.22<br />
Sometimes not enough to eat 1.39 3.49<br />
Food-secure .23 .58<br />
Food-insecure without hunger .57 1.46<br />
Food-insecure with hunger .58 1.45<br />
Often not enough to eat .29 .75<br />
Food-secure .05 .07<br />
Food-insecure without hunger .04 .13<br />
Food-insecure with hunger .20 .54<br />
Note: All percentages were calculated using sample weights provided by the Census Bureau so that the<br />
interviewed households represent the U.S. noninstitutionalized population.<br />
Specific food problems other than<br />
insufficient resources to buy food were<br />
no more prevalent among elderly-only<br />
households than among nonelderly<br />
households (table 3). Not surprisingly,<br />
lack of time <strong>for</strong> shopping or cooking<br />
was much less of a problem <strong>for</strong> the<br />
elderly-only than <strong>for</strong> the nonelderly<br />
households. The prevalences of other<br />
problems were remarkably similar <strong>for</strong> the<br />
elderly <strong>and</strong> nonelderly households.<br />
This was true even of problems such as<br />
“too hard to get to the store” <strong>and</strong> “not<br />
able to cook or eat because of health<br />
problems,” which might be thought of<br />
as being more problematic <strong>for</strong> the<br />
elderly. These problems account <strong>for</strong> a<br />
greater proportion of those elderly-only<br />
house-holds that reported any problem<br />
than was true <strong>for</strong> nonelderly households.<br />
For example, 1.68 percent of<br />
elderly-only households reported that<br />
they sometimes or often did not have<br />
enough to eat (table 2). Included among<br />
these households were 0.66 percent<br />
who said this was because it was too<br />
hard to get to the store. Thus, this<br />
problem accounted <strong>for</strong> 39 percent of<br />
elderly-only households who sometimes<br />
or often did not have enough to eat. The<br />
corresponding statistic <strong>for</strong> nonelderly<br />
households was 19 percent.<br />
Other Indicators of Unmet Food<br />
Needs Among Food-Secure<br />
<strong>Elderly</strong> <strong>and</strong> Nonelderly<br />
Households<br />
Food-secure elderly-only households<br />
relied less on Federal <strong>and</strong> community<br />
food assistance programs than did<br />
nonelderly households, with the<br />
exception of meal programs that are<br />
specifically intended <strong>for</strong> senior citizens<br />
(table 4). Among food-secure households<br />
with annual incomes below 130<br />
42 Family Economics <strong>and</strong> <strong>Nutrition</strong> Review
Table 3. Other food problems reported by elderly-only <strong>and</strong> nonelderly households,<br />
average 1999-2000<br />
<strong>Elderly</strong>-only Nonelderly<br />
households households<br />
Food problem (n=13,078) (n=59,203)<br />
Percent<br />
Enough to eat but not always the kinds of food we want because:<br />
Not enough time <strong>for</strong> shopping or cooking 0.95 5.93<br />
Food-secure .79 4.34<br />
Food-insecure (with or without hunger) .16 1.59<br />
Too hard to get to the store 2.48 2.62<br />
Food-secure 1.56 1.62<br />
Food-insecure (with or without hunger) .92 1.00<br />
On a special diet 2.12 1.90<br />
Food-secure 1.61 1.35<br />
Food-insecure (with or without hunger) .51 .55<br />
Sometimes or often not enough to eat because:<br />
Not enough time <strong>for</strong> shopping or cooking .18 .72<br />
Food-secure .06 .22<br />
Food-insecure without hunger .08 .26<br />
Food-insecure with hunger .05 .25<br />
Too hard to get to the store .66 .79<br />
Food-secure .13 .10<br />
Food-insecure without hunger .24 .28<br />
Food-insecure with hunger .29 .41<br />
On a diet .23 .34<br />
Food-secure .03 .10<br />
Food-insecure without hunger .08 .11<br />
Food-insecure with hunger .12 .12<br />
No working stove available .01 .15<br />
Food-secure 0.00 .02<br />
Food-insecure without hunger .01 .04<br />
Food-insecure with hunger 0.00 .09<br />
Not able to cook or eat because of health problems .23 .29<br />
Food-secure .06 .02<br />
Food-insecure without hunger .09 .09<br />
Food-insecure with hunger .09 .18<br />
Note: All percentages were calculated by using sample weights provided by the Census Bureau so that<br />
the interviewed households represent the U.S. noninstitutionalized population.<br />
percent of the Federal poverty line,<br />
about 12 percent of elderly-only<br />
households reported receiving food<br />
stamps during the previous 12 months,<br />
compared with about 22 percent of<br />
nonelderly households. Food-secure<br />
elderly-only households with income<br />
below 185 percent of the Federal<br />
poverty line also were less likely to<br />
receive food from a church, food<br />
pantry, or food bank than were their<br />
counterparts: food-secure nonelderly<br />
households. Use of emergency (soup)<br />
kitchens by food-secure households in<br />
both age groups was rare <strong>and</strong> did not<br />
differ substantially. These findings<br />
suggest that elderly households with<br />
unmet food needs, or who are meeting<br />
some of their food needs from food<br />
assistance programs, are no more likely<br />
to be classified as food-secure than are<br />
nonelderly households.<br />
About 8 percent of food-secure elderlyonly<br />
households with annual incomes<br />
below 185 percent of the Federal<br />
poverty line received assistance from<br />
community meal programs. This<br />
assistance included either prepared<br />
meals eaten at community programs<br />
or senior centers or meals delivered<br />
to their homes by programs such as<br />
“Meals on Wheels.” About 14 percent<br />
of low-income food-secure elderly-only<br />
households received assistance from<br />
one or more of the four food assistance<br />
programs analyzed. This suggests that<br />
some elderly households with unmet<br />
food needs, or who were meeting part<br />
of their food needs from food assistance<br />
programs, were classified as<br />
food secure. The food security of these<br />
households may have been tenuous or<br />
marginal at times, or they may, indeed,<br />
have been food-insecure. Similar, or<br />
even higher, reliance on these programs<br />
by nonelderly households, however,<br />
suggests that any questionable classification<br />
or misclassification is no more<br />
prevalent <strong>for</strong> the elderly than <strong>for</strong> the<br />
nonelderly.<br />
2003 Vol. 15 No. 1 43
Table 4. Use of Federal <strong>and</strong> community food assistance programs by low-income, food-secure, elderly-only <strong>and</strong> nonelderly<br />
households, average 1998-2000<br />
<strong>Elderly</strong>-only<br />
Nonelderly<br />
Food assistance households households<br />
Percent<br />
Food-secure households with annual income below 130 percent of the Federal poverty line<br />
Received food stamps 12.4 21.7<br />
Food-secure households with annual income below 185 percent of the Federal poverty line<br />
Senior meals (delivered to home or in center) 7.7 NA<br />
Received emergency food from church, food pantry, or food bank 2.2 3.2<br />
Ate a meal at a soup kitchen .3 .4<br />
Received assistance from any of these four programs 14.4 17.2<br />
Number of cases, income below 130 percent of Federal poverty line (unweighted) 3,467 9,152<br />
Number of cases, income below 185 percent of Federal poverty line (unweighted) 7,072 14,524<br />
Note: All percentages were calculated by using sample weights provided by the Census Bureau so that the interviewed households represent the U.S.<br />
noninstitutionalized population.<br />
Conclusions<br />
The U.S. Food Security Scale fairly<br />
represents the food security of the<br />
elderly, compared with that of the<br />
nonelderly. Results of the scaling<br />
analysis allay concerns that the st<strong>and</strong>ard<br />
scale underreports the prevalence of<br />
food insecurity <strong>and</strong> hunger among the<br />
elderly because of differences in how<br />
they interpret <strong>and</strong> respond to the<br />
questions in the Food Security Survey<br />
Module. With one exception, relative<br />
item severities were similar <strong>for</strong> elderlyonly<br />
<strong>and</strong> nonelderly households, <strong>and</strong><br />
the exception would lead to a slight<br />
upward bias on measured food<br />
insecurity (but not hunger) among<br />
the elderly. Overall, response patterns<br />
of the elderly, compared with the<br />
nonelderly, were more consistent with<br />
the severity-order of the items, <strong>and</strong> this<br />
was true of all items except, possibly,<br />
the item about balanced meals, to which<br />
the elderly responded somewhat more<br />
erratically than did the nonelderly.<br />
It cannot be ruled out that elders<br />
underreport all indicators of food<br />
insecurity <strong>and</strong> hunger, but this<br />
underreporting would have to be<br />
remarkably consistent across almost<br />
all items to result in the similarity of<br />
relative item severities observed in this<br />
study.<br />
Responses to the food sufficiency<br />
question indicate that the elderly do<br />
face food-access problems other than<br />
insufficient resources to buy food—<br />
most notably problems getting to a<br />
store. However, these problems are no<br />
more likely <strong>for</strong> elderly than nonelderly<br />
households to be so serious as to<br />
disrupt desired eating patterns or result<br />
in having insufficient food to eat.<br />
A small proportion of elderly households<br />
classified as food-secure obtain<br />
food assistance from Federal <strong>and</strong><br />
community programs. Some of these<br />
households probably are less than fully<br />
food-secure, <strong>and</strong> some may, indeed, be<br />
food-insecure. However, food-secure<br />
elderly-only households are less likely<br />
than are food-secure nonelderly<br />
households to rely on programs that<br />
are accessible to both.<br />
Clearly, the Food Security Scale is not<br />
a perfect or complete measure of food<br />
security. It measures primarily the main<br />
dimension of food security—assured<br />
access to sufficient <strong>and</strong> adequate food.<br />
It does not measure food safety <strong>and</strong><br />
only indirectly measures the dimension<br />
of social acceptability of methods used<br />
to acquire enough food. Furthermore,<br />
not all food problems faced by the<br />
elderly (or by the nonelderly) are<br />
usefully considered as food security<br />
problems. <strong>Nutrition</strong> security, a somewhat<br />
broader concept that includes<br />
food security as well as other factors<br />
affecting the nutrition of those who are<br />
food secure, may be a useful framework<br />
<strong>for</strong> assessing <strong>and</strong> interrelating the<br />
range of issues that affect nutritional<br />
adequacy of the diets of the elderly, as<br />
well as the nonelderly (Garrett & Ruel,<br />
2000).<br />
44 Family Economics <strong>and</strong> <strong>Nutrition</strong> Review
References<br />
Andrews, M., Nord, M., Bickel, G., & Carlson, S. (2000). Household Food<br />
Security in the United States, 1999. Food Assistance <strong>and</strong> <strong>Nutrition</strong> Research<br />
Report No. 8. U.S. Department of Agriculture, Economic Research Service.<br />
Available: www.ers.usda.gov/foodsecurity/briefing/.<br />
Baker, F.B. (1992). Item Response Theory: Parameter Estimation Techniques.<br />
New York: Marcel Dekker, Inc.<br />
Bickel, G., Carlson, S., & Nord, M. (1999). Household Food Security in the<br />
United States, 1995-1998, Advance Report. U.S. Department of Agriculture, Food<br />
<strong>and</strong> <strong>Nutrition</strong> Service, Office of Analysis, <strong>Nutrition</strong>, <strong>and</strong> Evaluation. Available:<br />
www.fns.usda.gov/oane/MENU/Published/FoodSecurity/foodsecurity.htm.<br />
Bickel, G., Nord, M., Price, C., Hamilton, W.L., & Cook, J.T. (2000). Guide to<br />
Measuring Household Food Security, Revised 2000. U.S. Department of<br />
Agriculture, Food <strong>and</strong> <strong>Nutrition</strong> Service, Office of Analysis, <strong>Nutrition</strong>, <strong>and</strong><br />
Evaluation. Available: www.fns.usda.gov/oane/MENU/Published/FoodSecurity/<br />
foodsecurity.htm.<br />
Bond, T.G., & Fox, C.M. (2001). Applying the Rasch Model: Fundamental<br />
Measurement in the Human Sciences. Mahway, NJ: Lawrence Erlbaum<br />
Associates.<br />
Fischer, G.H., & Molenaar, I.W. (Eds.). (1995). Rasch Models: Foundations,<br />
Recent Developments, <strong>and</strong> Applications. New York: Springer-Verlag.<br />
Fitchen, J.M. (1981). Poverty in Rural America: A Case Study. Boulder, CO:<br />
Westview Press.<br />
Fitchen, J.M. (1988). Hunger, malnutrition, <strong>and</strong> poverty in the contemporary<br />
United States: Some observations on their social <strong>and</strong> cultural context. Food <strong>and</strong><br />
Foodways, 2, 309-333.<br />
Garrett, J.L., & Ruel, M.T. (Eds.). (2000). Achieving Urban Food <strong>and</strong> <strong>Nutrition</strong><br />
Security in the Developing World. Washington, DC: Institute <strong>for</strong> Food <strong>Policy</strong><br />
Research. Available: www.ifpri.org.<br />
Guthrie, J.F., & Lin, B.H. (2002). An overview of the diets of lower- <strong>and</strong> higherincome<br />
elderly <strong>and</strong> their food assistance options. Journal of <strong>Nutrition</strong> Education<br />
<strong>and</strong> Behavior, 34(Supplement 1), S31-S41.<br />
Hambleton, R.K., Swaminathan, H., & Rogers, H.J. (1991). Fundamentals of Item<br />
Response Theory. Newbury Park: Sage Publications.<br />
Hamilton, W.L., Cook, J.T., Thompson, W.W., Lawrence, L.F., Frongillo, E.A. Jr.,<br />
Olson, C.M., et al. (1997a). Household Food Security in the United States in<br />
1995: Summary Report of the Food Security Measurement Project. U.S.<br />
Department of Agriculture, Food <strong>and</strong> <strong>Nutrition</strong> Service, Office of Analysis,<br />
<strong>Nutrition</strong>, <strong>and</strong> Evaluation. Available: www.fns.usda.gov/oane/MENU/Published/<br />
FoodSecurity/foodsecurity.htm.<br />
2003 Vol. 15 No. 1 45
Hamilton, W.L., Cook, J.T., Thompson, W.W., Lawrence, L.F., Frongillo, E.A. Jr.,<br />
Olson, C.M., et al. (1997b). Household Food Security in the United States in<br />
1995: Technical Report. U.S. Department of Agriculture, Food <strong>and</strong> <strong>Nutrition</strong><br />
Service, Office of Analysis, <strong>Nutrition</strong>, <strong>and</strong> Evaluation. Available:<br />
www.fns.usda.gov/oane/MENU/Published/FoodSecurity/foodsecurity.htm.<br />
Linacre, J.M., & Wright, B.D. (1994). Reasonable mean-square fit values. Rasch<br />
Measurement Transactions, 8(3), 370. Available: http://www.rasch.org/rmt/<br />
rmt83.htm.<br />
Nord, M. (2000). Comparing Prevalence Rates of Food Insecurity <strong>and</strong> Hunger<br />
Based on Non-St<strong>and</strong>ard Question Sets to the National Benchmark. Poster<br />
presented at the Fourth International Conference on Dietary Assessment Methods,<br />
Tucson, AZ, September 17-20.<br />
Nord, M. (2002). Food security rates are high <strong>for</strong> elderly households. FoodReview,<br />
25(2), 19-24. Available: www.ers.usda.gov/foodsecurity/briefing.<br />
Nord, M., Kabbani, N., Tiehen, L., Andrews, M., Bickel, G., & Carlson, S. (2002).<br />
Household Food Security in the United States, 2000. Food Assistance <strong>and</strong><br />
<strong>Nutrition</strong> Research Report No. 21. U.S. Department of Agriculture, Economic<br />
Research Service. Available: www.ers.usda.gov/foodsecurity/briefing.<br />
Ohls, J., Radbill, L., & Schirm, A. (2001). Household Food Security in the United<br />
States, 1995-1997: Technical Issues <strong>and</strong> Statistical Report. Report prepared <strong>for</strong><br />
U.S. Department of Agriculture, Food <strong>and</strong> <strong>Nutrition</strong> Service. Available:<br />
www.fns.usda.gov/oane/.<br />
Radimer, K.L., Olson, C.M., & Campbell, C.C. (1990). Development of indicators to<br />
assess hunger. Journal of <strong>Nutrition</strong>, 120(Suppl 11), 1544-1548.<br />
Radimer, K.L., Olson, C.M., Greene, J.C., Campbell, C.C., & Habicht, J.P. (1992).<br />
Underst<strong>and</strong>ing hunger <strong>and</strong> developing indicators to assess it in women <strong>and</strong><br />
children. Journal of <strong>Nutrition</strong> Education, 24(1), 36S-44S.<br />
Sahyoun, N., & Basiotis, P.P. (2000). Food insufficiency <strong>and</strong> the nutritional status<br />
of the elderly population. <strong>Nutrition</strong> Insights No. 18. Available: www.usda.gov/<br />
cnpp.<br />
Wehler, C.A., Scott, R.I., & Anderson, J.J. (1992). The Community Childhood<br />
Hunger Identification Project: A model of domestic hunger—demonstration project<br />
in Seattle, Washington. Journal of <strong>Nutrition</strong> Education, 24(1), 29S-35S.<br />
Wright, B.D. (1977). Solving Measurement Problems with the Rasch Model.<br />
Chicago: The University of Chicago, College of Education, MESA Psychometric<br />
Laboratory. Available: www.rasch.org/memos.htm.<br />
Wright, B.D. (1983). Fundamental Measurement in Social Science <strong>and</strong> Education.<br />
Chicago: The University of Chicago, College of Education, MESA Psychometric<br />
Laboratory. Available: www.rasch.org/memos.htm.<br />
Wright, B.D., & Masters, G.N. (1982). Rating Scale Analysis. Chicago: University<br />
of Chicago, MESA Press.<br />
46 Family Economics <strong>and</strong> <strong>Nutrition</strong> Review
A Statewide Educational Intervention<br />
to Improve Older Americans’<br />
<strong>Nutrition</strong> <strong>and</strong> Physical Activity<br />
M.A. McCamey, MS, RD<br />
The University of Georgia<br />
N.A. Hawthorne, MS, RD<br />
The University of Georgia<br />
S. Reddy, MS, RD<br />
Georgia Division of Aging Services<br />
M. Lombardo, DC<br />
Wellness, Inc.<br />
M.E. Cress, PhD<br />
The University of Georgia<br />
The goal of “Take Charge of Your Health <strong>for</strong> Older Adults,” a community-based,<br />
statewide intervention program, was to improve the nutritional status, functional<br />
ability, <strong>and</strong> physical activity of older adults participating in Title III congregate<br />
meal programs in Georgia. A pre-test, a series of nutrition education <strong>and</strong> physical<br />
activity sessions, <strong>and</strong> a post-test were completed by 501 older adults. Results<br />
showed that the responses to several measures significantly improved after the<br />
intervention. For example, the percentage of older adults with knowledge that<br />
5 daily servings of fruits <strong>and</strong> vegetables are recommended almost doubled (34 to<br />
64 percent); whereas, those knowing that saturated fat increases the risk of heart<br />
disease rose from 55 to 77 percent. Consumption of vegetables—not including<br />
potatoes, carrots, or salad—increased from 1.6 to 1.8 average servings a day.<br />
Older adults also improved their walking speed from 9.8 to 9.1 seconds, <strong>and</strong> a<br />
greater percentage of the participants (from 55 to 82 percent) reported per<strong>for</strong>ming<br />
leg exercises during the previous week.<br />
M.A. Johnson, PhD<br />
The University of Georgia<br />
A<br />
dequate nutrition <strong>and</strong> physical<br />
activity are essential <strong>for</strong><br />
health maintenance, functional<br />
independence, <strong>and</strong> quality of life.<br />
Messages designed to prevent disease<br />
<strong>and</strong> improve the health <strong>and</strong> quality<br />
of life <strong>for</strong> all Americans have been<br />
promoted by national public policies<br />
such as Healthy People 2010 (U.S.<br />
Department of Health <strong>and</strong> Human<br />
Services [DHHS], 2000), the Food<br />
Guide Pyramid (U.S. Department<br />
of Agriculture [<strong>US</strong>DA], 1996), the<br />
Dietary Guidelines <strong>for</strong> Americans<br />
(<strong>US</strong>DA & DHHS, 2000), <strong>and</strong> the<br />
Surgeon General’s Report on Physical<br />
Activity <strong>and</strong> Health (DHHS, 1996).<br />
Despite the surge in social marketing<br />
campaigns, many Americans—<br />
particularly older adults—are not<br />
meeting these recommendations.<br />
Data from the Behavioral Risk Factor<br />
Surveillance System, <strong>for</strong> example,<br />
showed that in 1998 only 21.2 percent<br />
of adults age 65 <strong>and</strong> older in Georgia<br />
consumed 5 or more daily servings of<br />
fruits <strong>and</strong> vegetables (Behavioral Risk<br />
Factor Surveillance System, 1998). In<br />
an additional report in 1999, data from<br />
this Surveillance System indicated that<br />
in the past 30 days, 41.5 percent of<br />
Georgians age 65 or older were not<br />
involved in any leisure-time activity,<br />
that is, nonoccupational physical<br />
activity (1999).<br />
The Administration on Aging’s<br />
Older Americans <strong>Nutrition</strong> Program,<br />
<strong>for</strong>merly known as the <strong>Elderly</strong> <strong>Nutrition</strong><br />
Program, was established in 1972 to<br />
fund nutrition <strong>and</strong> social service<br />
programs <strong>for</strong> adults age 60 <strong>and</strong> older.<br />
Also known as the Title III <strong>Nutrition</strong><br />
Program, this service, based on factors<br />
such as low income, physical disability,<br />
<strong>and</strong> social isolation, is intended to<br />
improve the dietary intakes of older<br />
adults, with emphasis given to those<br />
2003 Vol. 15 No. 1 47
at greatest risk of developing nutrition<br />
problems. The Older Americans<br />
<strong>Nutrition</strong> Program also provides<br />
numerous services that emphasize<br />
preventive intervention programs<br />
through the use of nutrition screenings<br />
<strong>and</strong> education, as well as other healthrelated<br />
<strong>and</strong> social support services<br />
(Millen, Ohls, Ponza, & McCool,<br />
2002). It is also the largest U.S.<br />
community nutrition program <strong>for</strong> older<br />
adults, serving over 3 million meals<br />
daily across the Nation, including<br />
meals to almost 32,000 Georgians in<br />
2000 (Georgia Department of Human<br />
Resources, 2002).<br />
An Executive Summary of Title III<br />
programs reported significant health<br />
problems within the U.S. population<br />
of older adults (Millen et al., 2002,<br />
Ponza, Ohls, & Millen, 1996). Many<br />
of these health problems—such as<br />
cardiovascular disease, hypertension,<br />
diabetes mellitus, <strong>and</strong> obesity—are<br />
related to poor nutrition <strong>and</strong> physical<br />
activity <strong>and</strong> there<strong>for</strong>e could be lessened<br />
by interventions related to nutrition<br />
<strong>and</strong> physical activity. Data from other<br />
national sources (Millen et al., 2002;<br />
Ponza et al., 1996) <strong>and</strong> from within<br />
Georgia (Accettura, 2000; Aspinwall,<br />
2001; Brackett, 1999) indicate that<br />
participants in the Title III <strong>Nutrition</strong><br />
Program are at high nutritional risk <strong>and</strong><br />
have physical impairments included<br />
within the list of activities of daily<br />
living.<br />
Prior research by the University of<br />
Georgia’s Department of Foods <strong>and</strong><br />
<strong>Nutrition</strong> has exposed the high-risk<br />
status of many older adults in northeast<br />
Georgia who participate in the<br />
Older Americans <strong>Nutrition</strong> Program<br />
<strong>and</strong> has provided a snapshot of<br />
the probable characteristics of the<br />
program’s participants across the State.<br />
These studies found that more than<br />
50 percent of participants were at high<br />
nutritional risk <strong>and</strong> that more than 30<br />
percent were obese, had self-reported<br />
diabetes or poor glucose control, <strong>and</strong><br />
were hypertensive (Accettura, 2000;<br />
Brackett, 1999). These results indicate<br />
that this population is at increased<br />
nutritional risk, are at increased risk <strong>for</strong><br />
poor health overall, <strong>and</strong> could benefit<br />
greatly from nutrition intervention<br />
programs. Thus, a great need exists<br />
to develop, implement, <strong>and</strong> evaluate<br />
nutrition <strong>and</strong> health education programs<br />
to determine gains in knowledge<br />
<strong>and</strong> behavior changes. Hence, the<br />
goals of this study were to evaluate<br />
the effect of a nutrition education<br />
curriculum <strong>and</strong> an intervention<br />
program (leg exercises) designed to<br />
enhance older adults’ knowledge about<br />
nutrition <strong>and</strong> fitness <strong>and</strong> to improve<br />
their behaviors related to diet, physical<br />
activity, <strong>and</strong> overall health <strong>and</strong> wellbeing.<br />
National recommendations indicate<br />
that facilities with Older Americans<br />
<strong>Nutrition</strong> Programs are ideal settings<br />
<strong>for</strong> nutrition <strong>and</strong> health promotion<br />
programs in older adult populations<br />
(Millen et al., 2002). Most research<br />
with these program participants<br />
focused on documenting poor nutritional<br />
status <strong>and</strong> nutritional risk factors<br />
(Millen et al., 2002). The evaluation<br />
of combined nutrition <strong>and</strong> physical<br />
activity interventions targeted to older<br />
adults in this program in the Southeast<br />
is lacking. There<strong>for</strong>e, this evaluation is<br />
of great value <strong>for</strong> both the well-being<br />
of the older adults served <strong>and</strong> <strong>for</strong> the<br />
State in its quest to provide nutrition<br />
<strong>and</strong> health promotion activities <strong>and</strong><br />
services <strong>for</strong> this population.<br />
Methods<br />
The first phase of the study consisted<br />
of training the staff, followed by<br />
recruiting the participants, obtaining<br />
approvals from institutional review<br />
boards <strong>and</strong> in<strong>for</strong>med consent from<br />
participants, <strong>and</strong> administrating the<br />
pre-test, which consisted of a<br />
questionnaire <strong>and</strong> two fitness batteries.<br />
The second phase consisted of the<br />
intervention: nutrition education <strong>and</strong><br />
leg-exercise programs. The last phase<br />
was the post-test.<br />
Participant Recruitment<br />
<strong>and</strong> Criteria<br />
The directors of centers <strong>for</strong> senior<br />
citizens, county Extension agents,<br />
health educators, <strong>and</strong> staffs of Area<br />
Agencies on Aging helped to recruit<br />
participants, schedule interviews, <strong>and</strong><br />
remind participants when they were<br />
to take part in the study. Depending<br />
on the particular site, one or more of<br />
these individuals were responsible <strong>for</strong><br />
conducting the pre- <strong>and</strong> post-tests<br />
<strong>and</strong> <strong>for</strong> disseminating the nutrition<br />
education curriculum. Staff devoted<br />
to implementing the study received<br />
training from the University of<br />
Georgia’s Department of Foods <strong>and</strong><br />
<strong>Nutrition</strong> staff who were also available<br />
throughout the study to answer<br />
questions or address problems.<br />
Two criteria were used to determine<br />
whether individuals were eligible to<br />
participate in the study: (1) they had to<br />
be age 60 or older, <strong>and</strong> (2) they had to<br />
receive congregate meals provided by<br />
the Georgia Older Americans <strong>Nutrition</strong><br />
Program. Along with in<strong>for</strong>mation about<br />
in<strong>for</strong>med consent, an oral description<br />
of the study, including in<strong>for</strong>mation<br />
about the requirements, procedures,<br />
<strong>and</strong> benefits of participation, was given<br />
to all interested persons. We received<br />
written, in<strong>for</strong>med consent from 655<br />
men <strong>and</strong> women from 28 counties<br />
representing the 12 Planning Service<br />
Areas (geographic <strong>and</strong> programmatic<br />
regions) in Georgia that are served by<br />
the Area Agencies on Aging.<br />
Intervention Programs<br />
The nutrition education <strong>and</strong> physical<br />
activity intervention program was<br />
called “Take Charge of Your Health <strong>for</strong><br />
Older Adults.” These commercially<br />
available materials were developed by<br />
48 Family Economics <strong>and</strong> <strong>Nutrition</strong> Review
the Georgia Division of Aging Services<br />
<strong>and</strong> Wellness, Inc., <strong>and</strong> focused on<br />
correcting risk factors <strong>for</strong> poor nutrition<br />
in older adults <strong>and</strong> facilitating the<br />
voluntary adoption of eating behaviors<br />
that promote health <strong>and</strong> well-being<br />
<strong>for</strong> older adults. The key themes of<br />
this curriculum—centering on the<br />
program’s three campaign messages:<br />
Take 5 a Day, Take Down Fat, <strong>and</strong><br />
Take Action—were established by the<br />
Georgia Coalition <strong>for</strong> Physical Activity<br />
<strong>and</strong> <strong>Nutrition</strong> (Georgia Coalition <strong>for</strong><br />
Physical Activity <strong>and</strong> <strong>Nutrition</strong>, 2002)<br />
<strong>and</strong> followed the principles of the Food<br />
Guide Pyramid (<strong>US</strong>DA, 1996) <strong>and</strong> the<br />
Dietary Guidelines <strong>for</strong> Americans<br />
(<strong>US</strong>DA & DHHS, 2000).<br />
The 12 lessons of “Take Charge of<br />
Your Health <strong>for</strong> Older Adults” included<br />
topics such as heart disease <strong>and</strong> high<br />
blood pressure, calcium <strong>and</strong> osteoporosis,<br />
diabetes, <strong>and</strong> nutrition <strong>and</strong><br />
cancer prevention. The five leg<br />
exercises consisted of toe raises <strong>for</strong><br />
the calf muscles, side-leg lifts <strong>for</strong> the<br />
abductor muscles, leg curls <strong>for</strong> the<br />
hamstring muscles, knee extensions<br />
<strong>for</strong> the thigh muscles (quadriceps),<br />
<strong>and</strong> isometric straight-leg lifts <strong>for</strong><br />
both hip flexors <strong>and</strong> the quadriceps<br />
(National Institute on Aging, 2001).<br />
Modifications were also included<br />
<strong>for</strong> elders in wheelchairs or <strong>for</strong> those<br />
otherwise unable to st<strong>and</strong>. These<br />
exercises were graphically depicted<br />
on a placemat to help encourage<br />
participation <strong>and</strong> to provide visual<br />
cues. Classes were given one to two<br />
times a month, <strong>and</strong> participants<br />
were encouraged to per<strong>for</strong>m the leg<br />
exercises on a daily basis either at<br />
home or at the senior center.<br />
Assessment Instruments<br />
Dietary intakes of fruits <strong>and</strong> vegetables,<br />
<strong>for</strong> both the pre- <strong>and</strong> post-test<br />
questionnaires, were assessed by using<br />
six questions taken from the Statebased<br />
Behavioral Risk Factor<br />
Surveillance System, administered<br />
in collaboration with the <strong>Center</strong>s<br />
<strong>for</strong> Disease Control <strong>and</strong> Prevention<br />
(Behavioral Risk Factor Surveillance<br />
System, 1999). In<strong>for</strong>mation from this<br />
Surveillance System is used to track<br />
trends in behavior changes among the<br />
population, to determine priority health<br />
issues <strong>and</strong> develop plans to address<br />
them, <strong>and</strong> to monitor the effectiveness<br />
of interventions. We used the six<br />
questions to assess the frequency<br />
of consumption of certain fruit <strong>and</strong><br />
vegetable groups according to daily,<br />
weekly, monthly, or yearly timeframes.<br />
For our study, we calculated fruit <strong>and</strong><br />
vegetable consumption by summing<br />
the frequency of consumption of<br />
the six items from the Surveillance<br />
System’s core food-frequency<br />
instrument. Knowledge <strong>and</strong> behavior<br />
questions that related to dietary intake,<br />
food behaviors, <strong>and</strong> exercise/physical<br />
activity were also addressed by<br />
selected questions from this Behavioral<br />
Risk Factor Surveillance System. Other<br />
questions that focused on older adults’<br />
consumption of milk, knowledge<br />
about fat consumption <strong>and</strong> health,<br />
<strong>and</strong> whether they read nutrition labels<br />
were adapted from Elbon (1998).<br />
Following the questionnaire, the<br />
participants’ fitness level was<br />
assessed with a short-battery <strong>for</strong>m<br />
of the Established Populations <strong>for</strong><br />
Epidemiologic Studies of the <strong>Elderly</strong><br />
(EPESE) (Guralnik et al., 1994) <strong>and</strong><br />
the Fullerton Functional Fitness Test<br />
<strong>for</strong> Older Americans (Rikli & Jones,<br />
1999). The EPESE test assessed older<br />
adults’ mobility by measuring three<br />
categories—balance, strength, <strong>and</strong><br />
gait speed—as they per<strong>for</strong>med the<br />
following tasks: st<strong>and</strong>ing balance,<br />
chair st<strong>and</strong>s, <strong>and</strong> an 8-foot walk,<br />
respectively. Per<strong>for</strong>mance on each<br />
of the three categories was scored<br />
on a scale of 0 to 4. A summary<br />
per<strong>for</strong>mance score was calculated by<br />
summing each of the three category<br />
scores (range from 0 to 12), with<br />
increasing values representing<br />
Whereas total mean intake of<br />
fruits <strong>and</strong> vegetables <strong>and</strong> the<br />
percentage of people who<br />
consumed 5 or more servings<br />
per day did not increase . . .<br />
knowledge that 5 or more<br />
servings of fruits <strong>and</strong> vegetables<br />
should be consumed each day<br />
did increase significantly: from<br />
34 to 64 percent.<br />
2003 Vol. 15 No. 1 49
functional per<strong>for</strong>mance. We designated<br />
the functional categories based on the<br />
literature (Guralnik et al., 1994), which<br />
reported a strong association with<br />
measures of self-reported disability.<br />
For example, 48 to 91 percent of the<br />
study participants who reported that<br />
they needed help to walk one-half mile<br />
had a per<strong>for</strong>mance summary score<br />
ranging from 0 to 5, an indication of<br />
low functional ability. In comparison<br />
15 to 36 percent of those who reported<br />
needing help scored from 6 to 9, an<br />
indication of average functioning; <strong>and</strong><br />
3 to 9 percent of participants had a<br />
summary per<strong>for</strong>mance score of 10 to<br />
12, indicating high functional ability.<br />
The fitness test, also used to assess<br />
the functional ability of program<br />
participants, was designed to obtain<br />
normative data regarding physical <strong>and</strong><br />
functional per<strong>for</strong>mance of communitydwelling<br />
older adults <strong>and</strong> to identify<br />
criterion-reference st<strong>and</strong>ards needed<br />
by the older adults to maintain the<br />
ability to per<strong>for</strong>m “desired activity<br />
goals.” The six components to the<br />
Fullerton Functional Fitness Test<br />
<strong>for</strong> Older Americans each reflect a<br />
physical parameter of functional fitness<br />
<strong>and</strong> activities of daily living. For two<br />
tasks—Sit <strong>and</strong> Reach <strong>and</strong> Back<br />
Scratch—participants scored 0 if<br />
they were able to reach their toes or<br />
touch their fingertips of both h<strong>and</strong>s.<br />
Reaching past these points resulted<br />
in a positive score while not being<br />
able to reach these points resulted<br />
in a negative score.<br />
The tests included in this battery are<br />
based on the guidelines established<br />
by the American College of Sports<br />
Medicine (Roitman, 2001) <strong>and</strong> are<br />
safe <strong>for</strong> most community-dwelling<br />
older adults to per<strong>for</strong>m without<br />
receiving prior medical screening;<br />
however, we did not use the 6-minute<br />
walk test because of concerns about<br />
obtaining approval from the institutional<br />
review boards <strong>and</strong> because of<br />
Table 1. Self-reported general health status of older adults 1 in Georgia<br />
Question description Pre-test Post-test<br />
Percent<br />
Would you say that in general your health is:<br />
Excellent 6 8<br />
Very good 18 20<br />
Good 44 43<br />
Fair 28 25<br />
Poor 4 4<br />
How much do your health troubles st<strong>and</strong> in your way<br />
(of doing things)?<br />
Not at all 36 37<br />
A little 48 48<br />
A great deal 16 15<br />
How important is it to your health to be active all or most<br />
days of the week?<br />
Not at all 2 1<br />
Somewhat 16 16<br />
Very 63 61<br />
Extremely 18 22<br />
1 Age 60 or older who received congregate meals provided by the Older Americans <strong>Nutrition</strong> Program.<br />
the lack of space to per<strong>for</strong>m this test at<br />
some senior centers.<br />
Statistical Analysis<br />
We used the Statistical Analysis<br />
System, Version 8.2 (SAS Institute,<br />
2001) to analyze the data. Paired t-tests<br />
<strong>and</strong> chi-squares were used to determine<br />
whether pre- <strong>and</strong> post-test results were<br />
statistically significant (p
Table 2. Fruit <strong>and</strong> vegetable intake, knowledge, <strong>and</strong> behaviors of older adults 1 in<br />
Georgia<br />
Question description Pre-test Post-test<br />
Mean<br />
How often did you drink fruit juices such as<br />
orange, grapefruit, or tomato? (servings/day) 0.91 0.96<br />
Not counting juice, how often did you eat fruit?<br />
(servings/day) 1.06 1.09<br />
How often did you eat green salad? (servings/day) 0.43 0.39<br />
How often did you eat potatoes, not including french fries,<br />
fried potatoes, or potato chips? (servings/day) 0.37 0.36<br />
How often did you eat carrots? (servings/day) 0.35 0.32<br />
Not counting carrots, potatoes, or salad, how many<br />
servings of vegetables did you usually eat? (servings/day)* 1.63 1.78<br />
These participants also reported<br />
an increase in behaviors that<br />
reduce the risk of developing<br />
heart disease or stroke. For<br />
example, the percentage of older<br />
adults eating fewer high-fat or<br />
high-cholesterol foods improved<br />
from 74 at the pre-test to 85<br />
percent at the post-test.<br />
Total fruit <strong>and</strong> vegetable intake (servings/day) 4.73 4.83<br />
Percent<br />
How are your vegetables usually prepared?<br />
Fried 2 3<br />
Steamed/boiled 96 95<br />
Uncooked/raw 2 2<br />
Consume 5 or more servings of fruits <strong>and</strong> vegetables per day 37 37<br />
How many servings of fruits <strong>and</strong> vegetables should<br />
people eat each day?*<br />
0 0 0<br />
1 14 4<br />
2 21 9<br />
3 22 16<br />
4 9 6<br />
5 or more (correct answer) 34 64<br />
1 Age 60 or older who received congregate meals provided by the Older Americans <strong>Nutrition</strong> Program.<br />
* Difference between pre-test <strong>and</strong> post-test is significant at p < 0.05.<br />
of vegetables—not including carrots,<br />
potatoes, or salad (which were included<br />
in other questions)—increased from<br />
1.63 to 1.78. Whereas total mean<br />
intake of fruits <strong>and</strong> vegetables <strong>and</strong> the<br />
percentage of people who consumed<br />
5 or more servings per day did not<br />
increase significantly over the period,<br />
knowledge that 5 or more servings<br />
of fruits <strong>and</strong> vegetables should be<br />
consumed each day did increase<br />
significantly: from 34 to 64 percent.<br />
Usual cooking methods <strong>for</strong> vegetables<br />
did not change significantly, with<br />
steaming/boiling being the method of<br />
choice by 96 percent at the pre-test<br />
<strong>and</strong> 95 percent at the post-test.<br />
From the pre-test to the post-test,<br />
participants’ knowledge <strong>and</strong> behaviors<br />
regarding dietary fat changed, as<br />
measured by six of the seven questions.<br />
2003 Vol. 15 No. 1 51
Mean daily milk consumption improved<br />
significantly (1.29 vs. 1.37<br />
cups/day) from the pre-test to the posttest<br />
phase. The type of milk consumed<br />
improved, although not significantly:<br />
66 percent of participants drank 2%,<br />
0.5-1%, or skim milk at pre-test versus<br />
73 percent at the post-test (table 3).<br />
These participants also reported an<br />
increase in behaviors that reduce the<br />
risk of developing heart disease or<br />
stroke. For example, the percentage<br />
of older adults eating fewer high-fat or<br />
high-cholesterol foods improved from<br />
74 at the pre-test to 85 percent at the<br />
post-test. Knowledge regarding fat<br />
<strong>and</strong> heart disease improved. At the<br />
pre-test, 55 percent of the participants<br />
knew that saturated fat increases risk<br />
of heart disease. At the post-test,<br />
77 percent knew this to be the case.<br />
Participants, as well, reported exercising<br />
more (73 vs. 86 percent) from the<br />
pre-test to the post-test.<br />
A significant change was also seen in<br />
the methods participants used to cook<br />
meat, chicken, or fish. More people<br />
switched from frying to broiling <strong>and</strong><br />
baking. Twenty percent of the participants<br />
fried their meat, chicken, or fish<br />
at the time of the pre-test; 3 percent<br />
broiled <strong>and</strong> baked these items. At the<br />
post-test, 17 percent fried these foods,<br />
while 8 percent chose broiling <strong>and</strong><br />
baking instead. The percentage of<br />
participants who read nutrition labels<br />
increased, as well: moving from 58 to<br />
66 percent.<br />
Many dimensions of physical activity<br />
among the elderly participants improved<br />
significantly between the pre<strong>and</strong><br />
post-test phases of the study (table<br />
4). Participants who engaged in any<br />
type of physical activity in the past<br />
month increased from 82 to 87 percent,<br />
<strong>and</strong> those who per<strong>for</strong>med leg exercises<br />
in the last week or last month increased<br />
from 55 to 82 percent <strong>and</strong> 54 to 88<br />
percent, respectively. Not only did<br />
Table 3. Dietary fat knowledge <strong>and</strong> behaviors of older adults 1 in Georgia<br />
Question description Pre-test Post-test<br />
Percent (mean)<br />
On average, how much milk do you usually drink each day?<br />
0 cups 17 14<br />
1 47 48<br />
2 26 27<br />
3 or more 10 12<br />
Mean* (1.29) (1.37)<br />
What type of milk do you usually drink?<br />
Don’t drink milk 11 7<br />
Whole 23 21<br />
2% 42 47<br />
0.5-1% 6 8<br />
Skim 18 18<br />
To lower your risk of developing heart disease or stroke,<br />
are you eating fewer high-fat or high-cholesterol foods?*<br />
Yes 74 85<br />
No 18 11<br />
Don’t know 8 4<br />
What kind of fat increases the risk of heart disease?*<br />
Saturated fat 55 77<br />
Unsaturated fat 8 5<br />
Don’t know 37 17<br />
To lower your risk of developing heart disease or stroke,<br />
are you exercising more?*<br />
Yes 73 86<br />
No 27 14<br />
How is your meat, chicken, or fish usually prepared?*<br />
Fried 20 17<br />
Broiled/grilled 36 36<br />
Baked 41 39<br />
Broiled <strong>and</strong> baked 3 8<br />
I read the nutrition labels on food packages be<strong>for</strong>e I buy.*<br />
No 42 34<br />
Yes 58 66<br />
1 Age 60 or older who received congregate meals provided by the Older Americans <strong>Nutrition</strong> Program.<br />
* Difference between pre-test <strong>and</strong> post-test is significant at p < 0.05.<br />
activity increase, so did elders’<br />
knowledge about physical activity.<br />
After the intervention, significantly<br />
more of the participants knew that 30<br />
minutes of physical activity should be<br />
done most days of the week: 53 versus<br />
68 percent. Participants who reported<br />
being active most days of the week also<br />
increased from 80 to 88 percent. In<br />
addition, higher percentages of elders<br />
disagreed that they did not have time to<br />
be active most days, did not like being<br />
physically active, <strong>and</strong> believed it was<br />
not safe to be physically active.<br />
52 Family Economics <strong>and</strong> <strong>Nutrition</strong> Review
Many of the participants’ per<strong>for</strong>mance<br />
on the fitness batteries improved<br />
significantly after the intervention.<br />
The mean score of the short-battery<br />
<strong>for</strong>m of the Established Populations<br />
<strong>for</strong> Epidemiologic Studies of the<br />
<strong>Elderly</strong> improved significantly (8.0<br />
to 8.3), with more participants moving<br />
toward the higher end of the functional<br />
spectrum. The percentage of participants<br />
in the low category of the shortbattery<br />
test remained the same at 17<br />
percent (pre- <strong>and</strong> post-test), while the<br />
average category decreased from 51<br />
to 41 percent <strong>and</strong> the high category<br />
increased from 32 to 42 percent. The<br />
per<strong>for</strong>mance on all measures of the<br />
Fullerton Functional Fitness Test<br />
improved significantly.<br />
Discussion<br />
“Take Charge of Your Health <strong>for</strong><br />
Older Adults”—a nutrition <strong>and</strong> health<br />
promotion program <strong>for</strong> older adults in<br />
Georgia—proved to be successful, with<br />
major outcomes that included positive<br />
changes in knowledge related to nutrition<br />
<strong>and</strong> physical activity, improvements<br />
in some health behaviors related<br />
to diet <strong>and</strong> physical activity, <strong>and</strong><br />
decreases in possible barriers to<br />
physical activity.<br />
Each of the three key areas of the<br />
“Take Charge of Your Health <strong>for</strong><br />
Older Adults” campaign message—<br />
Take 5 a Day, Take Down Fat, <strong>and</strong><br />
Take Action—improved significantly,<br />
especially the participants’ knowledge<br />
of health-promoting behaviors. Although<br />
knowledge of appropriate<br />
health behaviors helps improve healthrelated<br />
behavior, skill development<br />
<strong>and</strong> instructional knowledge are almost<br />
always necessary to produce behavior<br />
changes (Krinke, 2001).<br />
While there were gains in knowledge,<br />
not all of these resulted in corresponding<br />
improvements in behavior. For<br />
example, although fruit <strong>and</strong> vegetable<br />
knowledge improved markedly, this<br />
improvement resulted in a significant<br />
increase in self-reported intake of<br />
vegetables (excluding carrots, potatoes,<br />
<strong>and</strong> salad) only—just one of the<br />
questions related to fruit <strong>and</strong> vegetable<br />
intake. Other researchers have reported<br />
similar changes in fruit <strong>and</strong> vegetable<br />
intake following community-based<br />
interventions (Ciliska et al., 2000).<br />
Cohen <strong>and</strong> colleagues (1998) found an<br />
inverse relationship between perceived<br />
barriers to fruit <strong>and</strong> vegetable intake<br />
<strong>and</strong> income <strong>and</strong> education, the result of<br />
which was lower consumption of fruits<br />
<strong>and</strong> vegetables. The results of our<br />
evaluation highlight the need <strong>for</strong><br />
future programs to target <strong>and</strong> address<br />
the perceived barriers to fruit <strong>and</strong><br />
vegetable intake in this population.<br />
Increases in knowledge about the types<br />
of fat <strong>and</strong> the need to decrease dietary<br />
fat intake resulted in improved dietary<br />
behaviors. Our findings are similar to<br />
those reported in other samples. For<br />
example, Goldberg <strong>and</strong> colleagues<br />
(1990) found that many older adults<br />
reported making modifications in their<br />
diet to reduce risk factors associated<br />
with chronic diseases. Others also<br />
reported improved intake in targeted<br />
foods, such as lowfat dairy foods <strong>and</strong><br />
fruits <strong>and</strong> vegetables, after participation<br />
in an educational community<br />
gardening project (Hackman &<br />
Wagner, 1990).<br />
This intervention was successful in<br />
addressing <strong>and</strong> dispelling some of the<br />
myths <strong>and</strong> misconceptions associated<br />
with perceptions of three barriers to<br />
physical activity—time constraints,<br />
not liking to be active, <strong>and</strong> safety<br />
concerns—which led to a significant<br />
increase in the percentage of participants<br />
who reported being active on<br />
most days of the week. King (2001)<br />
suggests that effective interactions<br />
<strong>for</strong> promoting regular physical activity<br />
by older adults are dependent on<br />
Many dimensions of physical<br />
activity among the elderly<br />
participants improved<br />
significantly between the<br />
pre- <strong>and</strong> post-test phases<br />
of the study.<br />
2003 Vol. 15 No. 1 53
underst<strong>and</strong>ing the factors that influence<br />
activity <strong>and</strong> then taking steps to<br />
address them. Per<strong>for</strong>mance scores <strong>for</strong><br />
functional ability on the test battery<br />
of the Established Populations <strong>for</strong><br />
Epidemiologic Studies of the <strong>Elderly</strong><br />
improved significantly. Poor per<strong>for</strong>mance<br />
on this test battery has been<br />
associated with greater self-reported<br />
disability. Scores below 5 have<br />
predicted placement in nursing homes<br />
<strong>and</strong> mortality (Guralink et al., 1994).<br />
The mean score of 8 <strong>for</strong> the participants<br />
of this study indicates that the<br />
older adults in the program are on the<br />
verge of losing their independence.<br />
Interventions that improve physical<br />
function, such as “Take Charge of Your<br />
Health <strong>for</strong> Older Adults,” may prolong<br />
independence in a group that is clearly<br />
at risk. There<strong>for</strong>e, the continued use of<br />
this test battery may provide valuable<br />
in<strong>for</strong>mation concerning changes in the<br />
functional status of this population.<br />
This study had some limitations. First,<br />
self-reported dietary intake is difficult<br />
to assess in this population because<br />
of factors such as low literacy <strong>and</strong><br />
education levels, low socioeconomic<br />
status, age-related declines in sensory<br />
functions such as hearing <strong>and</strong> sight,<br />
<strong>and</strong> possible declines in memory <strong>and</strong><br />
cognitive functioning. While ef<strong>for</strong>ts<br />
were made to modify the curriculum<br />
to meet the varying educational levels<br />
of participants, further adaptations<br />
remain necessary to facilitate the<br />
most effective teaching <strong>and</strong> learning<br />
methods <strong>for</strong> this population. Second,<br />
coordinating a large statewide program<br />
with numerous people who possess<br />
varied experience in applied research<br />
settings may have affected data<br />
collection. Providing training in data<br />
collection methods <strong>for</strong> staff at all sites<br />
involved in the intervention minimized<br />
this potential limitation. The educators<br />
consisted mainly of Area Agency on<br />
Aging staff, including registered<br />
dietitians, nurses, county Extension<br />
agents, fitness instructors <strong>and</strong> health<br />
Table 4. Physical activity, knowledge, behaviors, <strong>and</strong> fitness of older adults 1 in<br />
Georgia<br />
Question description Pre-test Post-test<br />
Percent<br />
How many blocks can you walk without stopping?<br />
(1 block = 1/8 mile)<br />
0 11 10<br />
1 22 20<br />
2 15 15<br />
3 11 12<br />
4 or more blocks 41 44<br />
During the past month, did you participate in any physical<br />
activities or exercises such as running, calisthenics, golf,<br />
gardening, or walking <strong>for</strong> exercise?*<br />
No 18 13<br />
Yes 82 87<br />
During the past week, did you do leg exercises<br />
(as shown in this picture)?*<br />
No 45 18<br />
Yes 55 82<br />
During the past month, did you do leg exercises<br />
(as shown in this picture)?<br />
No 46 12<br />
Yes 54 88<br />
How much physical activity should people do most days<br />
of the week? (minutes)*<br />
1-5 3 3<br />
6-10 8 5<br />
11-15 14 7<br />
16-20 15 10<br />
21-25 6 4<br />
26-29 1 2<br />
30 or more (correct answer) 53 68<br />
Do any of the following keep you from being active on all<br />
or most days of the week?<br />
I already am active on all or most days of the week.*<br />
No 20 12<br />
Yes 80 88<br />
I have a health condition that keeps me from being active.<br />
No 72 77<br />
Yes 28 23<br />
It costs too much.<br />
No 99 98<br />
Yes 1 2<br />
I don’t have time.*<br />
No 84 95<br />
Yes 16 5<br />
54 Family Economics <strong>and</strong> <strong>Nutrition</strong> Review
Table 4. Physical activity, knowledge, behaviors, <strong>and</strong> fitness of older adults 1 in<br />
Georgia (cont’d)<br />
Question description Pre-test Post-test<br />
Percent<br />
I don’t like to.*<br />
No 82 91<br />
Yes 18 9<br />
It’s too late to improve my health.<br />
No 97 97<br />
Yes 3 3<br />
It’s not safe.*<br />
No 85 95<br />
Yes 15 5<br />
EPESE 2 functional category scores 3<br />
Category 1 (low: 0 to 5) 17 17<br />
Category 2 (average: 6 to 9) 51 42<br />
Category 3 (high: 10 to 12) 32 41<br />
Mean<br />
EPESE summary score* 8.0 8.3<br />
Fullerton Functional Fitness Test<br />
Chair st<strong>and</strong>s (number in 30 seconds)* 10.8 11.3<br />
Arm curls (number in 30 seconds)* 13.9 15.9<br />
Sit-<strong>and</strong>-reach (inches)* 4 -1.3 -0.5<br />
8-foot Up-<strong>and</strong>-Go (seconds)* 9.8 9.1<br />
Back scratch (inches)* 4 -4.8 -3.8<br />
1 Age 60 or older who received congregate meals provided by the Older Americans <strong>Nutrition</strong> Program.<br />
2 Short-battery <strong>for</strong>m of the Established Populations <strong>for</strong> Epidemiologic Studies of the <strong>Elderly</strong> (EPESE).<br />
3 Scores relate to elders’ mobility in terms of balance, strength, <strong>and</strong> gait speed while per<strong>for</strong>ming certain tasks.<br />
4 Scoring: Zero: reaching toes or touching fingertips of both h<strong>and</strong>s, positive score: reaching beyond these<br />
points, <strong>and</strong> negative score: not being able to reach these points.<br />
* Difference between pre-test <strong>and</strong> post-test is significant at p < 0.05.<br />
While the program was successful,<br />
improvements can be made in future<br />
interventions, especially in the area of<br />
facilitating behavior changes related<br />
to diet. National public policy, such as<br />
Healthy People 2010, has emphasized<br />
the role of nutrition education <strong>and</strong><br />
physical activity in maintaining health<br />
in people of all ages (DHHS, 2000).<br />
There<strong>for</strong>e effective nutrition education<br />
<strong>and</strong> physical activity intervention<br />
strategies are essential <strong>for</strong> improving<br />
health, nutrition, <strong>and</strong> functional ability<br />
in the older population. These reasons,<br />
in combination with the documented<br />
success of this program, support the<br />
continuation <strong>and</strong> expansion of nutrition<br />
education <strong>and</strong> physical activity<br />
intervention programs to other<br />
older adults.<br />
Acknowledgments<br />
This study was funded by the Georgia<br />
Department of Human Resources-<br />
<strong>US</strong>DA Food Stamp <strong>Nutrition</strong> Education<br />
Program (Contracts #427-93-<br />
11903 <strong>and</strong> 427-93-26056), Northeast<br />
Georgia Regional Development <strong>Center</strong><br />
<strong>and</strong> Area Agency on Aging, <strong>and</strong><br />
Georgia Agricultural Experiment<br />
Station (Hatch #GEO-00916).<br />
educators, as well as senior center<br />
directors. However, not all of the<br />
educators may have had <strong>for</strong>mal training<br />
in both nutrition <strong>and</strong> physical activity.<br />
An ef<strong>for</strong>t was made to minimize this<br />
potential barrier by providing training<br />
on the use of the curriculum. Also,<br />
professional staff from the Division<br />
of Aging Services, the University of<br />
Georgia’s Department of Foods <strong>and</strong><br />
<strong>Nutrition</strong>, <strong>and</strong> Wellness, Inc., were<br />
available to answer questions. Third,<br />
this was the first statewide attempt to<br />
evaluate functional status with direct<br />
measures by using well-validated<br />
methods designed specifically <strong>for</strong><br />
assessment of older adults, measures<br />
such as the Fullerton Functional Fitness<br />
Test <strong>for</strong> Older Adults (Rikli & Jones,<br />
1999) <strong>and</strong> the short-battery <strong>for</strong>m of<br />
the Established Populations <strong>for</strong><br />
Epidemiologic Studies of the <strong>Elderly</strong><br />
(Guralink et al., 1994). In the future,<br />
additional training should be conducted<br />
be<strong>for</strong>e these measures are used in<br />
combination: 15.8 percent of the data<br />
<strong>for</strong> the 8-foot-Up-<strong>and</strong>-Go <strong>and</strong> <strong>for</strong> the<br />
8-foot walk were eliminated because<br />
of concerns about reliability.<br />
2003 Vol. 15 No. 1 55
References<br />
Accettura, N. (2000). Micronutrient Intervention in <strong>Elderly</strong> <strong>Nutrition</strong> Programs.<br />
Masters Thesis, The University of Georgia, Athens, GA.<br />
Aspinwall, E.A. (2001). Serum Carotenoid Concentrations <strong>and</strong> Fruit <strong>and</strong><br />
Vegetable Intakes Among Participants in Northeast Georgia’s <strong>Elderly</strong> <strong>Nutrition</strong><br />
Program. Masters Thesis, The University of Georgia, Athens, GA.<br />
Brackett, W.R.H. (1999). <strong>Nutrition</strong>al Status of Participants of Northeast Georgia<br />
Senior <strong>Nutrition</strong> <strong>Center</strong>s. Masters Thesis , The University of Georgia, Athens, GA.<br />
<strong>Center</strong>s <strong>for</strong> Disease Control <strong>and</strong> Prevention. Behavioral Risk Factor Surveillance<br />
System, 1998 Survey Data. Atlanta, Georgia: U.S. Department of Health <strong>and</strong><br />
Human Services, <strong>Center</strong>s <strong>for</strong> Disease Control <strong>and</strong> Prevention. Retrived April<br />
2001, from www.cdc.gov/brfss/index.htm.<br />
<strong>Center</strong>s <strong>for</strong> Disease Control <strong>and</strong> Prevention. Behavioral Risk Factor Surveillance<br />
System, 1999 Survey Data. Atlanta, Georgia: U.S. Department of Health <strong>and</strong><br />
Human Services, <strong>Center</strong>s <strong>for</strong> Disease Control <strong>and</strong> Prevention. Retrived April<br />
2001, from www.cdc.gov/brfss/index.htm.<br />
Ciliska, D., Miles, E., O’Brien, M.A., Turl, C., Tomasik, H.H., Donovan, U., et al.<br />
(2000). Effectiveness of community-based interventions to increase fruit <strong>and</strong><br />
vegetable consumption. Journal of <strong>Nutrition</strong> Education, 32, 342-352.<br />
Cohen, N.L., Stoddard, A.M., Sarouhkhanianss, S., & Sorenson, G. (1998).<br />
Barriers toward fruit <strong>and</strong> vegetable consumption in a multisite ethnic worksite<br />
population. Journal of <strong>Nutrition</strong> Education, 30, 381-386.<br />
Elbon, S. (1998). The Influence of Individual, Food, <strong>and</strong> Environmental<br />
Characteristics on Dairy Product Consumption in the <strong>Elderly</strong>. Doctoral<br />
Dissertation, The University of Georgia, Athens, GA.<br />
Georgia Coalition <strong>for</strong> Physical Activity <strong>and</strong> <strong>Nutrition</strong>. (2002). Retrieved March<br />
25, 2002, from http://www.g-pan.org.<br />
Georgia Department of Human Resources, Division of Aging Services. (2002).<br />
DHR Office of Communications Fact Sheet. Retrieved June 25, 2002, from http://<br />
www2.state.ga.us/Departments/DHR/facage2.html.<br />
Goldberg, J.P., Gershoff, S.N., & McGr<strong>and</strong>y, R.B. (1990). Appropriate topics <strong>for</strong><br />
nutrition education <strong>for</strong> the elderly. Journal of <strong>Nutrition</strong> Education, 22, 303-310.<br />
Guralnik, J.M., Simonsick, E.M., Ferrucci, L., Glynn, R.J., Berkman, L.F., Blazer,<br />
D.G., et al. (1994). A short physical per<strong>for</strong>mance battery assessing lower<br />
extremity function: Association with self-reported disability <strong>and</strong> prediction of<br />
mortality <strong>and</strong> nursing home admission. Journal of Gerontology: Series A, 49(2),<br />
85-94.<br />
56 Family Economics <strong>and</strong> <strong>Nutrition</strong> Review
Hackman, R.M., & Wagner, E.L. (1990). The senior gardening <strong>and</strong> nutrition<br />
project: Development <strong>and</strong> transportation of a dietary behavior change <strong>and</strong> health<br />
promotion program. Journal of <strong>Nutrition</strong> Education, 22, 262-270.<br />
King, A.C. (2001). Interventions to promote physical activity by older adults.<br />
Journal of Gerontology:Series A, Vol. 56A(Special Issue II), 36-46.<br />
Krinke, U.B. (2001). Effective nutrition education strategies to reach older adults.<br />
In R.R. Watson (Ed.), The H<strong>and</strong>book of <strong>Nutrition</strong> in the Aged, Boca Raton, FL:<br />
CRC Press.<br />
Millen, B.E., Ohls, J.C., Ponza, M., & McCool, A.C. (2002). The <strong>Elderly</strong><br />
<strong>Nutrition</strong> Program: An effective national framework <strong>for</strong> preventive nutrition<br />
interventions. Journal of the American Dietetic Association, 102, 234-240.<br />
National Institute on Aging, National Institutes of Health. (2001). Exercise: A<br />
Guide from the National Institute on Aging. Publication No. NIH 99-4258.<br />
<strong>Nutrition</strong> Screening Initiative. (1991). <strong>Nutrition</strong> Screening Manual <strong>for</strong><br />
Professionals Caring <strong>for</strong> Older Americans. Washington, DC.<br />
Ponza, M., Ohls, J.C., & Millen, B.E. (1996). Serving Elders at Risk. The Older<br />
Americans Act <strong>Nutrition</strong> Programs. National Evaluation of the <strong>Elderly</strong> <strong>Nutrition</strong><br />
Program, 1993-1995, Executive Summary. Princeton, NJ: Mathematica <strong>Policy</strong><br />
Research.<br />
Rikli, R.E., & Jones, C.J. (1999). Development <strong>and</strong> validation of a functional<br />
fitness test <strong>for</strong> community-residing older adults. Journal of Aging <strong>and</strong> Physical<br />
Activity, 7, 129-161.<br />
Roitman, J.L. (Ed.). (2001). ACSM’s Resource Manual <strong>for</strong> Guidelines <strong>for</strong><br />
Exercise Testing <strong>and</strong> Prescription, (4th ed.). Philadelphia, PA: Lippincott<br />
Williams & Wilkens.<br />
SAS Institute, Inc. (2001). Version 8.2. Cary, NC.<br />
U.S. Department of Agriculture, <strong>Center</strong> <strong>for</strong> <strong>Nutrition</strong> <strong>Policy</strong> <strong>and</strong> <strong>Promotion</strong>.<br />
(1996). The Food Guide Pyramid. Home <strong>and</strong> Garden Bulletin No. 252.<br />
U.S. Department of Agriculture, & U.S. Department of Health <strong>and</strong> Human<br />
Services. (2000). <strong>Nutrition</strong> <strong>and</strong> Your Health: Dietary Guidelines <strong>for</strong> Americans,<br />
(5th ed.). Home <strong>and</strong> Garden Bulletin No. 232.<br />
U.S. Department of Health <strong>and</strong> Human Services. (1996). Physical Activity <strong>and</strong><br />
Health: A Report of the Surgeon General: Executive Summary.<br />
U.S. Department of Health <strong>and</strong> Human Services. (2000). Healthy People 2010,<br />
(2nd ed., 2 vols.). Washington, DC: U.S. Government Printing Office.<br />
2003 Vol. 15 No. 1 57
Estimation of Portion Sizes<br />
by <strong>Elderly</strong> Respondents<br />
S<strong>and</strong>ria Godwin, PhD, RD<br />
Tennessee State University<br />
Edgar Chambers IV, PhD<br />
Kansas State University<br />
This two-phase study assessed the cognitive strategies used by the elderly<br />
(individuals 65 years of age <strong>and</strong> older) <strong>and</strong> the accuracy of their estimates of<br />
reported dietary intake. In phase I of the study, we conducted interviews with<br />
118 elderly respondents who were asked to “think aloud” while estimating the<br />
portion size of solid, liquid, <strong>and</strong> amorphous (i.e., nonspecific) foods they had<br />
eaten the previous day. Respondents were given one of four sets of estimation<br />
aids, although most chose not to use these <strong>and</strong> appeared confident in estimating<br />
amounts. In phase II, 90 different elderly participants ate lunch at a university<br />
facility. Food items were pre-weighed or measured be<strong>for</strong>e being served, <strong>and</strong><br />
amounts consumed were calculated after each meal. The following day,<br />
researchers interviewed participants by using one of three r<strong>and</strong>omly assigned<br />
methods: by telephone with mostly 2-dimensional aids, by telephone without aids,<br />
or in person with 3-dimensional aids. Participants were asked to recall what they<br />
had eaten at the meal <strong>and</strong> to estimate the amount eaten. Findings from phase I<br />
suggested that elderly respondents generally chose not to use an aid to estimate<br />
portion sizes. For most foods consumed in phase II, those participants who used<br />
an aid did not have reduced estimation errors, because these commonly exceeded<br />
±25 percent.<br />
A<br />
n underst<strong>and</strong>ing of food<br />
consumption <strong>and</strong> the challenges<br />
associated with changing<br />
consumption patterns are critical to<br />
improving human health <strong>and</strong> wellbeing.<br />
One barrier to underst<strong>and</strong>ing<br />
consumption is the difficulty in<br />
measuring what people eat. Dietary<br />
recall studies, such as the National<br />
Health <strong>and</strong> <strong>Nutrition</strong> Examination<br />
Survey (NHANES) <strong>and</strong> the Continuing<br />
Survey of Food Intakes by Individuals<br />
(CSFII), have been used extensively<br />
(Thompson & Byers, 1994) to estimate<br />
food consumption <strong>and</strong> to give insight<br />
into dietary inadequacies. However,<br />
some nutrition researchers have<br />
questioned the accuracy <strong>and</strong> validity<br />
of portion-size estimation to quantify<br />
dietary intake (e.g., Cypel, Guenther, &<br />
Petot, 1997). It is important that dietary<br />
data such as portion-size estimation be<br />
as accurate as possible (McGuire,<br />
Chambers, Godwin, & Brenner, 2001;<br />
Mertz, 1992; Young & Nestle, 1995).<br />
Other authors have suggested that the<br />
accuracy of in<strong>for</strong>mation obtained from<br />
older respondents may be lower than<br />
that obtained from younger ones<br />
(Taylor-Davis & Smiciklas-Wright,<br />
1993). If this is true, the data used to<br />
determine the critical diet-related issues<br />
facing the elderly population may be<br />
less accurate than desired. This is of<br />
added importance because the proportion<br />
of elderly in the population is<br />
rising annually (U.S. Bureau of the<br />
Census, 1994).<br />
Dietary recall places substantial<br />
cognitive dem<strong>and</strong>s on the respondent—<br />
requiring an in-depth search of<br />
memory, estimation, <strong>and</strong> judgment<br />
skills (Baranowski & Domel, 1994;<br />
Fries, Green, & Bowen, 1995). Until<br />
recently, little has been known about<br />
58 Family Economics <strong>and</strong> <strong>Nutrition</strong> Review
these cognitive dem<strong>and</strong>s (Buzzard &<br />
Sievert, 1994). Hence, the National<br />
<strong>Center</strong> <strong>for</strong> Health Statistics (NCHS)<br />
has cited the need <strong>for</strong> additional<br />
research in this area (U.S. <strong>Center</strong>s<br />
<strong>for</strong> Disease Control, 1994). A better<br />
underst<strong>and</strong>ing of cognitive strategies<br />
(i.e., the ways in which people access<br />
<strong>and</strong> recall in<strong>for</strong>mation) used during<br />
the recall process could help to design<br />
survey questions <strong>and</strong> interview<br />
procedures—<strong>and</strong> improve recall.<br />
These strategies, however, are not<br />
well understood, especially in older<br />
population groups. Recent in<strong>for</strong>mation<br />
suggests that adults age 18 to 65 use<br />
various cognitive strategies when<br />
recalling portion sizes of foods eaten<br />
the previous day (Chambers, Godwin,<br />
& Vecchio, 2000). Underst<strong>and</strong>ing the<br />
cognitive strategies <strong>for</strong> estimating<br />
portion size is important in<strong>for</strong>mation<br />
to have when developing effective<br />
estimation methods <strong>for</strong> procedures<br />
such as the 24-hour dietary recall,<br />
a technique used in many nutrition<br />
studies. Currently, there is little in<strong>for</strong>mation<br />
about the cognitive strategies<br />
used by the elderly <strong>and</strong> how accurately<br />
they estimate portion sizes.<br />
It is unclear whether using aids to help<br />
respondents estimate portion sizes<br />
increases accuracy <strong>for</strong> the elderly.<br />
Although these aids have the potential<br />
to provide an accurate, convenient<br />
means of estimating food portions,<br />
some research has indicated the<br />
accuracy of estimations may not<br />
improve with certain foods when aids<br />
are used (Godwin et al., 2001). The<br />
purpose of this research, there<strong>for</strong>e, was<br />
to gain a better underst<strong>and</strong>ing of the<br />
process that elderly respondents use to<br />
estimate portion sizes <strong>and</strong> to determine<br />
if aids used to estimate portion sizes<br />
improve these respondents’ accuracy<br />
in saying how much they had eaten.<br />
Methods<br />
Phase I<br />
Four highly trained interviewers<br />
conducted one-on-one interviews with<br />
118 respondents age 65 years or older.<br />
Respondents were recruited from existing<br />
consumer-testing databases; by<br />
referral from associates; <strong>and</strong> through<br />
advertisements posted in health<br />
departments, churches, schools, <strong>and</strong><br />
businesses. Of the 118 respondents,<br />
75 percent were women; 65 percent<br />
were White, 32 percent were Black,<br />
<strong>and</strong> 3 percent were of other racial<br />
origins.<br />
Because strategies <strong>for</strong> estimating<br />
portion size could be affected by the<br />
aids shown to participants, four sets of<br />
aids were used, with about 30 respondents<br />
assigned to each specific set.<br />
The aids represented various 2- <strong>and</strong> 3-<br />
dimensional aids <strong>for</strong> estimating portion<br />
sizes that have been used in the CSFII<br />
<strong>and</strong> NHANES studies as well as new<br />
aids that have been available to<br />
nutritionists, such as a book of photographs<br />
of portion sizes (Hess, 1997).<br />
The first set consisted primarily of<br />
2-dimensional aids in a booklet that<br />
included full-size drawings of bowls,<br />
cups, plates, <strong>and</strong> glasses; three diagrams<br />
of geometric shapes—a muffinshaped<br />
grid, cylindrical diagram, <strong>and</strong><br />
circles; <strong>and</strong> a tool <strong>for</strong> estimating<br />
portions of wedges. Actual measuring<br />
cups <strong>and</strong> spoons <strong>and</strong> a ruler also were<br />
included.<br />
The second set included mostly<br />
3-dimensional aids such as actual<br />
bowls, cups, plates, glasses, measuring<br />
cups <strong>and</strong> spoons, bean bags in four<br />
sizes, a ruler, <strong>and</strong> sticks <strong>for</strong> estimating<br />
thickness. Also included in this set<br />
were a muffin diagram, the cylindrical<br />
diagram, <strong>and</strong> the tool <strong>for</strong> estimating<br />
portions of wedges. The third set<br />
included photographs (Hess, 1997)<br />
of portions of 35 representative foods<br />
(e.g., cooked mixed vegetables<br />
were used to represent any cooked<br />
vegetable), a ruler, the muffin <strong>and</strong><br />
cylindrical diagrams, the wedge tool,<br />
<strong>and</strong> measuring cups <strong>and</strong> spoons. The<br />
fourth set included photographs (Hess,<br />
1997) of household vessels (e.g., bowls,<br />
cups, plates, <strong>and</strong> glasses), a ruler, the<br />
muffin <strong>and</strong> cylindrical diagrams, the<br />
wedge tool, <strong>and</strong> measuring cups <strong>and</strong><br />
spoons. During interviews, the aids<br />
from one of the four sets were arranged<br />
r<strong>and</strong>omly in front of respondents, to<br />
avoid having the position of the aid<br />
create bias.<br />
We used the respondents’ age, gender,<br />
<strong>and</strong> race to balance their assignment<br />
to a test group of portion-size aids.<br />
Interviewers were trained to use any of<br />
the portion-size aid sets in an interview.<br />
To enable researchers to categorize the<br />
cognitive processes used in remembering<br />
portion sizes, respondents used a<br />
think-aloud process (Ericsson & Simon,<br />
1984) during the interview, with them<br />
verbally describing their strategies <strong>for</strong><br />
deciding how much of each food they<br />
ate. To facilitate the procedure <strong>and</strong> to<br />
help respondents underst<strong>and</strong> the task<br />
<strong>and</strong> become acquainted with the<br />
procedure, we asked each respondent<br />
to complete two practice think-aloud<br />
activities—arranging five cards of<br />
various shapes from smallest to largest<br />
<strong>and</strong> matching colors to shapes. Respondents<br />
were reminded to think aloud if<br />
they were not doing so—to verbalize<br />
everything they were thinking. If a<br />
respondent hesitated, the interviewer<br />
asked nonsuggestive questions that<br />
would help the person describe his<br />
or her thought process.<br />
Procedures <strong>for</strong> the initial dietary interview<br />
were adapted from those used<br />
in the CSFII (Tippett & Cypel, 1998).<br />
The multi-pass approach we used gave<br />
respondents several opportunities to<br />
provide details about the foods they had<br />
consumed. In the first pass, respondents<br />
were asked to recall foods they<br />
2003 Vol. 15 No. 1 59
For the first portion estimation<br />
(without follow-up questions from<br />
the interviewer), respondent use<br />
of the aids was minimal— . . . .<br />
However, the follow-up strategy<br />
<strong>for</strong> elderly respondents was to<br />
use the estimation aids <strong>for</strong><br />
portion sizes.<br />
consumed the previous day. For further<br />
questioning, the interviewer used the<br />
in<strong>for</strong>mation from the first pass to select<br />
at least two foods, if possible, from<br />
three categories (solid shapes such as<br />
steak or cornbread, liquids such as<br />
water or juice, <strong>and</strong> amorphous 1 shapes<br />
such as cooked vegetables or macaroni<br />
<strong>and</strong> cheese). The interviewer then<br />
uncovered <strong>and</strong> introduced the set of<br />
aids assigned to that respondent. The<br />
interviewer showed the respondent<br />
each aid, briefly described its use, <strong>and</strong><br />
in<strong>for</strong>med the respondent that he or she<br />
could use any of the aids during the<br />
interview or could express in any other<br />
way the amounts of food consumed.<br />
In the second pass, the interviewer<br />
asked a series of questions about each<br />
selected food, including the amount<br />
consumed. During or immediately after<br />
the question on the amount consumed,<br />
interviewers used several questions<br />
to help respondents think aloud to<br />
describe how much was eaten. Questions<br />
such as the following were used:<br />
“What were you thinking when you<br />
were remembering the amount you ate/<br />
drank? What made you choose that aid?<br />
I see you picked up an aid, then put it<br />
back down <strong>and</strong> selected another. What<br />
was going through your mind as you<br />
did that?”<br />
Next, the interviewer reviewed the<br />
respondents’ response <strong>for</strong> each food<br />
item consumed <strong>and</strong> followed up with<br />
more specific questions. Cognitive<br />
think-aloud techniques were also used<br />
during this pass when the interviewer<br />
tried to obtain in<strong>for</strong>mation about the<br />
usefulness of various food estimation<br />
aids. If the respondent used an aid, it<br />
was removed by the interviewer, who<br />
then asked the respondent, “If that aid<br />
was not available, was there anything<br />
else that could be used, either another<br />
aid in the set or something else, to help<br />
you describe how much you ate/drank<br />
of the food/drink?” The interviewer<br />
kept the respondent talking about his<br />
or her thoughts <strong>and</strong> the reasons certain<br />
aids were used <strong>and</strong> others were not. In<br />
addition, respondents were asked to<br />
describe other aids that would be<br />
helpful; however, none did.<br />
Data Coding <strong>and</strong> Analysis<br />
Each interviewer recorded the aids<br />
that the respondents used during the<br />
interview to describe the amount of<br />
each food consumed the previous day;<br />
the reviewer also kept notes about<br />
both verbal <strong>and</strong> nonverbal cognitive<br />
strategies used by respondents. Each<br />
interview was audiotaped also. Using<br />
a modified ethnographic approach<br />
(Stewart & Shamdasani, 1990; Morgan,<br />
1990), we developed a list of potential<br />
cognitive strategies or “themes”<br />
after debriefing the interviewers <strong>and</strong><br />
listening to tapes from 10 preliminary<br />
interviews. Those strategies were<br />
compared with the ones described<br />
by Chambers et al. (2000); no new<br />
strategies were found.<br />
Each audiotape of phase I interviews<br />
was replayed <strong>and</strong> compared with the<br />
data recorded by the interviewer.<br />
Cognitive recall strategies were then<br />
classified (table 1) by using the criteria<br />
established by Chambers et al. (2000),<br />
<strong>and</strong> the aids used <strong>for</strong> each food item<br />
were recorded <strong>and</strong> coded <strong>for</strong> summary.<br />
Content analysis was conducted by<br />
counting the responses that fit the<br />
identified strategies. Because qualitative<br />
research generally is perceived to<br />
be more exploratory than quantitative,<br />
the numerical data presented is less<br />
important than the themes that emerge<br />
from the research (Betts, Baranowski,<br />
& Hoerr, 1997).<br />
1 Amorphous foods were semisolid or solid foods<br />
<strong>for</strong> which amounts of the food do not have a<br />
specified shape; consequently, the foods mound<br />
or take the shape of the container.<br />
60 Family Economics <strong>and</strong> <strong>Nutrition</strong> Review
Phase II<br />
In this phase, 90 different participants,<br />
age 65 <strong>and</strong> over, ate lunch from a<br />
limited buffet selection at a university<br />
research facility. Food items, consisting<br />
of roast beef, mashed potatoes, gravy,<br />
green beans, macaroni <strong>and</strong> cheese,<br />
tossed salad, cornbread, cake, iced tea,<br />
<strong>and</strong> appropriate condiments, were preweighed<br />
or measured be<strong>for</strong>e being<br />
served to the participants.<br />
Be<strong>for</strong>e phase II began, actual weight<br />
equivalents <strong>for</strong> measured foods were<br />
determined. Because leftover foods<br />
were measured at room temperature,<br />
weight equivalents <strong>for</strong> hot foods also<br />
were taken at room temperature to<br />
account <strong>for</strong> evaporative losses.<br />
Amounts eaten were calculated after<br />
each meal by weighing leftovers <strong>and</strong><br />
subtracting that amount from the<br />
original or cooled weight.<br />
Participants were interviewed the<br />
day after having consumed lunch at<br />
the facility. During these interviews,<br />
researchers used a similar procedure<br />
to that described in phase I, but without<br />
the cognitive probing. Participants were<br />
asked to recall what they had eaten at<br />
lunch the previous day <strong>and</strong> to estimate<br />
the amounts <strong>and</strong> were then r<strong>and</strong>omly<br />
assigned to one of three interview<br />
groups.<br />
Participants assigned to group A were<br />
interviewed by telephone <strong>and</strong> did not<br />
use portion-size aids to recall the<br />
amounts eaten. Participants assigned to<br />
group B were interviewed by telephone<br />
<strong>and</strong> used aids appropriate <strong>for</strong> that type<br />
of interview. These included a 2-<br />
dimensional food model booklet<br />
(<strong>US</strong>DA, 2001) containing life-size<br />
drawings of glasses, cups, bowls, <strong>and</strong><br />
shapes (e.g., mounds, a wedge tool with<br />
a moveable arm to denote size, <strong>and</strong> a<br />
grid), measuring cups <strong>and</strong> spoons, <strong>and</strong> a<br />
ruler. Participants assigned to group C<br />
were interviewed <strong>and</strong> used aids<br />
Table 1. Strategies elderly respondents used to report portion size<br />
Liquids Solid foods Amorphous foods<br />
Strategy 1 First 2 Follow-up 3 First 2 Follow-up 3 First 2 Follow-up 3<br />
Percent<br />
Known amount purchased 15 0 2 1 3 1<br />
Known amount measured 10 6 0 1 13 5<br />
Estimation based on a known amount 20 8 4 3 5 3<br />
Estimation based on a previous amount 1 0 0 0 3 0<br />
Estimation (guess) 2 4 1 2 2 5<br />
Counting number of items 9 5 28 5 14 5<br />
Visualization of size 0 0 45 24 2 2<br />
Visualization of volume 14 26 2 5 24 21<br />
Visualization of container 19 20 3 7 17 12<br />
Visualization of action 4 10 0 13 12 17 1<br />
Visualization, compare size to aid 5 0 3 1 34 0 1<br />
Visualization, compare volume to aid 5 0 28 1 5 0 34<br />
Visualization, compare container to aid 5 0 0 0 1 0 10<br />
1 Strategies are described by Chambers et al. (2000) <strong>and</strong> were re-evaluated <strong>for</strong> this study during development<br />
of the methods.<br />
2 First strategy identified by respondents without the interviewer probing <strong>for</strong> additional in<strong>for</strong>mation.<br />
3 Follow-up strategy identified by respondents after the interviewer probed <strong>for</strong> additional in<strong>for</strong>mation.<br />
4 Motions used to help determine the number of pieces, scoops, or spoonfuls eaten.<br />
5 Strategies that used a portion-size estimation aid.<br />
appropriate <strong>for</strong> in-person interviews—<br />
mostly 3-dimensional aids such as<br />
glasses, bowls, measuring cups <strong>and</strong><br />
spoons, bean bags, sticks to estimate<br />
thickness, a ruler, the wedge with<br />
moveable arm, <strong>and</strong> size grid. The<br />
participants in groups B <strong>and</strong> C were<br />
guided to aids that they might find<br />
appropriate <strong>for</strong> estimating portion sizes<br />
of foods. For example, participants<br />
were guided to bowls, mounds, <strong>and</strong><br />
measuring cups <strong>for</strong> estimating the<br />
portion size of mashed potatoes. The<br />
groups of aids <strong>for</strong> phase II were determined<br />
based on results from phase I.<br />
Aids that were unused or clearly not<br />
liked by the elderly were eliminated.<br />
Data Analysis<br />
We calculated percentage estimation<br />
errors 2 <strong>and</strong> used procedures outlined<br />
by SAS (2001) to analyze variance<br />
with least significant differences 3 <strong>for</strong><br />
mean percentage estimation error,<br />
frequencies, <strong>and</strong> Pearson correlation<br />
coefficients. Outliers beyond three<br />
st<strong>and</strong>ard deviations of the overall<br />
average <strong>for</strong> a particular food were<br />
not included in analyses <strong>for</strong> mean<br />
percentage estimation error <strong>for</strong> that<br />
food, an important consideration,<br />
because large deviations in a single<br />
respondent’s data could have a major<br />
effect on the mean data <strong>for</strong> that food.<br />
Removal of these outliers resulted in<br />
less than 1 percent of the data being<br />
excluded from the analysis.<br />
2 Percentage estimated errors = ((estimated<br />
weight (g) - measured weight (g))/measured<br />
weight (g)) x 100.<br />
3 General Linear Model <strong>and</strong> Probability of<br />
Difference procedures.<br />
2003 Vol. 15 No. 1 61
For all types of food, average<br />
estimation errors ranged from<br />
–29.9 (no aids <strong>for</strong> cornbread)<br />
to +29.3 percent (3-D aids <strong>for</strong><br />
cake) . . . , indicating that,<br />
depending on the food <strong>and</strong><br />
procedure (e.g., aids or no aids),<br />
portion sizes of foods may be<br />
under- or overestimated.<br />
Results <strong>and</strong> Discussion<br />
Phase I<br />
Respondents used numerous strategies<br />
to assist in recalling the foods they had<br />
eaten <strong>and</strong> in estimating the portion sizes<br />
(table 1). In this study, the methods<br />
used <strong>for</strong> estimation were categorized<br />
into 13 distinct strategies, illustrating<br />
the diversity of cognitive approaches<br />
used to estimate portion size.<br />
For the first portion estimation<br />
(without follow-up questions from the<br />
interviewer), respondent use of the aids<br />
was minimal—using aids to estimate<br />
portion sizes <strong>for</strong> only 2 percent of the<br />
estimations <strong>for</strong> solid foods. Aids were<br />
not used as a first strategy <strong>for</strong> recalling<br />
portions <strong>for</strong> liquids or amorphous<br />
foods. Respondents’ comments during<br />
the interviews indicated that the minimal<br />
use of aids was related to several<br />
factors: extensive food preparation<br />
knowledge, considerable experience<br />
with special diets, or the use of easily<br />
identified portions. Comments were<br />
made such as: “I have cooked all my<br />
life <strong>and</strong> know what ½ cup is,” “I’m<br />
on a special diet <strong>and</strong> used to have to<br />
measure my salad dressing, so I have a<br />
pretty good idea how much to put on,”<br />
<strong>and</strong> “I know I ate half a can of tuna<br />
because I made the tuna salad from<br />
one can <strong>and</strong> ate half yesterday <strong>and</strong><br />
half today.”<br />
These findings are different from those<br />
reported <strong>for</strong> younger respondents in a<br />
study by Chambers et al. (2000). In that<br />
study, younger respondents indicated<br />
that aids used to estimate portion size<br />
represented a good way of reporting<br />
amounts that were hard to describe<br />
without aids. Perhaps, the elderly are<br />
better at estimating portion size because<br />
they are less likely than are younger<br />
Americans to eat away from home<br />
(Wilson et al., 1997). Shatenstein,<br />
Payette, Nadon, <strong>and</strong> Gray-Donald<br />
(2002) suggest that food-related<br />
memory appears to be linked to dietary<br />
knowledge, food preparation experience,<br />
<strong>and</strong> prior acquaintance with the<br />
foods. Collectively, these findings<br />
suggest that, when given the choice,<br />
elderly individuals do not believe they<br />
need to use aids to estimate the portion<br />
size of the foods they have consumed;<br />
whereas, younger individuals think<br />
these aids are helpful in some cases.<br />
For all types of foods, visualization<br />
of portions without use of an aid was<br />
common <strong>for</strong> the initial estimation by<br />
elderly respondents. When interviewers<br />
used probing questions to solicit an<br />
exact portion, the elderly simply gave<br />
amounts such as 16 ounces of iced<br />
tea, 1 cup of green beans, 1 slice of<br />
“br<strong>and</strong> x” cheese or bologna, <strong>and</strong> a<br />
2”x3” “square” of cake. However,<br />
the follow-up strategy <strong>for</strong> elderly<br />
respondents was to use the estimation<br />
aids <strong>for</strong> portion sizes. This suggests that<br />
the use of these aids was com<strong>for</strong>table<br />
<strong>for</strong> most elderly respondents; they just<br />
did not believe they needed one.<br />
For liquids, the strategy used most<br />
commonly <strong>for</strong> determining portion<br />
size was estimation based on known<br />
amount. An example of this strategy<br />
includes the following: “I bought a 12-<br />
ounce can <strong>and</strong> drank half of it.” Almost<br />
half of estimations <strong>for</strong> liquids involved<br />
known amounts either purchased or<br />
measured (25 percent) or estimations<br />
based on known amounts (20 percent)<br />
(e.g., “I used to have to measure how<br />
much water I drink, but now I just<br />
always use the same set of glasses that<br />
I know hold 16 ounces”). Estimations<br />
based on known amounts are good <strong>for</strong><br />
reporting portion size <strong>and</strong> do not<br />
require an aid, but they cannot be used<br />
in many situations where the original<br />
volume is unknown. For the follow-up<br />
estimation, an aid to estimate portion<br />
size was the most popular reporting<br />
strategy used by the elderly respondents<br />
to visualize the amount of foods they<br />
had consumed.<br />
62 Family Economics <strong>and</strong> <strong>Nutrition</strong> Review
Figure. 1. Distributions 1 of percentage errors <strong>for</strong> representative solid foods<br />
Elders’ reports of portion sizes produce mean percentage errors<br />
as high as 29.3 <strong>and</strong> as low as -29.9<br />
1 From bottom to top: The horizontal lines represent the 10th <strong>and</strong> 25th percentiles, mean, <strong>and</strong> 75th<br />
<strong>and</strong> 90th percentiles, respectively. Points represent the 5th <strong>and</strong> 95th percentiles, respectively.<br />
The first strategy <strong>for</strong> reporting the<br />
portion size of solids involved<br />
visualizing the size: 45 percent of all<br />
estimation of solids. This strategy often<br />
involved the respondents using their<br />
h<strong>and</strong>s as a reference <strong>for</strong> estimating the<br />
portion size. Another 28 percent of the<br />
respondents used a counting strategy<br />
(e.g., 1 slice of bread or cheese, 2<br />
“br<strong>and</strong> x” hot dogs, <strong>and</strong> 1 “br<strong>and</strong> x”<br />
biscuit. Although counting also was<br />
used by nonelderly adults in a study by<br />
Chambers <strong>and</strong> colleagues (2000), it<br />
may be more prevalent with elderly<br />
respondents who tended to eat smaller<br />
portions, ate more defined food (i.e.,<br />
fewer mixtures with unknown recipes),<br />
<strong>and</strong> ate pre-portioned food from larger<br />
packages. For the follow-up estimation<br />
<strong>for</strong> solid foods, one in three elderly<br />
respondents chose to use an estimation<br />
aid to assist in visualizing the portion<br />
size of the foods they had consumed.<br />
Usually, those aids were the size grid,<br />
ruler, or the wedge estimation aid—all<br />
of which were used to estimate the<br />
dimensions of the food. This strategy,<br />
using aids to visualize portion sizes,<br />
was similar to that reported <strong>for</strong> younger<br />
adults (Chambers et al., 2000).<br />
For amorphous foods, about one-fourth<br />
(24 percent) of the elderly respondents’<br />
first estimations involved visualizing<br />
the volume <strong>and</strong> another 17 percent<br />
involved visualizing the container.<br />
Respondents who used either of these<br />
two methods then compared the<br />
visualizations with a mental picture of<br />
a measuring utensil (e.g., an image of a<br />
measuring cup) to estimate <strong>and</strong> report<br />
amount. For the follow-up, 34 percent<br />
used one of the available aids such as<br />
a measuring cup or bowl, as a comparison<br />
<strong>for</strong> volume estimation.<br />
The differences in respondents’<br />
strategies between the first <strong>and</strong><br />
follow-up estimations suggest that<br />
the prevalence of aids used by the<br />
elderly to estimate portion sizes may<br />
be dependent on whether a guided<br />
interview is used. Findings suggest that<br />
the elderly might use these aids if<br />
guided to do so. Based on this study,<br />
using aids to estimate portion sizes as<br />
part of an unguided interview may be<br />
ineffective with the elderly because<br />
most of the respondents did not choose<br />
to use them. These respondents stated<br />
that the aids were unnecessary because<br />
they already could estimate the portion<br />
size of the foods they consumed. In<br />
follow-up questions by the interviewers,<br />
elderly participants were more likely to<br />
use a 3-dimensional aid or a grid than a<br />
2-dimensional photograph or drawing.<br />
The elderly in this study particularly<br />
disliked the photographs of food,<br />
because the photographs were of<br />
“representative” foods <strong>and</strong> not<br />
necessarily the food the participant<br />
had consumed. This belief could limit<br />
severely the use of photographs with<br />
elderly respondents, because of the<br />
possible difficulty of having photographs<br />
of every food respondents may<br />
have eaten.<br />
During phase I, we did not determine<br />
whether the elderly were more accurate<br />
when using estimation aids than when<br />
they did not. Because the accuracy of<br />
the estimations associated with using<br />
aids <strong>for</strong> portion estimation is an<br />
important factor in developing the<br />
most effective data collection methods<br />
<strong>for</strong> elderly individuals, we conducted<br />
phase II of this study to determine<br />
accuracy of estimation when various<br />
interview techniques <strong>and</strong> aids to<br />
estimate portion size are used.<br />
Phase II<br />
For all types of food, average estimation<br />
errors ranged from –29.9 (no<br />
aids <strong>for</strong> cornbread) to +29.3 percent<br />
(3-D aids <strong>for</strong> cake) (fig. 1), indicating<br />
that, depending on the food <strong>and</strong><br />
procedure (e.g., aids or no aids),<br />
portion sizes of foods may be underor<br />
overestimated. Individually,<br />
participants had difficulties accurately<br />
estimating portion sizes of each food.<br />
2003 Vol. 15 No. 1 63
Figure. 2. Distributions 1 of percentage errors <strong>for</strong> representative amorphous foods<br />
Elders’ reports of portion sizes produce mean percentage errors<br />
as high as 25.2 <strong>and</strong> as low as -26.7<br />
Overall, the use of either 2- or<br />
3-dimensional aids to help<br />
elderly participants determine<br />
food portion sizes did not<br />
significantly improve the<br />
accuracy of their estimations.<br />
1 From bottom to top: The horizontal lines represent the 10th <strong>and</strong> 25th percentiles, mean, <strong>and</strong> 75th<br />
<strong>and</strong> 90th percentiles, respectively. Points represent the 5th <strong>and</strong> 95th percentiles.<br />
Of the more than 100 individual<br />
estimates of portion sizes reported<br />
in this study, more than 75 percent<br />
exceeded estimation errors of ±20<br />
percent (data not shown). Some<br />
individual estimation errors approached<br />
–100 percent or +200 percent (figs. 1<br />
<strong>and</strong> 2). Average estimation errors<br />
generally were lower <strong>for</strong> the beverages<br />
(data not shown), compared with the<br />
solid <strong>and</strong> the amorphous foods (figs. 1<br />
<strong>and</strong> 2), but the range of response<br />
inaccuracy still was high.<br />
Overall, the use of either 2- or 3-<br />
dimensional aids to help elderly<br />
participants determine food portion<br />
sizes did not significantly improve the<br />
accuracy of their estimations. This<br />
suggests that providing commonly used<br />
aids may not be a particularly effective<br />
method <strong>for</strong> obtaining portion-estimation<br />
in<strong>for</strong>mation from the elderly. In phase I,<br />
elderly respondents chose not to use an<br />
aid to estimate the portion size of the<br />
food they consumed <strong>for</strong> more than<br />
95 percent of the first-interview<br />
estimations. In phase II, their use of<br />
either 2- or 3-dimensional aids did not<br />
consistently increase the accuracy of<br />
their estimations. There<strong>for</strong>e, other<br />
strategies may be necessary <strong>for</strong> the<br />
elderly to estimate portion sizes.<br />
A cautionary note is warranted in the<br />
interpretation of these findings: It is<br />
likely that using a non-home environment<br />
(in this case, a university research<br />
facility) <strong>for</strong> testing affected the portionestimation<br />
strategy used by the<br />
respondents <strong>and</strong> the accuracy of their<br />
estimations. A common strategy used<br />
by the elderly—“known amounts”<br />
based on purchase, preparation, or<br />
measurement—could not be used when<br />
the participants came to the facility<br />
to eat a meal. Because the “known<br />
amounts” strategy may help with<br />
accuracy, results from “at-home”<br />
testing could show greater accuracy.<br />
64 Family Economics <strong>and</strong> <strong>Nutrition</strong> Review
This research did not, however,<br />
investigate that possibility. Further<br />
research that uses in-home testing<br />
will need to be conducted to underst<strong>and</strong><br />
this issue better.<br />
Conclusions<br />
In this research, elderly respondents<br />
used numerous strategies to estimate<br />
portion sizes of the foods they consumed,<br />
but almost all ( more than 95<br />
percent) of the respondents in phase I<br />
chose not to use an aid to help with<br />
that estimation when first asked about<br />
portion size. Guiding participants to<br />
aids increased their use of aids in phase<br />
II but did not consistently increase the<br />
accuracy of their estimations <strong>for</strong> any<br />
type of food consumed. These findings<br />
suggest that <strong>for</strong> elderly respondents,<br />
aids that often have been used to<br />
estimate portion size may not be<br />
needed. To provide greater accuracy,<br />
new techniques <strong>for</strong> portion-size<br />
estimation or new aids may be needed.<br />
The use of alternative techniques,<br />
such as estimations using an exp<strong>and</strong>ed<br />
category scale (e.g., 5- to 10-point<br />
scales <strong>for</strong> small, medium, <strong>and</strong> large),<br />
may be effective <strong>and</strong> is one idea that<br />
needs to be investigated.<br />
Acknowledgments<br />
This project was conducted under<br />
a U.S. Department of Agriculture<br />
capacity-building grant to Tennessee<br />
State University, No. 98-38814-6239.<br />
The authors thank the Food Surveys<br />
Research Group of <strong>US</strong>DA <strong>for</strong> their<br />
comments related to the research <strong>and</strong><br />
the American Dietetic Association <strong>and</strong><br />
Mary Abbott Hess <strong>for</strong> supplying the<br />
book Portion Photos of Popular Foods<br />
<strong>and</strong> giving permission to use it.<br />
References<br />
Baranowski, T., & Domel, S.B. (1994). A cognitive model of children’s reporting<br />
of food intake. American Journal of Clinical <strong>Nutrition</strong>, 59(Suppl.), 212S-217S.<br />
Betts, N.M., Baranowski, T., & Hoerr, S.L. (1997). Recommendations <strong>for</strong><br />
planning <strong>and</strong> reporting focus group research. Journal of <strong>Nutrition</strong> Education, 28,<br />
279-281.<br />
Buzzard, I.M., & Sievert, A.S. (1994). Research priorities <strong>and</strong> recommendations<br />
<strong>for</strong> dietary assessment methodology. American Journal of Clinical <strong>Nutrition</strong>, 59<br />
(Suppl.), 275S-280S.<br />
Chambers, E. IV, Godwin, S.L., & Vecchio, F.A. (2000). Cognitive strategies <strong>for</strong><br />
reporting portion sizes using dietary recall procedures. Journal of the American<br />
Dietetic Association, 100, 891-897.<br />
Cypel, Y.S., Guenther, P.M., & Petot, G.J. (1997). Validity of portion size<br />
measurement aids: A review. Journal of the American Dietetic Association, 97(3),<br />
289-292.<br />
Ericsson, K.A., & Simon, H.A. (1984). Protocol Analysis: Verbal Reports as<br />
Data. Cambridge, MA: MIT Press, 63-107.<br />
Fries, E., Green, P., & Bowen, D.J. (1995). What did I eat yesterday?<br />
Determinants of accuracy in 24-hour food memories. Applied Cognitive<br />
Psychology, 9, 143-155.<br />
Godwin, S., McGuire, B., Chambers, E. IV, McDowell, M., Clevel<strong>and</strong>, L.,<br />
Edwards-Perry, E., et al. (2001). Evaluation of portion size estimation aids used<br />
<strong>for</strong> meat in 24-hour dietary recalls. <strong>Nutrition</strong> Research, 21, 1217-1233.<br />
Hess, M.A. (1997). Portion Photos of Popular Foods. Chicago, IL: American<br />
Dietetic Association.<br />
McGuire, B., Chambers, E. IV, Godwin, S., & Brenner, S. (2001). Size categories<br />
most effective <strong>for</strong> estimating portion size of muffins. Journal of the American<br />
Dietetic Association, 101, 472-474.<br />
Mertz, W. (1992). Food intake measurements: Is there a “gold st<strong>and</strong>ard”? Journal<br />
of the American Dietetic Association, 92, 1463-1465.<br />
Morgan, D. (1990). Focus Groups as Qualitative Research. Newbury Park, CA:<br />
Sage Publications.<br />
SAS (Release 8.1). (2001). Cary, NC: SAS, Inc.<br />
Shatenstein, B., Payette, H., Nadon, S., & Gray-Donald, K. (2002). Development<br />
of an approach <strong>for</strong> evaluating functional foods intakes at different time periods<br />
among elderly people. American Journal of Clinical <strong>Nutrition</strong>, 75(2), 348-349.<br />
2003 Vol. 15 No. 1 65
Stewart, D.W., & Shamdasani, P.N. (1990). Focus Groups: Theory <strong>and</strong> Practice.<br />
Newbury Park, CA: Sage Publications.<br />
Taylor-Davis, S.A., & Smiciklas-Wright, H. (1993). The quality of survey data<br />
obtained from elderly adults. Journal of <strong>Nutrition</strong> <strong>for</strong> the <strong>Elderly</strong>, 13(1), 11-21.<br />
Thompson, F.E., & Byers, T. (1994). Dietary assessment resource manual. Journal<br />
of <strong>Nutrition</strong>, 124, 11S.<br />
Tippett, K.S., & Cypel, Y.S., (Eds.). (1998). Design <strong>and</strong> Operation: The<br />
Continuing Survey of Food Intakes by Individuals <strong>and</strong> the Diet <strong>and</strong> Health<br />
Knowledge Survey, 1994-96. Washington, DC: U.S. Department of Agriculture,<br />
Agricultural Research Service, Nationwide Food Surveys Report No. 96-1.<br />
U.S. Bureau of the Census. (1994). Statistical Abstract of the United States, 1994.<br />
(114 th ed.). Washington DC: U.S. Government Printing Office.<br />
U.S. <strong>Center</strong>s <strong>for</strong> Disease Control. (1994). Consensus Workshop on Dietary<br />
Assessment: <strong>Nutrition</strong> Monitoring <strong>and</strong> Tracking the Year 2000 Objectives.<br />
<strong>Center</strong>s <strong>for</strong> Disease Control <strong>and</strong> Prevention, p. 21.<br />
U.S. Department of Agriculture. (2001). Research <strong>and</strong> evaluation activities in<br />
<strong>US</strong>DA—Do people really know how much they eat? Family Economics <strong>and</strong><br />
<strong>Nutrition</strong> Review, 13(2), 61-62.<br />
Wilson, J.W., Enns, C.W., Goldman, J.D., Tippett, K.S., Mickle, S.J., Clevel<strong>and</strong>,<br />
L.E., et al. (1997). Data Tables: Combined Results from <strong>US</strong>DA’s 1994 <strong>and</strong> 1995<br />
Continuing Survey of Food Intakes by Individuals <strong>and</strong> 1994 <strong>and</strong> 1995 Diet <strong>and</strong><br />
Health Knowledge Survey. ARS Food Surveys Research Group. Retrieved March<br />
2000, from http://www.barc.usda.gov/bhnrc/foodsurvey/pdf/Tbchts95.pdf.<br />
Young, L.R., & Nestle, M. (1995). Portion sizes in dietary assessment: Issues <strong>and</strong><br />
policy implications. <strong>Nutrition</strong> Reviews, 53, 149-158.<br />
66 Family Economics <strong>and</strong> <strong>Nutrition</strong> Review
Healthy Eating Index Scores<br />
<strong>and</strong> the <strong>Elderly</strong><br />
Michael S. Finke, PhD<br />
University of Missouri-Columbia<br />
S<strong>and</strong>ra J. Huston, PhD<br />
University of Missouri-Columbia<br />
This study explored the positive relationship between advanced age <strong>and</strong> scores<br />
on the Healthy Eating Index (HEI). It did so by comparing component as well as<br />
total HEI scores of different age groups <strong>and</strong> by estimating the independent effect<br />
of age, among other demographic variables, on HEI scores. The elderly, compared<br />
with younger age groups, had higher HEI scores on the fruits, sodium,<br />
<strong>and</strong> cholesterol components. Results also showed that the independent effect<br />
of advanced age upon component scores, as well as upon the total HEI scores,<br />
is notably strong. Results provide insight into the relationship between age <strong>and</strong><br />
healthful eating.<br />
T<br />
he Healthy Eating Index (HEI)<br />
provides a numerical yardstick<br />
of diet quality based on the<br />
Food Guide Pyramid (U.S. Department<br />
of Agriculture [<strong>US</strong>DA], 1996) <strong>and</strong> the<br />
Dietary Guidelines <strong>for</strong> Americans<br />
(<strong>US</strong>DA & U.S. Department of Health<br />
<strong>and</strong> Human Services [DHHS], 1995).<br />
It was designed to evaluate diets<br />
according to a more contemporary<br />
underst<strong>and</strong>ing of healthful eating,<br />
one that recognizes the role of overconsumption<br />
<strong>and</strong> poor diet choice as<br />
contemporary public health problems<br />
(Kennedy, Ohls, Carlson, & Fleming,<br />
1995).<br />
Previous study of HEI scores among<br />
demographic groups reports that age<br />
may be associated with more careful<br />
choices of nutritious foods (Basiotis,<br />
Hirschman, & Kennedy, 1996; Gaston,<br />
Mardis, Gerrior, Sahyoun, & An<strong>and</strong>,<br />
2001). In fact, healthful eating as it is<br />
currently defined is highest among<br />
those in the oldest age categories<br />
(McDonald & Webster, 1998; Bowman,<br />
Lino, Gerrior, & Basiotis, 1998).<br />
This result is surprising given the<br />
potential impediments to a nutritious<br />
diet such as lower average nutrition<br />
knowledge <strong>and</strong> diet-health awareness<br />
(McDonald & Webster, 1998), reduced<br />
mobility, lower average educational<br />
attainment, financial resources (Administration<br />
on Aging, 2003), <strong>and</strong> even<br />
receptiveness (Bernheim, 1990) to<br />
new in<strong>for</strong>mation among the elderly.<br />
Further exploration of the HEI <strong>and</strong> its<br />
components is needed to underst<strong>and</strong><br />
better the relationship between advanced<br />
age <strong>and</strong> higher HEI scores.<br />
Gaston et al. (1999) note that mean<br />
scores among the elderly may be<br />
attributed to reduced consumption<br />
of food energy, which leads to better<br />
scores <strong>for</strong> components (e.g., fat,<br />
saturated fat, cholesterol, <strong>and</strong> sodium)<br />
that penalize <strong>for</strong> overconsumption.<br />
Compared with younger groups, the<br />
elderly also appear to consume more<br />
fruits. Identifying the independent<br />
effect of age on HEI components may<br />
provide insight into elderly nutrition<br />
<strong>and</strong> ultimately into the factors leading<br />
to variation in HEI scoring.<br />
The HEI score comprises 10 components<br />
that represent different aspects<br />
of a healthful diet. The first five components<br />
measure adherence to the food<br />
groups of the Food Guide Pyramid:<br />
grains, vegetables, fruits, milk, <strong>and</strong><br />
meat. Components 6 <strong>and</strong> 7 measure<br />
total fat <strong>and</strong> saturated fat consumption,<br />
2003 Vol. 15 No. 1 67
Compared with other age groups,<br />
the elderly do not appear to be<br />
more at risk based on their<br />
consumption of foods in any<br />
HEI component.<br />
respectively, as a percentage of total<br />
food energy intake. Components 8 <strong>and</strong><br />
9 measure total cholesterol <strong>and</strong> sodium<br />
intake, respectively, <strong>and</strong> component 10<br />
examines the variety in a person’s diet.<br />
Scores <strong>for</strong> each component range from<br />
0 to 10; thus, 100 is the highest HEI<br />
score attainable. According to the<br />
<strong>US</strong>DA <strong>Center</strong> <strong>for</strong> <strong>Nutrition</strong> <strong>Policy</strong> <strong>and</strong><br />
<strong>Promotion</strong> (CNPP), an HEI score at or<br />
below 80 suggests that one’s diet needs<br />
to improve, a score below 51 rates a<br />
diet as poor, <strong>and</strong> a score above 80 is<br />
considered a good diet (<strong>US</strong>DA, 1995).<br />
This study compares average scores<br />
<strong>and</strong> CNPP ratings of diet quality <strong>for</strong><br />
the total HEI as well as <strong>for</strong> component<br />
scores among age groups. A multivariate<br />
analysis is also per<strong>for</strong>med on<br />
the total HEI <strong>and</strong> each component to<br />
estimate the independent effect of age<br />
upon scores.<br />
Methods<br />
HEI mean scores <strong>for</strong> each of the 10<br />
components were compared among five<br />
age groups: less than 35, 35-49, 50-64,<br />
65-79, <strong>and</strong> 80 <strong>and</strong> above. Those age 65<br />
<strong>and</strong> above were considered elderly in<br />
this analysis. To conduct the comparison,<br />
we used CNPP’s categorical<br />
scoring system <strong>for</strong> overall diet quality<br />
to determine the proportion of diets<br />
designated “poor,” “needs improvement,”<br />
or “good.” Each person’s HEI<br />
component was also graded according<br />
to guidelines as outlined by Variyam,<br />
Blaylock, Smallwood, <strong>and</strong> Basiotis<br />
(1998). For the first five components<br />
(grains, vegetables, fruits, milk, meat),<br />
a score of 10 was awarded if the<br />
respondent met the recommended<br />
servings <strong>for</strong> that component. If the<br />
respondent had no servings, a score of<br />
0 was assigned. For all other servings,<br />
proportional points were awarded based<br />
on the number of servings consumed.<br />
Similarly, points were awarded to<br />
components 6 through 10 according to<br />
certain thresholds or awarded proportionally<br />
<strong>for</strong> scores between the cutoff<br />
points of 0 <strong>and</strong> 10. A score of 10 was<br />
awarded to each respective HEI<br />
component if a respondent’s intake<br />
met the following st<strong>and</strong>ards: total fat<br />
equaled or was less than 30 percent of<br />
total calories, saturated fat was less than<br />
10 percent, cholesterol intake was 300<br />
milligrams (mg) or less, sodium intake<br />
was 2,400 mg or less, or eight or more<br />
different foods were consumed in a day<br />
(variety). A score of 0 was awarded to<br />
each respective component when an<br />
individual’s intake of total dietary fat<br />
equaled or exceeded 45 percent of total<br />
calories, saturated fat was 15 percent or<br />
more, cholesterol was 450 mg or more,<br />
sodium intake was 4,800 mg or more,<br />
or when the person consumed three or<br />
fewer different foods in a day.<br />
To estimate the extent to which age<br />
contributes independently to each<br />
component score <strong>and</strong> total HEI score,<br />
we used 11 multiple regressions. In<br />
addition to controlling <strong>for</strong> age (35-49,<br />
50-64, 65-79, 80 <strong>and</strong> above, less than<br />
35=reference), the multiple regressions<br />
also controlled <strong>for</strong> region (Midwest,<br />
Northeast, West, <strong>and</strong> South=reference),<br />
urbanization (rural, suburban, city=<br />
reference), gender, race (Black, Asian,<br />
other=reference), log of income, <strong>and</strong><br />
total food energy. Food energy was<br />
included to capture potential underreporting<br />
or physiological differences<br />
that were not accounted <strong>for</strong> in other<br />
demographic variables that may<br />
contribute to higher or lower HEI<br />
scores. We report the regression<br />
results <strong>for</strong> age only.<br />
Data<br />
This study used data from <strong>US</strong>DA’s<br />
1994-96 Continuing Survey of Food<br />
Intakes by Individuals (CSFII) <strong>and</strong> HEI<br />
data. The CSFII, which is nationally<br />
68 Family Economics <strong>and</strong> <strong>Nutrition</strong> Review
epresentative, contains in<strong>for</strong>mation<br />
regarding Americans’ food intake as<br />
well as data regarding their demographic<br />
<strong>and</strong> socioeconomic characteristics.<br />
The CSFII uses the 24-hour dietary<br />
recall method to collect data about food<br />
<strong>and</strong> nutrient intakes of each respondent.<br />
This in<strong>for</strong>mation is collected over 2<br />
nonconsecutive days. The HEI data<br />
provides a summary measure of overall<br />
diet quality <strong>and</strong> is computed <strong>for</strong> people<br />
with complete food intake records <strong>for</strong><br />
the first day of the CSFII (<strong>US</strong>DA,<br />
1995; Bowman et al., 1998).<br />
This study examined a sample of 9,925<br />
respondents who were 18 years of age<br />
<strong>and</strong> older, who had completed the<br />
CSFII, <strong>and</strong> were represented in the<br />
HEI. For purposes of this research, the<br />
data were grouped by age: 2,558<br />
respondents were 18 to 34 years old,<br />
2,572 were 35 to 49 years old, 2,539<br />
were 50 to 64 years old, <strong>and</strong> 2,256 were<br />
age 65 <strong>and</strong> older. Among those age 65<br />
<strong>and</strong> older, 1,776 were 65 to 79 years<br />
old; the remaining 480 respondents<br />
were 80 years old or older. 1<br />
Results<br />
The main demographic differences<br />
between the elderly <strong>and</strong> younger<br />
respondents were education <strong>and</strong> income<br />
(table 1). The proportion of those who<br />
were age 65 to 79 <strong>and</strong> who had less<br />
than a high school education was three<br />
times—36 vs. 12 percent—that of<br />
those between age 35 <strong>and</strong> 49. Also,<br />
17 percent of those who were 65 to 79<br />
years old, compared with 30 percent of<br />
respondents age 35 to 49, had a college<br />
degree. Even fewer of the oldest age<br />
group—80 <strong>and</strong> above—had a college<br />
degree (12 percent). The average<br />
income <strong>for</strong> respondents age 65 to 79<br />
was $28,028; <strong>for</strong> those age 80 <strong>and</strong><br />
above, $4,525 less. For the 35- to 49-<br />
year-olds, the average income was<br />
Table 1. Descriptive statistics <strong>for</strong> the whole sample <strong>and</strong> by age group<br />
Age groups<br />
Variables All
$44,844. Other notable differences<br />
were the greater proportion of the<br />
elderly, versus other age groups,<br />
living in the Northeast (23 percent),<br />
Midwest (28 percent), <strong>and</strong> rural areas<br />
(29 percent) <strong>and</strong> those more likely to<br />
be White, 86 <strong>and</strong> 88 percent (65 to<br />
79 years old <strong>and</strong> 80 <strong>and</strong> older,<br />
respectively), compared with 76 <strong>and</strong><br />
81 percent (less than 35 years old<br />
<strong>and</strong> 35 to 49, respectively).<br />
HEI Scores<br />
The total HEI score ranged from 61.03<br />
(<strong>for</strong> those less than age 35) to 66.68<br />
(<strong>for</strong> those age 65 to 79) (table 2). The<br />
lowest average score <strong>for</strong> all respondents<br />
was <strong>for</strong> the fruits component (3.78); the<br />
highest score was <strong>for</strong> cholesterol <strong>and</strong><br />
variety (7.57 each). Compared with the<br />
younger groups, respondents age 65 to<br />
79 had higher than average component<br />
scores <strong>for</strong> the fruits, total fat, saturated<br />
fat, cholesterol, sodium, <strong>and</strong> variety<br />
components (5.07 to 8.11). Those age<br />
80 <strong>and</strong> over, compared with those less<br />
than age 65, had higher than average<br />
scores <strong>for</strong> the fruits, cholesterol, <strong>and</strong><br />
sodium components (5.10 to 8.21).<br />
However, only the scores <strong>for</strong> fruits,<br />
cholesterol, <strong>and</strong> sodium were at least<br />
0.50 points higher, on average, <strong>for</strong><br />
respondents between age 65 <strong>and</strong> 79<br />
<strong>and</strong> <strong>for</strong> those over 80 years of age,<br />
compared with all other age groups.<br />
Percentage of Respondents<br />
Meeting the Recommendations<br />
Meeting recommended consumption<br />
within individual components corresponded<br />
to a score of 10. Respondents<br />
were separated into groups based on<br />
whether they scored 0 (high risk),<br />
between 0 <strong>and</strong> 10 (needs improvement),<br />
or 10 (met recommendations) (table 3).<br />
A higher proportion of elderly respondents<br />
met recommendations <strong>for</strong> fruits<br />
<strong>and</strong> cholesterol than did any other age<br />
group. Whereas 24 to 25 percent of the<br />
elderly age groups met the recommendation<br />
<strong>for</strong> fruits, only 11 to 19 percent<br />
of the younger groups met this recommendation.<br />
Close to three-fourths of the<br />
Table 2. Healthy Eating Index scores <strong>for</strong> whole sample <strong>and</strong> by age group<br />
Age groups<br />
Variables All
Table 3. Diet rating of the Healthy Eating Index <strong>for</strong> whole sample <strong>and</strong> by age group<br />
Age groups<br />
Variables All
Table 4. Regression coefficients <strong>for</strong> age groups by HEI variables<br />
Dependent Age groups 1<br />
variables 35-49 50-64 65-79 80+<br />
Parameter estimate (rank 2 in parentheses)<br />
Total HEI -0.010 3.810*** 8.530*** 8.270***<br />
(6) (1) (5)<br />
Grains -0.005 0.730*** 1.114*** 0.742***<br />
(4) (2) (6)<br />
Vegetables -0.000 0.865*** 0.964*** 1.069***<br />
(2) (3) (6)<br />
Fruits 0.226** 1.621*** 2.904*** 3.176***<br />
(14) (3) (1) (4)<br />
Milk 0.203** 0.172* 0.797*** 0.854***<br />
(14) (15) (4) (7)<br />
Meat 0.274*** 0.856*** 0.459*** 0.325**<br />
(9) (2) (4) (12)<br />
Total fat -0.440*** -0.637*** -0.003 -0.162<br />
(5) (3)<br />
Saturated fat -0.051 0.086 0.470*** 0.233<br />
(5)<br />
Cholesterol -0.480*** -0.681*** 0.274** -0.209<br />
(8) (3) (10)<br />
Sodium -0.081 -0.191** 0.135 0.250*<br />
(7) (10)<br />
Variety 0.344*** 0.991*** 1.966*** 1.990***<br />
(3) (4) (2) (5)<br />
1 Reference category =
average educational attainment <strong>and</strong><br />
nutrition knowledge <strong>and</strong> higher HEI<br />
scores among the elderly, it is not<br />
surprising that when each of these<br />
independent factors was taken into<br />
account, the positive effect of age<br />
upon HEI scores was magnified.<br />
Results show that the 65 to 79 age<br />
category was among the four strongest<br />
independent predictors <strong>for</strong> 6 of the<br />
10 HEI components <strong>and</strong> the strongest<br />
predictor of the total HEI score.<br />
Factors related to lifestyle, resources,<br />
or cohort effects among the elderly<br />
have a strong influence on healthful<br />
eating. Increased consumption of fresh<br />
fruits <strong>and</strong> vegetables may be associated<br />
with ease of preparation, availability<br />
within traditional retirement areas, or<br />
even cohort-related familiarity <strong>and</strong><br />
habit. Higher scores <strong>for</strong> other groups<br />
seem to indicate a more balanced diet<br />
overall, which is confirmed by higher<br />
variety scores. Evidence shows that a<br />
higher HEI score is associated with a<br />
reduced risk of disease, particularly<br />
cardiovascular disease among men<br />
<strong>and</strong> women (McCullough et al., 2000;<br />
Hann, Rock, King, & Drewnowski,<br />
2001). The elderly may also be the<br />
group best able to envision the ultimate<br />
effects of poor eating upon health. As<br />
suggested by Becker <strong>and</strong> Mulligan<br />
(1997), experience improves the ability<br />
to imagine one’s vulnerability.<br />
References<br />
Administration on Aging, U.S. Department of Health <strong>and</strong> Human Services. (2002).<br />
A Profile of Older Americans. Retrieved on March 19, 2003, from www.aoa.gov/<br />
aoa/stats/profile/profile.pdf.<br />
Basiotis, P., Hirschman, J., & Kennedy, E. (1996). Economic <strong>and</strong> sociodemographic<br />
determinants of “healthy eating” as measured by <strong>US</strong>DA’s Healthy<br />
Eating Index. Consumer Interests Annual, 42, 81-88.<br />
Becker, G.S., & Mulligan, B. (1997). The endogenous determination of time<br />
preference. Quarterly Journal of Economics, 112(3), 739-758.<br />
Bernheim, B.D. (1990). How do the elderly <strong>for</strong>m expectations? An analysis of<br />
responses to new in<strong>for</strong>mation. In D. Wise (Ed.), Issues in the Economics of Aging,<br />
pp. 259-283, Chicago: University Press.<br />
Bowman, S.A., Lino, M., Gerrior, S.A., & Basiotis, P. (1998). The Healthy Eating<br />
Index: 1994-96. U.S. Department of Agriculture, <strong>Center</strong> <strong>for</strong> <strong>Nutrition</strong> <strong>Policy</strong> <strong>and</strong><br />
<strong>Promotion</strong>. CNPP-5.<br />
Gaston, N., Mardis, A., Gerrior, S., Sahyoun, N., & An<strong>and</strong>, R. (2001). A focus on<br />
nutrition <strong>for</strong> the elderly: It’s time to take a closer look. <strong>Nutrition</strong> Insights No. 14.<br />
Family Economics <strong>and</strong> <strong>Nutrition</strong> Review, 13(1), 95-97.<br />
Hann, C., Rock, C., King, I., & Drewnowski, A. (2001). Validation of the Healthy<br />
Eating Index with use of plasma biomarkers in a clinical sample of women.<br />
American Journal of Clinical <strong>Nutrition</strong> 74, 479-486.<br />
Kennedy, E.T., Ohls, J., Carlson, S., & Fleming, K. (1995). The Healthy Eating<br />
Index: Design <strong>and</strong> applications. Journal of the American Dietetic Association, 95,<br />
1103-1108.<br />
McCullough, M., Feskanich, D., Rimm, E., Giovannucci, E., Ascherio, A.,<br />
Variyam, J., et al. (2000). Adherence to the Dietary Guidelines <strong>for</strong> Americans <strong>and</strong><br />
risk of major chronic disease in men. American Journal of Clinical <strong>Nutrition</strong>, 72,<br />
1223-1231.<br />
McDonald, T., & Webster, J. (1998). <strong>Nutrition</strong> In<strong>for</strong>mation the Key to Better Diet,<br />
Better Health. <strong>US</strong>DA’s Healthy Eating Index <strong>and</strong> <strong>Nutrition</strong> In<strong>for</strong>mation. Press<br />
Release No. 0209.98. Retrieved from www.usda.gov/cnpp/release_hei.html.<br />
U.S. Department of Agriculture, <strong>Center</strong> <strong>for</strong> <strong>Nutrition</strong> <strong>Policy</strong> <strong>and</strong> <strong>Promotion</strong>.<br />
(1995). The Healthy Eating Index. CNPP-1.<br />
U.S. Department of Agriculture, <strong>Center</strong> <strong>for</strong> <strong>Nutrition</strong> <strong>Policy</strong> <strong>and</strong> <strong>Promotion</strong>.<br />
(1996). The Food Guide Pyramid. Home <strong>and</strong> Garden Bulletin No. 252.<br />
U.S. Department of Agriculture, & U.S. Department of Health <strong>and</strong> Human<br />
Services. (1995). <strong>Nutrition</strong> <strong>and</strong> Your Health: Dietary Guidelines <strong>for</strong> Americans.<br />
Home <strong>and</strong> Garden Bulletin No. 232.<br />
Variyam, J.N., Blaylock, J., Smallwood, D., & Basiotis, P.P. (1998). <strong>US</strong>DA’s<br />
Healthy Eating Index <strong>and</strong> <strong>Nutrition</strong> In<strong>for</strong>mation. Economic Research Service <strong>and</strong><br />
<strong>Center</strong> <strong>for</strong> <strong>Nutrition</strong> <strong>Policy</strong> <strong>and</strong> <strong>Promotion</strong>. Technical Bulletin No. 1866.<br />
2003 Vol. 15 No. 1 73
Factors Affecting <strong>Nutrition</strong>al<br />
Adequacy Among Single <strong>Elderly</strong><br />
Women<br />
Deanna L. Sharpe, PhD<br />
S<strong>and</strong>ra J. Huston, PhD<br />
Michael S. Finke, PhD<br />
University of Missouri-Columbia<br />
Data from the 1994-96 Continuing Survey of Food Intakes by Individuals <strong>and</strong> the<br />
Diet <strong>and</strong> Health Knowledge Survey were used to assess the relative importance<br />
of factors associated with the quality of the diet of single women age 65 <strong>and</strong> older.<br />
Findings indicated that higher levels of nutritional adequacy were associated with<br />
Midwest residence, daily intake of a multivitamin/multimineral, higher levels of<br />
income, <strong>and</strong> the presence of circulatory disease. Lower levels of nutritional<br />
adequacy were associated with employment, receipt of food stamps, <strong>and</strong> rural<br />
residence. Results confirm the importance of providing healthful meal options to<br />
single elderly females who may be faced with fewer financial resources, reduced<br />
mobility, or higher costs associated with obtaining food.<br />
N<br />
utritional adequacy among<br />
the elderly interests an aging<br />
U.S. population. In 1996,<br />
12 percent of Americans were over<br />
age 65. By 2050, this elderly population<br />
is projected to more than double<br />
as members of the large baby-boom<br />
generation reach their elder years.<br />
Within this population, the fastest<br />
growing segment is expected to be<br />
those over age 85 (U.S. Department<br />
of Commerce, 1995).<br />
For elderly individuals, inadequate<br />
nutrition can increase the incidence<br />
<strong>and</strong> severity of disease <strong>and</strong> also hasten<br />
loss of independence. But, the ability<br />
to choose a diet with sufficient quality<br />
<strong>and</strong> variety to meet daily nutrient<br />
needs may be affected adversely<br />
by the pathological, physiological,<br />
economical, <strong>and</strong> social factors that<br />
accompany aging. Reduced physical<br />
activity <strong>and</strong> lean body mass decrease<br />
requirements <strong>for</strong> food energy <strong>and</strong><br />
increase the need <strong>for</strong> nutrient-dense<br />
foods (Haller, 1999). Gradual loss of<br />
health due to the effects of chronic<br />
diseases, such as arthritis or diabetes,<br />
can impair the ability to obtain, prepare,<br />
<strong>and</strong> enjoy nutritious foods (Hendy,<br />
Nelson, & Greco, 1998). Qu<strong>and</strong>t <strong>and</strong><br />
Chao (2000) note that women, more so<br />
than men, report chronic problems with<br />
oral health <strong>and</strong> digestion, the need <strong>for</strong><br />
special diets, diseases interfering with<br />
eating, <strong>and</strong> anemia.<br />
Background<br />
Lower levels of economic resources<br />
are associated with a greater risk of<br />
experiencing hunger <strong>and</strong> food insufficiency<br />
(Brown, 1987; Sahyoun<br />
& Basiotis, 2001). Qu<strong>and</strong>t <strong>and</strong> Rao<br />
(1999) found that having an income<br />
less than 150 percent of the poverty<br />
level was a relatively strong predictor<br />
of food insecurity <strong>for</strong> Appalachian<br />
Kentucky residents age 65 <strong>and</strong> older.<br />
Hendy et al. (1998) noted that food<br />
cost was frequently mentioned as a<br />
barrier to obtaining adequate nutrition<br />
<strong>for</strong> rural elderly in the Eastern United<br />
States. Low economic resources can<br />
also affect the quantity <strong>and</strong> quality<br />
of food purchased, especially if an<br />
74 Family Economics <strong>and</strong> <strong>Nutrition</strong> Review
increasing portion of the budget<br />
must be devoted to health care <strong>and</strong><br />
prescription medications (Quinn,<br />
Johnson, Poon, Martin, & Nickols-<br />
Richardson, 1997).<br />
While assistance is available through<br />
the U.S. Department of Agriculture’s<br />
(<strong>US</strong>DA) Food Stamp Program to help<br />
the economically disadvantaged,<br />
concern exists that all those who are<br />
eligible do not participate <strong>and</strong> that<br />
benefit levels are low, compared with<br />
need (Shotl<strong>and</strong> & Loonin, 1988).<br />
Some research has suggested that it<br />
costs more to eat a more healthful<br />
diet (Blaylock, Smallwood, Kassel,<br />
Variyam, & Aldrich, 1999); thus,<br />
low income can restrict not just the<br />
quantity but the nutritional quality of<br />
food purchased as well. Low income<br />
can also reduce consumers’ ability to<br />
substitute market-produced meals <strong>for</strong><br />
home-cooked versions as their desire<br />
<strong>and</strong> ability to shop <strong>and</strong> prepare meals<br />
decline.<br />
Lower levels of education have been<br />
associated with inadequate nutritional<br />
intake in the elderly (Bianchetti,<br />
Rozzini, Carabellese, Zanetti, &<br />
Trabucchi, 1990; Dewitt, Douglas,<br />
& Matre, 1989). <strong>Nutrition</strong> knowledge<br />
has been found to have a weak, but<br />
positive, association with diet adequacy<br />
(Howard, Gates, Ellersieck, &<br />
Dowdy, 1998).<br />
Schoenberg (2000) identified four<br />
“pathways” of nutritional risk <strong>for</strong><br />
rural Black elderly: (1) changes in the<br />
physical <strong>and</strong> social importance of<br />
food, (2) lack of access to necessary<br />
resources, (3) increased physical<br />
limitations, <strong>and</strong> (4) misin<strong>for</strong>mation<br />
about diet <strong>and</strong> nutrition. Lee,<br />
Templeton, Marlette, Walker, <strong>and</strong><br />
Fahm (1998) discovered nutritional<br />
deficiencies in food energy, dietary<br />
fiber, <strong>and</strong> calcium among southern<br />
Black rural elderly. Diet variety appears<br />
to be lower <strong>for</strong> Blacks, compared with<br />
other racial groups (Dewitt et al., 1989).<br />
In addition, Blacks are also more likely<br />
than Whites to have inadequate<br />
nutritional intake because of weight<br />
changes, illnesses, <strong>and</strong> oral problems<br />
that interfere with appetite <strong>and</strong> eating<br />
(Nickols-Richardson, Johnson, Poon,<br />
& Martin, 1996).<br />
Loneliness due to death of spouse or<br />
friends can diminish the social reasons<br />
<strong>for</strong>, <strong>and</strong> pleasures associated with,<br />
eating (Shifflett & McIntosh, 1983;<br />
Walker & Beauchene, 1991). Eating<br />
regular meals <strong>and</strong> having an adequate<br />
diet have been found to depend, at least<br />
in part, on eating with others (Doan,<br />
1990; Shifflett & McIntosh, 1983;<br />
Walker & Beauchene, 1991). Having<br />
few shared meals has been associated<br />
with higher levels of nutritional<br />
risk among rural elders in eastern<br />
Pennsylvania (Hendy et al., 1998)<br />
<strong>and</strong> with higher risk of food insecurity<br />
in rural Appalachia (Qu<strong>and</strong>t & Rao,<br />
1999). Fewer than a third of a<br />
nationally representative sample of<br />
elders experiencing food insufficiency<br />
were married, compared with more<br />
than half of those consuming a<br />
sufficient diet (Sahyoun & Basiotis,<br />
2001).<br />
Vitamin <strong>and</strong> mineral supplementation<br />
can offset some of the nutritional<br />
deficiencies in the elderly. A study of<br />
healthy, independent-living Canadians<br />
age 65 to 74 revealed that vitamin C<br />
supplements were used most often by<br />
both genders, but about three times as<br />
many women, compared with men, took<br />
a calcium supplement. In general, use<br />
of supplements significantly increased<br />
nutrient intake; <strong>and</strong> the risks <strong>for</strong><br />
deficiency were eliminated <strong>for</strong> vitamin<br />
A, vitamin B 12 , folacin, <strong>and</strong> zinc<br />
(Donald et al., 1992).<br />
This current study uses nationally<br />
representative data on single women<br />
age 65 <strong>and</strong> older from the 1994-96<br />
Continuing Survey of Food Intakes by<br />
Individuals (CSFII) <strong>and</strong> the Diet <strong>and</strong><br />
Health Knowledge Survey (DHKS)<br />
conducted by <strong>US</strong>DA. Single women<br />
are of interest because the incidence<br />
of food insufficiency is relatively<br />
greater <strong>for</strong> the single elderly population<br />
(Sahyoun & Basiotis, 2001). They are<br />
also of interest because of their<br />
generally longer lifespans <strong>and</strong><br />
consequently their prolonged risk<br />
of experiencing the pathological,<br />
physiological, economical, <strong>and</strong> social<br />
losses associated with poorer diet<br />
quality. In addition, women’s longer<br />
average lifespan means that they<br />
are more likely to experience the life<br />
changes associated with a decrease in<br />
the quantity <strong>and</strong> quality of food intake<br />
(Nickols-Richardson et al., 1996;<br />
Qu<strong>and</strong>t & Chao, 2000).<br />
Research indicates that health problems<br />
related to inadequate nutrition<br />
are more prevalent in rural areas<br />
(Qu<strong>and</strong>t & Chao, 2000; Schoenberg,<br />
2000; Shotl<strong>and</strong> & Loonin, 1988). Rural<br />
residents also mention transportation<br />
to <strong>and</strong> from food markets as a structural<br />
barrier to obtaining adequate food<br />
(Hendy et al., 1998; Lee et al., 1998;<br />
Wallace, Pascarella, & Campanella-<br />
Voica, 1997). Consequently, the effect<br />
of rural residence on single elderly<br />
women achieving adequate nutrition<br />
is considered in this research.<br />
This study evaluates nutrient intake<br />
among single elderly women residing in<br />
rural <strong>and</strong> nonrural areas <strong>and</strong> examines<br />
the relative importance of single elderly<br />
women’s resources, health status,<br />
attitudes, <strong>and</strong> practices related to food<br />
procurement <strong>and</strong> processing, as well<br />
as demographic characteristics in<br />
achieving adequate nutrition.<br />
2003 Vol. 15 No. 1 75
Method<br />
Data <strong>and</strong> Sample<br />
The CSFII 1994-96 is a nationally<br />
representative sample of individuals<br />
of all ages living in the United States.<br />
In<strong>for</strong>mation regarding food <strong>and</strong><br />
nutrient intakes of each respondent<br />
was gathered over 2 nonconsecutive<br />
days by using dietary recalls.<br />
Individuals age 20 <strong>and</strong> older also<br />
completed the DHKS, which contains<br />
in<strong>for</strong>mation regarding the dietary<br />
health knowledge <strong>and</strong> attitudes of each<br />
individual. Included are questions<br />
about the knowledge of specific health<br />
risks associated with foods, personal<br />
health in<strong>for</strong>mation, <strong>and</strong> the frequency<br />
of use of in<strong>for</strong>mation on food labels.<br />
The DHKS sample consists of 5,765<br />
respondents, from which 732 single<br />
women age 65 <strong>and</strong> older residing in<br />
rural (n=218) <strong>and</strong> nonrural (n=514)<br />
areas were selected <strong>for</strong> this study.<br />
The method used to collect the dietary<br />
recall in<strong>for</strong>mation in these surveys may<br />
lead to underreporting, particularly<br />
among older participants. It could also<br />
place some participants’ nutritional<br />
status below the U.S. Recommended<br />
Dietary Allowance (RDA) threshold<br />
<strong>for</strong> one or more of the specific components<br />
of nutritional adequacy considered<br />
in this study (Dixon, Cronin,<br />
& Krebs-Smith, 2001). Un<strong>for</strong>tunately,<br />
it is not possible to ascertain the extent<br />
to which underreporting might be a<br />
problem <strong>for</strong> the sample used in this<br />
study. Thus, the possibility of underreporting<br />
is simply acknowledged as<br />
a limitation of these data.<br />
Conceptual Framework<br />
The Deacon <strong>and</strong> Firebaugh (1988)<br />
systems model of resource management<br />
provides the basic conceptual<br />
framework used in this study. According<br />
to this model, through the managerial<br />
actions of planning <strong>and</strong> implementing,<br />
resources are trans<strong>for</strong>med in<br />
ways that meet value-based goals. In<br />
the trans<strong>for</strong>mation process, constraints<br />
<strong>and</strong> facilitating conditions can be<br />
present. Constraints limit means of<br />
reaching a goal or restrict access to<br />
or use of resources. Facilitating<br />
conditions, in contrast, ease the<br />
process of goal attainment.<br />
When this conceptual framework is<br />
applied to the current study, the goal<br />
to be met is obtaining adequate<br />
nutrition—defined as intake of given<br />
nutrients that meet or exceed the<br />
RDAs. Resources consist of level<br />
of education, nutrition knowledge,<br />
income (measured as a percentage of<br />
the poverty level), <strong>and</strong> receipt of food<br />
stamps. Attitudes <strong>and</strong> behavior related<br />
to food procurement <strong>and</strong> preparation<br />
comprise the managerial actions of<br />
planning <strong>and</strong> implementing. Several<br />
factors could help or constrain<br />
obtaining adequate nutrition. For<br />
example, diet restrictions <strong>and</strong> disease<br />
can constrain food choices; work<br />
commitments can constrain time <strong>for</strong><br />
food shopping <strong>and</strong> preparation; rural<br />
residence can limit access to less<br />
expensive, higher quality foods,<br />
which raises the costs associated with<br />
obtaining adequate nutrition. Taking<br />
a daily multivitamin/multimineral<br />
would facilitate meeting the RDAs <strong>for</strong><br />
vitamins <strong>and</strong> minerals. Other variables<br />
in the conceptual framework are age,<br />
race, <strong>and</strong> region of residence, which<br />
enter the model as controls.<br />
Empirical Model<br />
To ascertain the importance of the<br />
factors considered in this study,<br />
we used an ordinary least squares<br />
regression to compute st<strong>and</strong>ardized<br />
betas:<br />
RDA index = α + Σβ ii resources + Σβ ii<br />
management + Σβ ii constraining<br />
factors + Σβ ii facilitating factors + ε<br />
An RDA index was constructed to<br />
measure the degree to which study<br />
participants met RDA requirements <strong>for</strong><br />
food energy, protein, <strong>and</strong> 14 essential<br />
vitamins <strong>and</strong> minerals. The threshold<br />
level <strong>for</strong> each component of the index<br />
is based on the 1989 RDAs (National<br />
Academy of Sciences, 1989). These<br />
RDAs were used rather than the<br />
recently published Dietary Reference<br />
Intakes (DRIs) because the RDAs were<br />
current at the time the data used in this<br />
study were collected.<br />
Resources consisted of measures of<br />
both general <strong>and</strong> nutrition-specific<br />
knowledge <strong>and</strong> economic resources.<br />
General knowledge was measured by a<br />
set of categorical variables indicating<br />
highest grade completed. <strong>Nutrition</strong>specific<br />
knowledge was measured by<br />
the number of items from a total of<br />
13 that a study participant answered<br />
correctly on a test of nutrition knowledge<br />
administered in the original<br />
survey. Economic resources consisted<br />
of income, which was measured as a<br />
percentage of poverty <strong>and</strong> receipt of<br />
food stamps.<br />
Attitudes <strong>and</strong> behavior related to food<br />
procurement <strong>and</strong> preparation were<br />
indicative of plans <strong>and</strong> actions<br />
associated with achieving nutritional<br />
adequacy (management). Whereas<br />
attitudes were indicated by the<br />
importance of nutrition, proper food<br />
storage, ease of preparation, <strong>and</strong> taste,<br />
behavior was denoted by study<br />
participants’ use of nutrition labels<br />
<strong>and</strong> whether they had the main<br />
responsibility <strong>for</strong> preparing meals.<br />
Constraints on food choices were<br />
measured by the presence of diet<br />
restrictions <strong>and</strong> diseases prevalent<br />
among the elderly. These consisted<br />
of lowfat, low-calorie, low-sodium,<br />
high-fiber, or diabetic diets <strong>and</strong><br />
circulatory disease, diabetes, cancer,<br />
or osteoporosis. Work was considered<br />
a time constraint to shop <strong>for</strong> <strong>and</strong><br />
prepare food. Although incidence of<br />
employment among the elderly is low,<br />
76 Family Economics <strong>and</strong> <strong>Nutrition</strong> Review
women often continue working past<br />
age 65 (Herz, 1988). This trend is<br />
expected to continue as members of<br />
the baby-boom generation reach their<br />
elder years (Purcell, 2000).<br />
Rural versus nonrural (urban <strong>and</strong><br />
suburban) residence also was included<br />
in the empirical model, as were<br />
multivitamin/multimineral intake,<br />
age, race, <strong>and</strong> region of residence.<br />
Results<br />
Results indicated that the rural <strong>and</strong><br />
nonrural samples were similar (table 1).<br />
Respondents typically had less than a<br />
high school education (40 percent <strong>for</strong><br />
the total sample, 45 percent <strong>for</strong> rural<br />
residents, <strong>and</strong> 37 percent <strong>for</strong> nonrural<br />
residents). Average age of the sample<br />
was close to 74 years. The largest<br />
proportion of rural residents lived in<br />
the South (43 percent), while about an<br />
equal proportion of nonrural residents<br />
lived in the Northeast, South, or<br />
Midwest (28, 28, <strong>and</strong> 27 percent,<br />
respectively). Close to 90 percent of<br />
both rural <strong>and</strong> nonrural respondents<br />
were White, did not receive food<br />
stamps, <strong>and</strong> were not employed.<br />
Regarding attitudes <strong>and</strong> behavior<br />
related to food procurement <strong>and</strong><br />
preparation, close to three-fourths of<br />
both rural <strong>and</strong> nonrural respondents<br />
indicated that nutrition, taste, <strong>and</strong> food<br />
not spoiling were very important. A<br />
little over half of each group did not<br />
consider easy preparation to be very<br />
important, most did not use nutrition<br />
labels, <strong>and</strong> about 90 percent of each<br />
group had primary responsibility <strong>for</strong><br />
preparing meals. Slightly less than<br />
half (44 to 47 percent) of each group<br />
took a daily multivitamin/multimineral<br />
supplement. Study participants seemed<br />
to have adequate but relatively low<br />
economic resources: income was,<br />
on average, near 180 percent of the<br />
poverty level. Each group answered<br />
Table 1. Descriptive statistics <strong>for</strong> single elderly women<br />
Variables Total 1 Rural 1 Nonrural 1<br />
Mean<br />
Continuous<br />
<strong>Nutrition</strong> knowledge test 8.0 8.2 7.9<br />
(number correct of a possible 13)<br />
Income (% of poverty level) 184.9 182.4 185.9<br />
Age (years) 73.6 74.7 73.2<br />
Percent<br />
Categorical<br />
Education<br />
Less than high school 40 45 37<br />
High school 30 26 32<br />
Some college 17 14 18<br />
College 13 15 13<br />
Race<br />
White 85 94.5 81<br />
Black 13 5 16<br />
Asian <strong>and</strong> Pacific Isl<strong>and</strong>er 0.5 0 1<br />
Other 2 1.5 0.5 3<br />
Region<br />
Northeast 23 11 28<br />
South 33 43 28<br />
Midwest 30 38 27<br />
West 14 8 17<br />
Employment<br />
Full-time 2 1 2<br />
Part-time 8 11 7<br />
Not working 90 88 91<br />
Receipt of food stamps<br />
Yes 8 5 9<br />
No 92 95 91<br />
Importance of nutrition<br />
Very important 74 75 73<br />
All other responses 3 26 25 27<br />
Importance of taste<br />
Very important 86 87 85<br />
All other responses 3 14 13 15<br />
Importance of food not spoiling<br />
Very important 73 78 70<br />
All other responses 3 27 22 30<br />
Importance of easy preparation of food<br />
Very important 42 39 43<br />
All other responses 3 58 61 57<br />
Use nutrition labels<br />
Use often (always) 34 35 38<br />
All other responses 4 66 65 62<br />
Main responsibility <strong>for</strong> meals<br />
Yes 90 91 90<br />
No 10 9 10<br />
Take vitamins daily<br />
Yes 46 44 47<br />
No 54 56 53<br />
1 Sample size: total = 732, rural = 218, <strong>and</strong> nonrural = 514.<br />
2 Native American, Alaskan Native, <strong>and</strong> other races.<br />
3 Somewhat important, not too important, not at all important, don’t know.<br />
4 Sometimes, rarely, never.<br />
2003 Vol. 15 No. 1 77
Table 2. Components of the RDA Index <strong>for</strong> single elderly women<br />
Total 1 Rural 1 Nonrural 1<br />
Nutrient Mean percent Percent of sample Mean percent Percent of sample Mean percent Percent of sample<br />
percent RDA of RDA meeting RDA of RDA meeting RDA of RDA meeting RDA<br />
Food energy (kcal) 84 27 84 27 84 27<br />
Protein (g) 148 69 146 65 149 71<br />
Vitamin A (Fg) 165 48 143 40 175 51<br />
Vitamin E (mg) 86 28 84 28 86 28<br />
Vitamin C (mg) 167 57 135 50 180 61<br />
Thiamin (mg) 138 65 142 64 137 66<br />
Riboflavin (mg) 145 66 144 64 145 67<br />
Niacin (mg) 146 68 148 65 146 70<br />
Vitamin B 6<br />
(mg) 102 42 99 39 103 44<br />
Folate (Fg) 158 60 153 56 161 61<br />
Vitamin B 12<br />
(Fg) 287 71 281 69 290 72<br />
Calcium (mg) 90 36 85 33 92 38<br />
Phosphorus (mg) 138 71 137 69 139 72<br />
Magnesium (mg) 99 34 97 33 100 35<br />
Iron (mg) 140 60 143 62 138 60<br />
Zinc (mg) 76 20 78 21 75 21<br />
RDA Index (of a possible 16) 8.3 7.9 8.4<br />
1 Sample size: total = 732, rural = 218, <strong>and</strong> nonrural = 514.<br />
Note: Means under 100 percent indicate underconsumption according to the RDA; means at or above 100 percent indicate adequate consumption.<br />
Underreporting, if present, would understate the true value.<br />
Rural residents had lower average<br />
nutrient consumption levels,<br />
measured as a percentage of<br />
RDA, <strong>for</strong> protein, seven vitamins<br />
(A, C, E, B 6<br />
, B 12<br />
, riboflavin,<br />
<strong>and</strong> folate) <strong>and</strong> three minerals<br />
(calcium, phosphorus, <strong>and</strong><br />
magnesium).<br />
8 of the 13 nutrition knowledge items<br />
correctly.<br />
Nutrient scores as a percentage of the<br />
RDAs were lower <strong>for</strong> rural residents,<br />
compared with those of nonrural<br />
residents (table 2). Rural residents had<br />
lower average nutrient consumption<br />
levels, measured as a percentage of<br />
RDA, <strong>for</strong> protein, seven vitamins (A,<br />
C, E, B 6<br />
, B 12<br />
, riboflavin, <strong>and</strong> folate) <strong>and</strong><br />
three minerals (calcium, phosphorus,<br />
<strong>and</strong> magnesium). The proportion of<br />
the rural sample that met the RDA <strong>for</strong><br />
specific nutrients lagged behind that of<br />
the nonrural sample <strong>for</strong> protein <strong>and</strong> the<br />
same vitamins (except vitamin E) <strong>and</strong><br />
minerals, plus thiamin <strong>and</strong> niacin. For<br />
many of these nutrients, however, the<br />
differences between rural <strong>and</strong> nonrural<br />
residents were rather small in practical<br />
terms. The average score on the RDA<br />
index was lower <strong>for</strong> rural residents,<br />
compared with the average score <strong>for</strong><br />
nonrural residents: 7.9 vs. 8.4 (of a<br />
possible 16). However, the general<br />
pattern of average nutrient consumption<br />
levels, measured as a percentage<br />
of the RDAs, was the same <strong>for</strong> both<br />
rural <strong>and</strong> nonrural residents. For<br />
example, the percentage of the RDA<br />
<strong>for</strong> protein <strong>for</strong> both groups was over<br />
100, while the percentage <strong>for</strong> vitamin E<br />
was less than 100 <strong>for</strong> both groups.<br />
A slightly higher proportion of<br />
nonrural residents, than their rural<br />
counterparts, reported low-calorie, lowsodium,<br />
or high-fiber diet restrictions,<br />
whereas, an equal proportion of rural<br />
<strong>and</strong> nonrural residents reported having<br />
a lowfat or diabetic diet (table 3). A<br />
larger proportion of rural residents<br />
had been diagnosed as having heart<br />
disease, cancer, or osteoporosis, while<br />
a slightly larger proportion of nonrural<br />
78 Family Economics <strong>and</strong> <strong>Nutrition</strong> Review
Table 3. Diet <strong>and</strong> disease restrictions <strong>for</strong> single elderly women<br />
Variable Total 1 Rural 1 Nonrural 1<br />
Percent<br />
Diet restrictions 26 23 26<br />
Lowfat 4 4 4<br />
Low calorie 14 12 14<br />
Low sodium 9 7 10<br />
High fiber 3 1 3<br />
Diabetic 7 7 7<br />
Diagnosed diseases<br />
Circulatory 69 71 68<br />
High blood pressure 51 51 51<br />
Heart disease 23 27 21<br />
High blood cholesterol 30 29 31<br />
Stroke 7 6 8<br />
Diabetes 14 14 15<br />
Cancer 12 17 9<br />
Osteoporosis 13 13 12<br />
Study findings indicate that<br />
single elderly women’s economic<br />
resources are more important<br />
than knowledge resources in<br />
attaining adequate nutrition.<br />
1 Sample size: total = 732, rural = 218, <strong>and</strong> nonrural = 514.<br />
residents reported diagnosis of high<br />
blood cholesterol, stroke, or diabetes.<br />
Both rural <strong>and</strong> nonrural residents had<br />
equal rates of diagnosed high blood<br />
pressure (51 percent).<br />
Results of the multivariate analysis<br />
indicate that economic resources, <strong>and</strong><br />
various constraining <strong>and</strong> facilitating<br />
conditions were significant in explaining<br />
variation in nutritional adequacy<br />
among single women age 65<br />
<strong>and</strong> older (table 4). In rank order of<br />
importance, the significant factors<br />
were Midwest residence, taking a<br />
daily multivitamin/multimineral,<br />
employment (full or part time), income<br />
as a percent of poverty, presence of<br />
circulatory disease, receipt of food<br />
stamps, <strong>and</strong> rural residence. In terms<br />
of direction of association, Midwest<br />
residence, taking a daily multivitamin/<br />
multimineral, higher levels of income,<br />
<strong>and</strong> presence of circulatory disease<br />
were associated with higher levels of<br />
nutritional adequacy. Employment,<br />
receiving food stamps, <strong>and</strong> rural<br />
residence, however, were associated<br />
with lower levels of nutritional<br />
adequacy.<br />
Discussion <strong>and</strong> Implications<br />
Study findings indicate that single<br />
elderly women’s economic resources<br />
are more important than knowledge<br />
resources in attaining adequate<br />
nutrition. The positive relationship<br />
between income <strong>and</strong> nutrition<br />
adequacy is consistent with previous<br />
research (Brown, 1987; Sahyoun &<br />
Basiotis, 2001; Hendy et al., 1998;<br />
Qu<strong>and</strong>t & Rao, 1999; Quinn et al., 1997)<br />
<strong>and</strong> with the idea that a higher quality<br />
diet costs more (Blaylock et al., 1999).<br />
It is reasonable to expect that those<br />
with limited resources would benefit<br />
from the Federal Food Stamp Program.<br />
Thus, the negative relationship<br />
between receipt of food stamps <strong>and</strong><br />
nutrition adequacy is contrary to what<br />
would be expected. It could be that, as<br />
Shotl<strong>and</strong> <strong>and</strong> Loonin (1988) contend,<br />
benefit levels are too low to really meet<br />
the need. It certainly appears that,<br />
<strong>for</strong> whatever reason, food stamp<br />
participants in this sample still do not<br />
acquire the quantity <strong>and</strong> quality of<br />
food necessary to get adequate<br />
2003 Vol. 15 No. 1 79
nutrition. Further research is needed to<br />
examine why this is the case.<br />
As might be expected, nutritional<br />
adequacy is improved by taking<br />
supplemental multivitamins/<br />
multiminerals. Among disease<br />
diagnoses, the strong <strong>and</strong> significant<br />
effect of circulatory disease upon<br />
improved diet may reflect the enhanced<br />
potential benefit from changing<br />
behavior in the present, in contrast to<br />
the nonsignificant (<strong>and</strong> negative) effect<br />
of a cancer diagnosis on diet quality.<br />
Diet restrictions <strong>and</strong> disease diagnoses<br />
other than circulatory disease were not<br />
significant factors in this study.<br />
Rural <strong>and</strong> lower income single elderly<br />
women were significantly less likely to<br />
eat a nutritionally adequate diet than<br />
were their nonrural <strong>and</strong> higher income<br />
counterparts. Lack of nearby supermarkets<br />
with an adequate selection of<br />
healthful foods or access to support<br />
programs such as Meals-on-Wheels<br />
may also serve as important constraints<br />
to healthful eating <strong>for</strong> the rural elderly.<br />
Insufficient funds constrain purchase<br />
of more foods <strong>and</strong> better quality foods.<br />
Single elderly women who work are<br />
less likely to eat a nutritious diet—<br />
perhaps because of constraints on<br />
time <strong>and</strong> lower levels of economic<br />
resources. It is not known whether<br />
employment of survey respondents<br />
is by choice or necessity. This issue<br />
warrants further research given<br />
expectations that aging baby boomers<br />
will maintain some attachment to the<br />
labor market as they enter their elder<br />
years. The negative relationship<br />
between receiving food stamps <strong>and</strong><br />
meeting the RDAs may be attributed<br />
to low levels of accumulated financial<br />
resources—since eligibility is a<br />
function of both income <strong>and</strong> wealth.<br />
It also may reflect the quality of food<br />
obtained.<br />
Table 4. Regression results, RDA index value <strong>for</strong> single elderly women<br />
Parameter St<strong>and</strong>ardized Rank<br />
Variables estimate estimate order<br />
Resources<br />
Education (reference category < high school)<br />
High school -0.5051 -0.0496<br />
Some college 0.8317 0.0661<br />
College 0.6752 0.0494<br />
<strong>Nutrition</strong> knowledge test score 0.0095 0.0051<br />
Income (% of poverty) 0.0044* 0.0828 4<br />
Food stamp recipient -1.2451* -0.0708 6<br />
Management<br />
Attitudes<br />
Importance when selecting foods<br />
<strong>Nutrition</strong> 0.0683 0.0064<br />
Food not spoiling 0.2239 0.0213<br />
Ease of preparation -0.2048 -0.0216<br />
Taste -0.1951 -0.0146<br />
Behavior<br />
Always use nutrition labels -0.3505 -0.0363<br />
Responsible <strong>for</strong> preparing meals 0.0483 0.0031<br />
Constraints/Facilitators<br />
Diet restrictions<br />
Lowfat -0.0541 -0.0040<br />
Low-calorie 0.1590 0.0069<br />
Low-sodium -1.0314 -0.0640<br />
High-fiber 1.8519 0.0630<br />
Diabetic 0.5415 0.0300<br />
Diagnosed with disease<br />
Circulatory 0.7937** 0.0788 5<br />
Diabetes 0.5065 0.0380<br />
Cancer -0.5059 -0.0347<br />
Osteoporosis -0.2433 -0.0173<br />
Work (full time or part time) -1.4574** -0.0945 3<br />
Rural -0.7232* -0.0707 7<br />
Take daily vitamins 0.9385** 0.1000 2<br />
Control variables<br />
Age -0.0235 -0.0335<br />
Black -0.6682 -0.0480<br />
Region (reference=South)<br />
Northeast -0.1499 -0.0135<br />
Midwest 1.2323** 0.1210 1<br />
West 0.4313 0.0319<br />
Intercept 8.3533** R 2 =0.0916<br />
*Significant at 0.10 level.<br />
**Significant at 0.05 level.<br />
***Significant at 0.001 level.<br />
n=732.<br />
80 Family Economics <strong>and</strong> <strong>Nutrition</strong> Review
In 1994, Midwest consumers faced<br />
food prices that were 7.7 percent lower<br />
than those in the Northeast, 3.9 percent<br />
lower than those in the West, <strong>and</strong> less<br />
than 1 percent lower than those in the<br />
South (U.S. Department of Labor, 2002).<br />
This may help explain the strong<br />
relationship between Midwest<br />
residence <strong>and</strong> meeting the RDAs.<br />
The availability of nutrient-dense<br />
foods, proximity to local farmers’<br />
markets, as well as cultural <strong>and</strong> social<br />
differences within the region, also may<br />
help account <strong>for</strong> more nutritious diets.<br />
Our study suggests that single elderly<br />
women can be found on at least one<br />
of the four “pathways” to nutritional<br />
inadequacy—namely lack of access to<br />
necessary resources—as identified by<br />
Schoenberg (2000). Results confirm the<br />
importance of providing healthful meal<br />
options <strong>for</strong> single elderly women who<br />
face fewer financial resources, reduced<br />
mobility, or higher costs associated<br />
with obtaining food.<br />
References<br />
Bianchetti, A., Rozzini, R., Carabellese, C., Zanetti, O., & Trabucchi, M. (1990).<br />
<strong>Nutrition</strong>al intake, socioeconomic conditions, <strong>and</strong> health status in a large elderly<br />
population. Journal of the American Geriatrics Society, 38(5), 521-526.<br />
Blaylock, J., Smallwood, D., Kassel, K., Variyam, J., & Aldrich, L. (1999).<br />
Economics, food choices, <strong>and</strong> nutrition. Food <strong>Policy</strong>, 24, 269-286.<br />
Brown, J.L. (1987). Hunger in the U.S. Scientific American, 256(2), 37-41.<br />
Deacon, R., & Firebaugh, F. (1988). Family Resource Management: Principles<br />
<strong>and</strong> Applications, (2 nd ed.). Needham Heights, MA: Allyn <strong>and</strong> Bacon, Inc.<br />
Dewitt, S., Douglas, B., & Matre, M. (1989). <strong>Nutrition</strong> among the elderly in Mobile<br />
County, Alabama. Paper presented at the North Central Sociological Association.<br />
Dixon, L.B., Cronin, F.J., & Krebs-Smith, S.M. (2001). Let the food pyramid<br />
guide your food choices: Capturing the total diet concept. Journal of <strong>Nutrition</strong>,<br />
131, 461S-472S.<br />
Doan, R.M. (1990). The effect of social support on the health <strong>and</strong> nutrition of<br />
rural elderly. Paper presented at the Rural Sociological Society.<br />
Donald, E.A., Basu, T.K., Hargreaves, J.A., Thompson, G.W., Overton, T.R.,<br />
Peterson, R.D., et al. (1992). Dietary intake <strong>and</strong> biochemical status of a selected<br />
group of older Albertans taking or not taking micronutrient supplements. Journal<br />
of the Canadian Dietetic Association, 53(1), 39-43.<br />
Haller, J. (1999). The vitamin status <strong>and</strong> its adequacy in the elderly: An<br />
international overview. International Journal <strong>for</strong> Vitamin <strong>and</strong> <strong>Nutrition</strong> Research,<br />
69(3), 160-168.<br />
Hendy, H.M., Nelson, G.K., & Greco, M.E. (1998). Social cognitive predictors of<br />
nutritional risk in rural elderly adults. International Journal of Aging & Human<br />
Development, 47(4), 299-327.<br />
Herz, D.E. (1988). Employment characteristics of older women, 1987. Monthly<br />
Labor Review, 111(9), 3-12.<br />
Howard, J.H., Gates, G.E., Ellersieck, M.R., & Dowdy, R.P. (1998). Investigating<br />
relationships between nutritional knowledge, attitudes <strong>and</strong> beliefs, <strong>and</strong> dietary<br />
adequacy of the elderly. Journal of <strong>Nutrition</strong> <strong>for</strong> the <strong>Elderly</strong>, 18(4), 35-54.<br />
Lee, C.J., Templeton, S.B., Marlette, M., Walker, R.S., & Fahm, E.G. (1998). Diet<br />
quality <strong>and</strong> nutrient intakes of Black southern rural elderly. Journal of <strong>Nutrition</strong><br />
<strong>for</strong> the <strong>Elderly</strong>, 17(4), 1-15.<br />
National Academy of Sciences. (1989). Recommended Dietary Allowances, (10th<br />
ed.). Washington, DC: National Academy Press.<br />
2003 Vol. 15 No. 1 81
Nickols-Richardson, S.M., Johnson, M.A., Poon, L.W., & Martin, P. (1996).<br />
Demographic predictors of nutritional risk in elderly persons. Journal of Applied<br />
Gerontology, 15(3), 361-375.<br />
Purcell, P.J. (2000). Older workers: Employment <strong>and</strong> retirement trends. Monthly<br />
Labor Review, 123(10), 19-30.<br />
Qu<strong>and</strong>t, S.A., & Rao, P. (1999). Hunger <strong>and</strong> food security among older adults in a<br />
rural community. Human Organization, 58(1), 28-35.<br />
Qu<strong>and</strong>t, S.A., & Chao, D. (2000). Gender differences in nutritional risk among<br />
older rural adults. Journal of Applied Gerontology, 19(2), 128-150.<br />
Quinn, M.E., Johnson, M.A., Poon, L.W., Martin, P., & Nickols-Richardson, S.M.<br />
(1997). Factors of nutritional health-seeking behaviors: Findings from the Georgia<br />
Centenarian study. Journal of Aging <strong>and</strong> Health, 9(1), 90-104.<br />
Sahyoun, N., & Basiotis, P. (2001). Food insufficiency <strong>and</strong> the nutritional status<br />
of the elderly population. Family Economics <strong>and</strong> <strong>Nutrition</strong> Review, 13(2), 58-60.<br />
Schoenberg, N.E. (2000). Patterns, factors, <strong>and</strong> pathways contributing to<br />
nutritional risk among rural African American elders. Human Organization,<br />
59(2), 234-244.<br />
Shifflett, P.A., & McIntosh, W.A. (1983). Interrelations among instrumental <strong>for</strong>ms<br />
of social support <strong>and</strong> their impact on the diet of the elderly. Paper presented at the<br />
Rural Sociological Society.<br />
Shotl<strong>and</strong>, J., & Loonin, D. (1988). Patterns of Risk: <strong>Nutrition</strong>al Status of the<br />
Rural Poor. Washington, DC: Public Voice <strong>for</strong> Food <strong>and</strong> Health <strong>Policy</strong>.<br />
U.S. Department of Commerce. (1995). 65 plus in the United States. U.S.<br />
Department of Commerce, Bureau of the Census, Economics <strong>and</strong> Statistics<br />
Administration. [on-line] www.census.gov/socdemo/www/agebrief.html<br />
U.S. Department of Labor. (2002). Consumer Price Index—All Urban Consumers<br />
(current series). U.S. Bureau of Labor Statistics, Division of Consumer Prices <strong>and</strong><br />
Price Indexes. Retrieved March 27, 2002, from http://data.bls.gov/cgi-gin/<br />
surveymost?cu.<br />
Walker, D., & Beauchene, R.E. (1991). The relationship of loneliness, social<br />
isolation, <strong>and</strong> physical health to dietary adequacy of independently living elderly.<br />
Journal of the American Dietetic Association, 9(3), 300-306.<br />
Wallace, D.C., Pascarella, M.J., & Campanella-Voica, D. (1997). <strong>Nutrition</strong>al<br />
service use among rural elders. Journal of <strong>Nutrition</strong> <strong>for</strong> the <strong>Elderly</strong>, 16(4), 1-15.<br />
82 Family Economics <strong>and</strong> <strong>Nutrition</strong> Review
Reduction in Modifiable<br />
Osteoporosis-Related Risk Factors<br />
Among Adults in the Older<br />
Americans <strong>Nutrition</strong> Program<br />
J.M.K. Cheong, MS<br />
M.A. Johnson, PhD<br />
R.D. Lewis, PhD<br />
J.G. Fischer, PhD<br />
J.T. Johnson, PharmD<br />
The University of Georgia<br />
The purpose of this study was to determine the prevalence of low bone mineral<br />
density, the prevalence of modifiable osteoporosis-related risk factors, <strong>and</strong> the<br />
effectiveness of a nutrition <strong>and</strong> bone health education intervention that is tailored<br />
<strong>for</strong> a multiethnic (Caucasian <strong>and</strong> African American), low-income, low-literacy<br />
elderly population. The six risk factors were low intake of eight calcium-rich<br />
foods (less than 3 servings/day), nonuse of calcium supplements, nonuse of<br />
vitamin D-containing supplements, low physical activity (less than 5 times/week<br />
<strong>and</strong> less than 150 minutes/week), one or more of four risks <strong>for</strong> falling in the<br />
home, <strong>and</strong> current tobacco use. The 71 participants were a convenience<br />
sample from the Northeast Georgia Older Americans <strong>Nutrition</strong> Program who<br />
received Title III-C or Title III-D services. Fifty-nine completed heel bone mineral<br />
density tests at baseline <strong>and</strong> osteoporosis risk assessment questionnaires both<br />
at baseline <strong>and</strong> post-intervention. At baseline, 60 percent of the adults had<br />
either osteoporosis or osteopenia, <strong>and</strong> African-American women had more<br />
osteoporosis-related risk factors than did Caucasian women. After the intervention,<br />
the number of risk factors decreased significantly by 0.8, <strong>and</strong> over half<br />
of the participants decreased at least one risk factor. Additionally, the number of<br />
participants who consumed 3 or more servings of calcium-rich foods daily or<br />
used a calcium supplement more than doubled.<br />
O<br />
steoporosis is a major public<br />
health threat that is largely<br />
preventable (National Institutes<br />
of Health [NIH], 2001). In the United<br />
States, 10 million people have osteoporosis,<br />
<strong>and</strong> another 18 million have<br />
osteopenia—low bone mass that<br />
increases the risk <strong>for</strong> osteoporosis<br />
(NIH, 2001). Consequences of osteoporosis<br />
include chronic pain, bone<br />
fractures, need <strong>for</strong> placement into<br />
long-term care facilities, <strong>and</strong> death<br />
(NIH, 2001).<br />
Because of the high prevalence <strong>and</strong><br />
debilitating consequences of osteoporosis<br />
<strong>and</strong> bone fractures, we developed<br />
an educational intervention<br />
related to nutrition <strong>and</strong> bone health<br />
that was targeted to participants in the<br />
Older Americans <strong>Nutrition</strong> Program<br />
(OANP). Formerly known as the <strong>Elderly</strong><br />
<strong>Nutrition</strong> Program, OANP is the largest<br />
community nutrition program <strong>for</strong> older<br />
adults in the Nation, serving about 7<br />
percent of the older population overall<br />
<strong>and</strong> about 20 percent of the poor elders<br />
(Administration on Aging, 2002; Millen,<br />
Ohls, Ponza, & McCool, 2002). This<br />
program provides nutrition education,<br />
as well as congregate <strong>and</strong> homedelivered<br />
meal services.<br />
The educational messages in this<br />
intervention were developed from<br />
recommendations of the 2000 NIH<br />
2003 Vol. 15 No. 1 83
Consensus Development Panel on<br />
Osteoporosis Prevention, Diagnosis,<br />
<strong>and</strong> Therapy (NIH, 2001). From a review<br />
of 2,449 references from 1995 to 1999,<br />
the panel identified several modifiable<br />
risk factors <strong>for</strong> osteoporosis <strong>and</strong> bone<br />
fractures, including smoking, a low<br />
level of physical activity, risk of falling,<br />
<strong>and</strong> low intakes of calcium <strong>and</strong> vitamin<br />
D. Further evidence that smoking <strong>and</strong><br />
use of smokeless tobacco are risk<br />
factors was recently reviewed<br />
(Spangler, Qu<strong>and</strong>t, & Bell, 2001).<br />
Although NIH did not make a specific<br />
recommendation <strong>for</strong> physical activity<br />
<strong>and</strong> the prevention of osteoporosis <strong>and</strong><br />
fractures, several health organizations<br />
<strong>and</strong> experts recommend 30 minutes or<br />
more physical activity most days of the<br />
week (about 30 minutes on 5 days of<br />
the week <strong>and</strong> about 150 minutes<br />
weekly) (American College of Sports<br />
Medicine, 2002; U.S. Department of<br />
Health <strong>and</strong> Human Services [DHHS],<br />
2000; DiPietro, 2001; <strong>US</strong>DA & DHHS,<br />
2000). The NIH panel (2001) emphasized<br />
that exercise may decrease the<br />
risk of falling. This focus on exercise<br />
is critical because most (90 percent)<br />
hip fractures are associated with a fall<br />
(Carter, Kannus, & Khan, 2001). Both<br />
the NIH (2001) <strong>and</strong> the National<br />
Osteoporosis Foundation (NOF, 2002)<br />
recommend fall-prevention techniques<br />
in the home such as: removing throw<br />
rugs, anchoring rugs with nonskid<br />
tape, installing grab bars <strong>and</strong> stair rails,<br />
<strong>and</strong> using night-lights. These types of<br />
interventions have reduced the number<br />
of falls (Plautz, Beck, Selmar, &<br />
Radetsky, 1996).<br />
Vitamin D is unique because it can<br />
be obtained both via skin exposure<br />
to sunlight <strong>and</strong> through food or<br />
supplements. Like all other vitamins<br />
<strong>and</strong> minerals, calcium is available<br />
only through food or supplements.<br />
Although calcium- <strong>and</strong> vitamin D-rich<br />
foods (e.g., dairy products) are the<br />
preferred source of dietary calcium<br />
<strong>and</strong> vitamin D, several organizations<br />
suggest that older people may need<br />
supplements to meet their high needs<br />
<strong>for</strong> these nutrients (NAS, 1997; NIH,<br />
2001; <strong>US</strong>DA & DHHS, 2000). The<br />
ability to synthesize vitamin D in the<br />
skin by sun exposure declines with age<br />
<strong>and</strong> is blocked by sunscreen in people<br />
regardless of their age (NAS, 1997).<br />
The Adequate Intake (AI) level <strong>for</strong><br />
vitamin D (600 International Units [IU]<br />
or 15 mg) <strong>for</strong> those over 70 years old<br />
is often difficult to achieve. With the<br />
exception of milk, which is <strong>for</strong>tified<br />
in the United States with 400 IU of<br />
vitamin D per quart (Institute of<br />
Medicine, 1997), very few foods<br />
contain vitamin D in significant<br />
quantities. Consequently, relying on<br />
milk alone would require 6 cups of milk<br />
per day to meet the recommendation.<br />
Perceived milk intolerance—defined as<br />
experiencing stomach ache, flatulence,<br />
or diarrhea after drinking milk—is much<br />
higher in African Americans than in<br />
Caucasians <strong>and</strong> is a significant<br />
predictor of low milk intake in older<br />
adults (Elbon, Johnson, & Fischer,<br />
1998). The 2000 Dietary Guidelines<br />
<strong>for</strong> Americans states that “people who<br />
seldom eat dairy products or other<br />
rich sources of calcium need a calcium<br />
supplement” <strong>and</strong> that “older adults <strong>and</strong><br />
people with little exposure to sunlight<br />
may need a vitamin D supplement”<br />
(<strong>US</strong>DA & DHHS, 2000).<br />
NIH notes that the effects of most<br />
medications <strong>for</strong> osteoporosis are<br />
evaluated in conjunction with calcium<br />
<strong>and</strong> vitamin D supplements. Clinical<br />
trials confirm that increased milk<br />
consumption to 3 to 4 servings per<br />
day slows bone loss in older men <strong>and</strong><br />
women (Heaney et al., 1999; Storm et<br />
al., 1998). Clinical trials also confirm the<br />
effectiveness of vitamin D (700 to 800<br />
IU/day) <strong>and</strong> calcium supplements (500<br />
to 800 mg/day) <strong>for</strong> preventing fractures<br />
in older people (Chapuy et al., 1992;<br />
Dawson-Hughes, Harris, Krall, & Dallal,<br />
1997).<br />
Based on a review of the literature, we<br />
have found no systematic evaluation of<br />
osteoporosis risk or health promotion<br />
programs designed to reduce that risk<br />
among OANP participants. However,<br />
others have found that nutrition<br />
education intervention results in<br />
changes in knowledge <strong>and</strong> beliefs<br />
about osteoporosis (Blalock et al.,<br />
2000), nutrition (McCamey et al., 2003),<br />
<strong>and</strong> calcium <strong>and</strong> vitamin D intakes<br />
(Rolnick , Kopher, Jackson, Fischer,<br />
& Compo, 2001).<br />
This study investigated the prevalence<br />
of low bone mineral density (BMD) as<br />
estimated by the heel BMD test; the<br />
prevalence of modifiable osteoporosisrelated<br />
risk factors; <strong>and</strong> the effectiveness<br />
of an educational intervention<br />
related to nutrition <strong>and</strong> bone health<br />
that is tailored <strong>for</strong> a multiethnic<br />
(Caucasian <strong>and</strong> African American),<br />
low-income, <strong>and</strong> low-literacy elderly<br />
population. For the purposes of this<br />
study, the primary measurable outcome<br />
was a change in these six risk factors.<br />
These include the factors identified<br />
previously by NIH.<br />
Methods<br />
Data <strong>and</strong> Sample<br />
This was a convenience sample of<br />
participants from senior centers in four<br />
counties in Georgia, with no exclusion<br />
criteria. Counties were included<br />
because of interest in the project <strong>and</strong><br />
availability of participants. Potential<br />
sample size was limited because these<br />
were small centers located in rural<br />
areas. Participants were recruited<br />
through the directors of the senior<br />
centers who helped with advertising<br />
<strong>and</strong> enrollment.<br />
84 Family Economics <strong>and</strong> <strong>Nutrition</strong> Review
Baseline<br />
At baseline, heel BMD, weight, <strong>and</strong><br />
height were assessed, <strong>and</strong> participants<br />
answered nutrition <strong>and</strong> health questions<br />
(in no particular order). Heel BMD was<br />
determined with an ultrasound bone<br />
densitometer. 1 A T-score 2 was derived<br />
by comparing each participant’s BMD<br />
with the optimal <strong>and</strong> peak BMD of<br />
a 30-year-old healthy adult. Each<br />
participant received a copy <strong>and</strong> an<br />
explanation of his or her BMD results<br />
(low risk, moderate risk, or high risk<br />
<strong>for</strong> osteoporosis) <strong>and</strong> was strongly<br />
encouraged to take the results to his or<br />
her healthcare provider. Because heel<br />
BMD takes 2 to 3 years to demonstrate<br />
improvement by using the ultrasound<br />
bone densitometer, it was assessed at<br />
baseline only <strong>and</strong> thus not used as an<br />
outcome measure.<br />
Health Education Curriculum<br />
The health education curriculum,<br />
developed <strong>and</strong> modified by five<br />
nutrition <strong>and</strong> pharmacy experts at the<br />
University of Georgia, consisted of<br />
three lessons. The first lesson covered<br />
the definition of osteoporosis, key<br />
nonmodifiable <strong>and</strong> modifiable risk<br />
factors <strong>for</strong> osteoporosis <strong>and</strong> bone<br />
fractures (including tobacco use), <strong>and</strong><br />
balance exercises. The second lesson<br />
covered sources of calcium <strong>and</strong> vitamin<br />
D, including foods that are naturally<br />
rich in calcium, low-lactose dairy<br />
foods <strong>and</strong> use of the lactase enzyme,<br />
calcium-<strong>for</strong>tified foods, <strong>and</strong> calcium<br />
<strong>and</strong> vitamin D supplements. To<br />
encourage a possible new food source<br />
of calcium, those presenting the lessons<br />
gave participants the opportunity to<br />
taste calcium-<strong>for</strong>tified orange juice.<br />
The third lesson reviewed ways to<br />
reduce falls, as well as medications<br />
that may be beneficial <strong>for</strong> bone health.<br />
1 Hologic Sahara Clinical Bone Sonometer,<br />
Bed<strong>for</strong>d, MA, 2000.<br />
2 T-score expresses the number of st<strong>and</strong>ard<br />
deviations from the mean score <strong>for</strong> the<br />
young adult population (Hologic, 2000).<br />
All participants per<strong>for</strong>med balance<br />
exercises from the NIH Osteoporosis<br />
<strong>and</strong> Related Bone Diseases National<br />
Resource <strong>Center</strong> at each lesson. 3<br />
The four messages of this educational<br />
intervention were emphasized in each<br />
lesson: (1) Talk to Your Doctor:<br />
tobacco <strong>and</strong> smoking cessation,<br />
medications, <strong>and</strong> heel BMD results;<br />
(2) Increase Sources of Calcium <strong>and</strong><br />
Vitamin D: dietary sources, <strong>for</strong>tified<br />
foods, <strong>and</strong> dietary supplements;<br />
(3) Take Action: increase physical<br />
activity; <strong>and</strong> (4) Take Care: fallprevention<br />
measures.<br />
Post-Intervention<br />
We administered a post-test about<br />
1 month after completion of the<br />
third lesson to assess participants’<br />
behavioral changes. The questionnaire<br />
contained items that were based on<br />
past nutrition questionnaires developed<br />
<strong>for</strong> this population (Brackett, 1999;<br />
Johnson et al., 2003), as well as<br />
issues related to nonmodifiable <strong>and</strong><br />
modifiable risk factors <strong>for</strong> osteoporosis<br />
<strong>and</strong> bone fractures (NIH, 2001). The<br />
questionnaire included items that<br />
were used to calculate a score <strong>for</strong> the<br />
modifiable osteoporosis-related risk<br />
factors score:<br />
(1) Low intake of calcium-rich<br />
foods⎯consuming less than<br />
3 servings of eight calcium-rich<br />
foods 4 /day.<br />
3 The lesson plans are available on the<br />
<strong>Nutrition</strong> <strong>for</strong> Older Adults’ Health Website:<br />
www.arches.uga.edu/~noahnet. The free,<br />
downloadable lesson plans consist of text <strong>and</strong><br />
script <strong>for</strong> the lessons, h<strong>and</strong>outs, materials <strong>for</strong><br />
overhead transparencies, pre- <strong>and</strong> post-tests, as<br />
well as references <strong>for</strong> additional reading about<br />
nutrition <strong>and</strong> bone health.<br />
4 The eight calcium-rich foods consisted of<br />
milk as a beverage; milk with cereal; yogurt;<br />
cheese; mustard, turnip, or collard greens;<br />
canned salmon; calcium-<strong>for</strong>tified orange<br />
juice; <strong>and</strong> calcium-<strong>for</strong>tified cereals.<br />
(2) Nonuse of calcium supplements⎯<br />
not taking a supplement with<br />
calcium. For the purposes of this<br />
study, a multivitamin supplement<br />
was not considered a calcium<br />
supplement.<br />
(3) Nonuse of vitamin D-containing<br />
supplements⎯not taking any<br />
supplement containing vitamin D.<br />
(4) Low physical activity⎯exercising<br />
less than 5 times/week <strong>and</strong> less<br />
than 150 minutes/week, regardless<br />
of intensity or type of exercise.<br />
(5) High risk of falling at home⎯at<br />
least one of the following risks:<br />
not anchoring throw rugs, not<br />
having grab bars in bathroom, not<br />
having nonskid tape or nonskid<br />
mat in tub or shower area, or not<br />
turning on the light or using a<br />
night-light when getting out of<br />
bed at night.<br />
(6) Current tobacco use.<br />
Other items assessed were medication<br />
history, family history of osteoporosis<br />
<strong>and</strong> bone fractures, medical conditions,<br />
medications, illnesses, osteoporosisrelated<br />
knowledge questions, menstruation<br />
history, <strong>and</strong> results from an<br />
orientation-memory-concentration<br />
(i.e., cognition) test. A panel of nutrition<br />
<strong>and</strong> pharmacy experts reviewed the<br />
questionnaire to increase face validity;<br />
modifications were made based on their<br />
recommendations. To help determine<br />
the reliability of the questionnaire <strong>for</strong><br />
this population, we administered it<br />
twice to the same participants both<br />
be<strong>for</strong>e <strong>and</strong> after the intervention.<br />
Participants were given a test to<br />
determine whether cognition was<br />
related to scores <strong>for</strong> modifiable<br />
osteoporosis-related risk factors.<br />
The cognition measure is a validated<br />
6-item tool that discriminates cognitive<br />
function as being normal or minimally<br />
impaired (score of 8 or less), moderately<br />
impaired (9 to 19), or severely<br />
impaired (20 or more) (Katzman et al.,<br />
2003 Vol. 15 No. 1 85
Table 1. Baseline assessments of heel bone mineral density, T-score, <strong>and</strong> osteoporosis: Adults in the Older Americans <strong>Nutrition</strong><br />
Program<br />
Total Caucasian African-American<br />
sample Men Women women women<br />
Sample size 70 7 63 42 21<br />
Mean<br />
Heel BMD 0.47 0.51 0.46 0.45 0.49<br />
T-score -1.03 0.67 -1.07 -1.20 -0.83<br />
Percent<br />
Osteoporosis risk<br />
Low risk 1 23 29 22 17 33<br />
Moderate risk 2 17 29 16 17 14<br />
High risk 3 60 43 62 67 52<br />
1 T-score > 0.<br />
2 T-score < 0 <strong>and</strong> > -1.0.<br />
3 T-score < -1.0.<br />
Notes: Percentages may not add to 100 percent because of rounding. Data were not statistically associated with gender or ethnicity.<br />
1983). Trained staff from the University<br />
of Georgia’s Department of Foods<br />
<strong>and</strong> <strong>Nutrition</strong> read the questions to<br />
the participants <strong>and</strong> recorded their<br />
responses. During the interview, the<br />
trained staff used food models to help<br />
the participants determine portion sizes<br />
<strong>and</strong> give a more accurate estimate of<br />
the amount of calcium- <strong>and</strong> vitamin D-<br />
rich foods they consumed.<br />
Statistical Analysis<br />
To ensure consistency in coding, only<br />
one person coded all questionnaires.<br />
After coded data were entered twice in<br />
two different files, discrepancies were<br />
corrected to reflect the participants’<br />
responses. Baseline <strong>and</strong> postintervention<br />
data were compared by<br />
using Chi-square analyses <strong>and</strong> paired<br />
t-tests to determine the statistical<br />
significance of changes in risk<br />
factors <strong>and</strong> other variables of interest;<br />
regression analyses were used to<br />
identify possible predictors of<br />
changes in risk factors scores.<br />
Results<br />
Of the 71 participants who enrolled<br />
at baseline, 70 had their heel BMD<br />
assessed, <strong>and</strong> 59 completed the<br />
intervention <strong>and</strong> the post-intervention<br />
questions. Of those who did not complete<br />
the post-intervention questions,<br />
5 were out of town, 4 stopped going to<br />
the senior center, 1 was not a regular<br />
senior center participant, 1 refused to<br />
complete the questionnaire, <strong>and</strong> 1 died.<br />
Among the 59 participants who completed<br />
the post-intervention questions,<br />
10 percent attended no lessons,<br />
25 percent attended one lesson,<br />
29 percent attended two lessons, <strong>and</strong><br />
36 percent attended all three lessons.<br />
The demographic characteristics of the<br />
attendees <strong>and</strong> non-attendees reflected<br />
those of the overall sample (77 years<br />
old, 90 to 93 percent female, 66 percent<br />
Caucasian, <strong>and</strong> 34 percent African<br />
American).<br />
The mean BMI <strong>for</strong> these groups<br />
was 29.2 (data not shown). According<br />
to Government guidelines, a BMI of<br />
29.2 is on the cusp of being overweight<br />
(BMI = 25 to 30) or obese (BMI greater<br />
than 30) (<strong>US</strong>DA & DHHS, 2000). Based<br />
on the BMD T-score, 60 percent of<br />
participants had either osteopenia or<br />
osteoporosis, 17 percent had moderate<br />
risk <strong>for</strong> a future bone fracture; 23<br />
percent, a low risk (table 1). These<br />
measures, however, were not significantly<br />
associated with gender<br />
or ethnicity.<br />
At baseline, all participants had at least<br />
one of the six modifiable osteoporosisrelated<br />
risk factors (table 2). The most<br />
prevalent was low intake of calciumrich<br />
foods (86 percent), <strong>and</strong> the least<br />
prevalent was current tobacco use<br />
(17 percent). At baseline, the various<br />
indices of risk factors were not<br />
significantly different between the<br />
total sample <strong>and</strong> the subgroup that<br />
completed the intervention. After the<br />
intervention, the total risk factors<br />
score (3.4), consumption of less than<br />
3 servings of eight calcium-rich foods<br />
daily (69 percent), <strong>and</strong> non-use of<br />
calcium supplements (53 percent)<br />
significantly decreased; more than half<br />
(52 percent) of the participants reduced<br />
one or more risk factors. Although<br />
86 Family Economics <strong>and</strong> <strong>Nutrition</strong> Review
Table 2. Baseline <strong>and</strong> post-intervention prevalence of modifiable osteoporosisrelated<br />
risk factors: Adults in the Older Americans <strong>Nutrition</strong> Program<br />
Baseline, Baseline,<br />
total completed Postsample<br />
intervention intervention<br />
Sample size 71 59 59<br />
Mean<br />
Number of risk factors* 4.0 4.2 3.4<br />
Weekly frequency of exercise* 4.2 4.6 5.4<br />
Percent<br />
Low intake of calcium-rich foods 1 * 86 88 69<br />
Non-use of a calcium supplements* 77 83 53<br />
Non-use of a vitamin D-containing supplements 65 68 54<br />
Low physical activity 2 83 85 80<br />
High risk of falling at home 3 75 78 71<br />
Current tobacco use 17 17 12<br />
Number of risk factors*<br />
0 0 0 0<br />
1 6 3 12<br />
2 8 7 10<br />
3 15 14 34<br />
4 28 29 17<br />
5 32 40 25<br />
6 10 8 2<br />
5 or more risk factors 42 48 27<br />
The major findings at baseline<br />
were that a substantial number<br />
of participants had osteopenia<br />
or osteoporosis based on their<br />
heel BMD results. After the<br />
intervention, participants<br />
significantly decreased their<br />
osteoporosis-related risk factors<br />
score <strong>and</strong> were more likely both<br />
to consume calcium-rich foods<br />
<strong>and</strong> to use calcium supplements.<br />
1 Less than 3 servings per day.<br />
2 Less than 5 times per week <strong>and</strong> less than 150 minutes per week.<br />
3 Equal to or greater than one of four risks <strong>for</strong> falling.<br />
* Statistically significant difference between baseline <strong>and</strong> post-intervention at p = .05.<br />
Note: Percentages may not add to 100 percent because of rounding.<br />
there was no change in exercise risk<br />
after the intervention, more than half<br />
(55 percent) of participants reported<br />
doing the balance exercises at home<br />
(table 3), <strong>and</strong> the frequency of exercise<br />
increased significantly by about 1 time<br />
per week (from 4.6 to 5.4 times per<br />
week) (table 2). In a multivariate<br />
stepwise regression model, change in<br />
risk factors score was not significantly<br />
associated with age, gender, ethnicity,<br />
attendance at lessons, cognition, or<br />
whether participants had been told by<br />
their doctor that they had osteoporosis<br />
(data not shown).<br />
We also explored ethnic differences<br />
between Caucasian <strong>and</strong> African-<br />
American women at baseline; there<br />
were too few men to make comparisons<br />
by gender. Compared with Caucasian<br />
women, African-American women had a<br />
significantly higher BMI (31.3 vs. 28.2)<br />
<strong>and</strong> were more likely to exercise less<br />
than 5 times per week <strong>and</strong> <strong>for</strong> less than<br />
150 minutes per week (100 vs. 79<br />
percent) (table 4). African-American<br />
women were also significantly more<br />
likely than Caucasian women not to<br />
use supplements: calcium (95 vs. 67<br />
percent) or vitamin D-containing<br />
(86 vs. 50 percent). Thus, African-<br />
American women had significantly<br />
2003 Vol. 15 No. 1 87
more risk factors than did Caucasian<br />
women (4.7 vs. 3.9).<br />
After the intervention, participants<br />
were asked whether they had made<br />
any changes related to osteoporosis<br />
risk since attending the educational<br />
lessons (table 3). Four of 10 reported<br />
that they had talked with their doctor<br />
about issues such as their heel BMD<br />
results <strong>and</strong> osteoporosis (41 percent<br />
each), a quarter had discussed prescription<br />
medications <strong>for</strong> osteoporosis,<br />
<strong>and</strong> about a quarter had discussed<br />
exercises <strong>for</strong> their bone health. A large<br />
number of participants increased their<br />
physical activity, practiced the balance<br />
exercises at home, <strong>and</strong> adopted at<br />
least one fall-prevention measure.<br />
Additionally, there were substantial<br />
increases in diet <strong>and</strong> supplement use,<br />
including eating more calcium-rich <strong>and</strong><br />
calcium-<strong>for</strong>tified foods, <strong>and</strong> starting to<br />
take supplements with either calcium or<br />
vitamin D. Despite a detailed discussion<br />
of low-lactose dairy foods, very<br />
few participants started using commercially<br />
available low-lactose milk<br />
(5 percent) or tried using lactase<br />
tablets or drops (2 percent).<br />
Discussion<br />
The nutrition <strong>and</strong> bone health<br />
curriculum that was designed <strong>for</strong><br />
low-literacy, low-income older adults<br />
reduced the number of modifiable<br />
osteoporosis-related risk factors <strong>and</strong><br />
was associated with other self-reported<br />
behavioral changes. The major findings<br />
at baseline were that a substantial<br />
number of participants had osteopenia<br />
or osteoporosis based on their heel<br />
BMD results. After the intervention,<br />
participants significantly decreased<br />
their osteoporosis-related risk factors<br />
score <strong>and</strong> were more likely both to<br />
consume calcium-rich foods <strong>and</strong> to use<br />
calcium supplements. However, the<br />
consumption of calcium-rich foods<br />
increased by a statistically significant,<br />
Table 3. Self-reported post-intervention changes related to modifiable osteoporosis-related<br />
risk factors: Adults in the Older Americans <strong>Nutrition</strong> Program<br />
but nutritionally small amount (2.5<br />
servings/week), translating to minor<br />
increases in daily calcium intake.<br />
There is a heightened awareness that<br />
African-American women are at risk<br />
<strong>for</strong> osteoporosis (Bohannon, 1999).<br />
Even though the mean heel BMD of<br />
women did not differ by ethnicity,<br />
it is possible that, compared with<br />
the Caucasian women, the African-<br />
American women in this study may<br />
be at somewhat higher future risk <strong>for</strong><br />
osteoporosis <strong>for</strong> two reasons: they<br />
were less likely to take a calcium<br />
supplement or any vitamin D-<br />
containing supplement, <strong>and</strong> they were<br />
more likely to have signs of lactose<br />
intolerance. However, our sample size<br />
was small, <strong>and</strong> it is not possible to<br />
reach a definitive conclusion on ethnic<br />
differences in the osteoporosis-risk<br />
profile of these participants.<br />
In addition to small sample size, there<br />
were other limitations in this study.<br />
Percent reporting<br />
risk factor<br />
Talked with doctor about<br />
BMD results 41<br />
Osteoporosis 41<br />
Prescription medications <strong>for</strong> osteoporosis 25<br />
Exercises <strong>for</strong> bone health 27<br />
Increased physical activity 39<br />
Practiced balance exercises at home 55<br />
Adopted at least one fall-prevention measure 34<br />
Dietary <strong>and</strong> supplement changes<br />
Ate more calcium-rich foods 30<br />
Ate more calcium-<strong>for</strong>tified foods 20<br />
Started taking calcium supplement 23<br />
Started taking vitamin D supplement 11<br />
Changed to low-lactose milk 5<br />
Tried lactase tablets or drops 2<br />
Note: n=59.<br />
The curriculum may not have<br />
accommodated varied levels of<br />
comprehension among the participants.<br />
Although we did not assess the<br />
educational level of this sample,<br />
we have found that the mean level<br />
of education is eighth grade in older<br />
adults receiving congregate meals<br />
from this same Area Agency on Aging<br />
(Brackett, 1999). To address concerns<br />
associated with comprehension, the<br />
educators reviewed <strong>and</strong> modified the<br />
curriculum be<strong>for</strong>e it was implemented.<br />
A question-<strong>and</strong>-answer period was<br />
included at the end of every lesson<br />
to allow participants to have their<br />
questions answered <strong>and</strong> to address<br />
issues that were not covered in the<br />
lessons. Also, not everyone attended<br />
all the lessons. To minimize the effect<br />
of absenteeism on behavior modification,<br />
instructors gave participants<br />
h<strong>and</strong>outs that repeated important<br />
concepts <strong>and</strong> emphasized selfempowerment.<br />
88 Family Economics <strong>and</strong> <strong>Nutrition</strong> Review
Table 4. Ethnic differences between Caucasian <strong>and</strong> African-American women at<br />
baseline: Adults in the Older Americans <strong>Nutrition</strong> Program<br />
Caucasian<br />
women<br />
African-American<br />
women<br />
Sample size 42 22<br />
Mean<br />
Age 76 76<br />
BMI* 28.2 31.3<br />
Percent<br />
Osteoporosis-related risk factors<br />
Low intake of calcium-rich foods 1 86 95<br />
Non-use of calcium supplements* 67 95<br />
Non-use of vitamin D-containing supplements* 50 86<br />
Low physical activity 2 * 79 100<br />
High risk of falling at home 3 83 63<br />
Current tobacco use 12 23<br />
Mean number of risk factors* 3.9 4.7<br />
1 Less than 3 servings per day.<br />
2 Less than 5 times per week <strong>and</strong> less than 150 minutes per week.<br />
3 Equal to or greater than one of four risks <strong>for</strong> falling.<br />
*Statistically significant difference between Caucasian <strong>and</strong> African-American women, at p = .05.<br />
As in most behavioral change studies,<br />
another limitation was that the<br />
behavioral changes were self-reported.<br />
Objective biological measures of<br />
nutrition <strong>and</strong> bone health were beyond<br />
the scope of this study but would be<br />
important <strong>for</strong> future study. Future<br />
studies are needed to determine the<br />
long-term effect of educational<br />
interventions <strong>and</strong> behavioral changes<br />
on osteoporosis, bone mass, <strong>and</strong><br />
incidence of bone fractures in older<br />
adults. Based on the limitations of this<br />
study, interpretation of the findings<br />
should not be applied to all Older<br />
Americans <strong>Nutrition</strong> Program<br />
participants, but can be used in<br />
planning, implementing, <strong>and</strong><br />
evaluating similar future studies.<br />
Acknowledgments<br />
This study was supported with<br />
Title III-C <strong>and</strong> Title III-D funds<br />
from the Northeast Georgia Regional<br />
Development <strong>Center</strong> <strong>and</strong> Area Agency<br />
on Aging, Georgia Department of<br />
Human Resources-<strong>US</strong>DA Food Stamp<br />
<strong>Nutrition</strong> Education Contracts (#427-<br />
93-11903 <strong>and</strong> #427-93-26056), <strong>and</strong><br />
Georgia Agricultural Experiment Station<br />
(#GEO00916).<br />
2003 Vol. 15 No. 1 89
References<br />
Administration on Aging. (2002). Older Americans Act <strong>Nutrition</strong> Program.<br />
Retrieved October 7, 2002, from http://www.aoa.gov/nutrition/default.htm.<br />
American College of Sports Medicine. (2002). ASCM Guidelines <strong>for</strong> Healthy<br />
Physical Activity. Retrieved October 7, 2002, from http://www.acsm.org/pdf/<br />
Guidelines.pdf.<br />
Blalock, S.J., Currey, S.S., DeVellis, R.F., DeVellis, B.M., Giorgino, K.B.,<br />
Anderson, J.J.B., et al. (2000). Effects of educational materials concerning<br />
osteoporosis on women’s knowledge, beliefs, <strong>and</strong> behavior. American Journal of<br />
Health <strong>Promotion</strong>, 14(3), 161-169.<br />
Bohannon, A.D. (1999). Osteoporosis <strong>and</strong> African-American women. Journal of<br />
Women’s Health <strong>and</strong> Gender-Based Medicine, 8(5), 609-615.<br />
Brackett ,W.R. (1999). <strong>Nutrition</strong>al Status of Participants of Northeast Georgia<br />
Senior <strong>Nutrition</strong> <strong>Center</strong>s. Masters Thesis, The University of Georgia, Athens, GA.<br />
Carter, N.D., Kannus, P., & Khan, K.M. (2001). Exercise in the prevention of falls<br />
in older people: A systematic literature review examining the rationale <strong>and</strong> the<br />
evidence. Sports Medicine, 31(6), 427-438.<br />
Chapuy, M.C., Arlot, M.E., Duboeuf, F., Brun, J., Crouzet, B., Arnaud, S., et al.<br />
(1992). Vitamin D 3<br />
<strong>and</strong> calcium to prevent hip fractures in the elderly women. New<br />
Engl<strong>and</strong> Journal of Medicine, 327(23), 1637-1642.<br />
Dawson-Hughes, B., Harris, S.S., Krall, E.A., & Dallal, G.E. (1997). Effect of<br />
calcium <strong>and</strong> vitamin D supplementation on bone density in men <strong>and</strong> women 65<br />
years of age or older. New Engl<strong>and</strong> Journal of Medicine, 337(10), 670-676.<br />
DiPietro, L. (2001). Physical activity in aging: Changes in patterns <strong>and</strong> their<br />
relationship to health <strong>and</strong> function. The Journals of Gerontology Series A:<br />
Biological Sciences <strong>and</strong> Medical Sciences, 56 (Special Issue, No. 2(2)), 13-22.<br />
Elbon, S.M., Johnson, M.A, & Fischer, J.G. (1998). Milk consumption in older<br />
Americans. American Journal of Public Health, 88(8), 1221-1224.<br />
Heaney, R.P., McCarron, D.A., Dawson-Hughes, B., Oparil, S., Berga, S.L.,<br />
Stern, J.S., et al. (1999). Dietary changes favorably affect bone remodeling in<br />
older adults. Journal of the American Dietetic Association, 99(19), 1228-1233.<br />
Hologic. (2000). Sahara® Clinical Bone Sonometer. Retrieved October 7, 2002,<br />
from http://www.hologic.com/prod-bd/pdf/broch-sahara.pdf.<br />
Hologic. (2002). Sahara® Frequently Asked Questions. Retrieved October 7,<br />
2002, from http://www.hologic.com/service/faqsahara.shtml.<br />
Johnson, M.A., Brackett, W.R., Fischer, J.G., Gunter, E.W., Allen, R.H., &<br />
Stabler, S.P. (2003). Hyperhomocysteinemia <strong>and</strong> vitamin B 12<br />
deficiency in elders<br />
using Title IIIc <strong>Nutrition</strong> Services, American Journal of Clinical <strong>Nutrition</strong>, 77(1),<br />
211-220.<br />
90 Family Economics <strong>and</strong> <strong>Nutrition</strong> Review
Katzman, R., Brown, R., Fuld, P., Peck, A., Schecter, R., & Schimmel, H. (1983).<br />
Validation of a short orientation-memory-concentration test of cognitive<br />
impairment. American Journal of Psychiatry, 140(6), 734-738.<br />
McCamey, M.A., Hawthorne, N.A., Reddy, S., Lombardo, M., Cress, M.E., &<br />
Johnson, M.A. (2003). A Statewide educational intervention to improve older<br />
Americans’ nutrition <strong>and</strong> physical activity. Family Economics <strong>and</strong> <strong>Nutrition</strong><br />
Review, 15(1).<br />
Millen, B.E., Ohls, J.C., Ponza, M., & McCool, A.C. (2002). The <strong>Elderly</strong> <strong>Nutrition</strong><br />
Program: An effective national framework <strong>for</strong> preventive nutrition interventions.<br />
Journal of the American Dietetic Association, 102(2), 234-240.<br />
Institute of Medicine, Food <strong>and</strong> <strong>Nutrition</strong> Board, St<strong>and</strong>ing Committee on the<br />
Scientific Evaluation of Dietary Reference Intakes. (1997). Dietary Reference<br />
Intake <strong>for</strong> calcium, phosphorus, magnesium, vitamin D, <strong>and</strong> fluoride.<br />
Washington, DC: National Academy Press.<br />
National Institutes of Health Consensus Development Panel on Osteoporosis<br />
Prevention, Diagnosis, <strong>and</strong> Therapy. (2001). Osteoporosis prevention, diagnosis,<br />
<strong>and</strong> therapy. Journal of the American Medical Association, 285(6), 785-795.<br />
National Osteoporosis Foundation. (2002). Fall Prevention. Retrieved October 7,<br />
2002, from: http://www.nof.org/patientinfo/fall_prevention.htm, <strong>and</strong> Prevention:<br />
Calcium & Vitamin D. Retrieved October 7, 2002, from http://www.nof.org/<br />
prevention/calcium.htm.<br />
Plautz, B., Beck, D.E., Selmar, C., & Radetsky, M. (1996). Modifying the<br />
environment: A community-based injury reduction program <strong>for</strong> elderly residents.<br />
American Journal of Preventive Medicine, 12(4 Suppl.), 33-38.<br />
Rolnick, S.J., Kopher, R., Jackson, J., Fischer, L.R., & Compo, R. (2001). What is<br />
the impact of osteoporosis education <strong>and</strong> bone mineral density testing <strong>for</strong><br />
postmenopausal women in a managed care setting? Menopause, 8(2), 141-148.<br />
Spangler, J.G., Qu<strong>and</strong>t, S., & Bell, R.A. (2001). Smokeless tobacco <strong>and</strong><br />
osteoporosis: A new relationship? Medical Hypotheses, 56(5), 553-557.<br />
Storm, D., Eslin, R., Porter, E.S., Musgrave, K., Vereault, D., Patton, C., Kessenich,<br />
C., et al. (1998). Calcium supplementation prevents seasonal bone loss <strong>and</strong><br />
changes in biochemical markers of bone turnover in elderly New Engl<strong>and</strong> women:<br />
A r<strong>and</strong>omized placebo-controlled trial. Journal of Clinical Endocrinology <strong>and</strong><br />
Metabolism, 83(11), 3817-3825.<br />
U.S. Department of Agriculture <strong>and</strong> U.S. Department of Health <strong>and</strong> Human<br />
Services. (2000). Dietary Guidelines <strong>for</strong> Americans. Retrieved October 7, 2002,<br />
from http://www.usda.gov/cnpp/DietGd.pdf.<br />
U.S. Department of Health <strong>and</strong> Human Services. (2000). Physical Activity <strong>and</strong><br />
Fitness, Chapter 22. In Healthy People 2010. Retrieved October 7, 2002, from<br />
http://www.health.gov/healthypeople/Document/HTML/Volume2/22Physical.htm.<br />
2003 Vol. 15 No. 1 91
Federal Studies<br />
The Older Population in the United States: March 2002<br />
In 2002, 59.6 million people in the civilian noninstitutionalized U.S. population were age 55 <strong>and</strong> over. This report by the<br />
Census Bureau presents a statistical portrait of selected social <strong>and</strong> economic characteristics of this older population, based<br />
on the results of the Annual Demographic Supplement to the March 2002 Current Population Survey. These characteristics,<br />
which are shown by age <strong>and</strong> sex, include race <strong>and</strong> Hispanic origin, marital status, educational attainment, labor <strong>for</strong>ce status,<br />
income, <strong>and</strong> poverty status.<br />
Women outnumber men among<br />
older adults<br />
Of the 59.6 million older people, 33.0<br />
million were women <strong>and</strong> 26.6 million<br />
were men, resulting in a sex ratio of<br />
81 men per 100 women. This ratio<br />
dropped steadily with age: In the 55 to<br />
64 age group, the sex ratio was 92; in<br />
the 85 years <strong>and</strong> over age group, the<br />
ratio was 46.<br />
Sex ratio of older population, by age<br />
Men per 100 women<br />
100<br />
92<br />
90<br />
83<br />
80<br />
70<br />
67<br />
60<br />
50<br />
40<br />
30<br />
20<br />
10<br />
46<br />
0<br />
55-64 65-74 75-84 85+<br />
Age<br />
Less diversity among older than<br />
younger population<br />
Non-Hispanic Whites accounted <strong>for</strong><br />
69 percent of the total population in<br />
2002. This proportion varied greatly<br />
with age—66 percent of people under<br />
age 55 <strong>and</strong> 81 percent of those age 55<br />
<strong>and</strong> over. The percentage of non-<br />
Hispanic Whites increased with age:<br />
79 percent <strong>for</strong> those 55 to 64 versus<br />
87 percent <strong>for</strong> those 85 <strong>and</strong> over.<br />
Racial/ethnic composition of population by age<br />
100<br />
80<br />
86% 87%<br />
79% 80%<br />
60 66%<br />
40<br />
20<br />
0<br />
More older men than older<br />
women likely to be working<br />
Percentage of older men <strong>and</strong> women in the labor <strong>for</strong>ce, by age<br />
Men age 55 <strong>and</strong> over were more likely<br />
than women to be in the labor <strong>for</strong>ce,<br />
<strong>and</strong> that proportion declined with age<br />
<strong>for</strong> both sexes. For men age 55 to 59,<br />
77 percent were in the labor <strong>for</strong>ce,<br />
compared with 63 percent of their<br />
female counterparts. Among people<br />
age 65 <strong>and</strong> over, 18 percent of men<br />
<strong>and</strong> 10 percent of women were in<br />
the labor <strong>for</strong>ce.<br />
Men<br />
Women<br />
10<br />
18<br />
44<br />
57<br />
63<br />
77<br />
55-59 years<br />
60-64 years<br />
65+ years<br />
0 10 20 30 40 50 60 70 80 90<br />
Poverty increases with age <strong>for</strong><br />
older population<br />
Of the total older population, 9.8<br />
percent were below the poverty level<br />
in 2001. The poverty rate was 9.4<br />
percent <strong>for</strong> those age 55 to 64 <strong>and</strong><br />
10.1 percent <strong>for</strong> those 65 years <strong>and</strong><br />
over. Older women, in general, had a<br />
higher poverty rate than did older men.<br />
Percentage of older population in poverty, overall <strong>and</strong> by age<br />
12<br />
9.8<br />
10.1<br />
10<br />
9.4<br />
8<br />
6<br />
4<br />
2<br />
0<br />
55+ 55-64 65+<br />
Age<br />
Source: Smith, D. (2003). The Older Population in the United States: March 2002. U.S. Census Bureau Current Population Reports,<br />
P20-546. Washington, DC.<br />
2003 Vol. 15 No. 1 93
School Lunch Program: Ef<strong>for</strong>ts Needed to Improve <strong>Nutrition</strong> <strong>and</strong> Encourage Healthful Eating<br />
A recent study by the Federal Government’s General Accounting Office found that although schools are moving toward<br />
meeting school lunch requirements, more improvements are needed. Lunches meet requirements <strong>for</strong> nutrients such as protein,<br />
vitamins, calcium, <strong>and</strong> iron, but they do not meet the st<strong>and</strong>ards <strong>for</strong> dietary fat. Also, ef<strong>for</strong>ts to encourage healthful eating<br />
could be increased. Most students have access to foods of little nutritional value, such as soft drinks <strong>and</strong> c<strong>and</strong>y, at school.<br />
Students may need more exposure to nutrition education to make positive changes in behavior. Barriers to providing<br />
nutritious meals <strong>and</strong> encouraging healthful eating included budget pressures <strong>and</strong> competing time dem<strong>and</strong>s. However,<br />
schools had taken a variety of innovative steps to overcome barriers.<br />
School lunches contain more<br />
vitamin A <strong>and</strong> C<br />
In 1991-92 <strong>and</strong> 1998-99, the mean<br />
nutrient content of elementary <strong>and</strong><br />
secondary school lunches met the<br />
National School Lunch Program<br />
st<strong>and</strong>ards <strong>for</strong> vitamin A (300 mcg RE<br />
or more <strong>for</strong> secondary school lunches)<br />
<strong>and</strong> vitamin C (18 mg or more <strong>for</strong><br />
secondary school lunches). For both of<br />
these vitamins, the mean school lunch<br />
content increased over this time. In<br />
secondary schools, the mean vitamin A<br />
<strong>and</strong> C content of school lunches<br />
increased 24 percent.<br />
Mean vitamin A <strong>and</strong> C content of secondary school lunches<br />
Micrograms RE<br />
600<br />
500<br />
400<br />
300<br />
200<br />
100<br />
0<br />
418<br />
519<br />
1991-92 1998-99<br />
Vitamin A<br />
Milligrams<br />
50<br />
40<br />
30<br />
20<br />
10<br />
0<br />
34<br />
42<br />
1991-92 1998-99<br />
Vitamin C<br />
However, school lunches do<br />
not meet st<strong>and</strong>ards <strong>for</strong> dietary fat<br />
In 1991-92 <strong>and</strong> 1998-99, elementary<br />
<strong>and</strong> secondary school lunches did not<br />
meet the dietary st<strong>and</strong>ards <strong>for</strong> total<br />
<strong>and</strong> saturated fat: 30 percent or less<br />
of calories from total fat <strong>and</strong> 10<br />
percent or less of calories from<br />
saturated fat. School lunches had been<br />
moving toward the st<strong>and</strong>ards over this<br />
time. In secondary schools, the average<br />
percentage of calories from total fat in<br />
school lunches declined 4 percentage<br />
points <strong>and</strong> from saturated fat,<br />
3 percentage points.<br />
Average total <strong>and</strong> saturated fat content of secondary school lunches<br />
Percentage calories from fat<br />
40<br />
30<br />
20<br />
10<br />
0<br />
38%<br />
34%<br />
15%<br />
12%<br />
1991-92 1998-99 1991-92 1998-99<br />
Total fat<br />
Saturated fat<br />
94 Family Economics <strong>and</strong> <strong>Nutrition</strong> Review
Schools offer a mix of foods in<br />
addition to school lunches<br />
Those parts of the school nutrition<br />
environment not regulated by the<br />
government (e.g., a la carte cafeteria<br />
items <strong>and</strong> food <strong>and</strong> beverages in<br />
vending machines) offered a mix of<br />
foods. Although many schools offered<br />
lowfat foods (including fruits <strong>and</strong><br />
vegetables) in these unregulated places,<br />
many also offered foods <strong>and</strong> beverages<br />
of limited nutritional value. In 2000,<br />
36 percent of elementary schools<br />
served lowfat baked goods a la carte,<br />
while 49 percent served baked goods<br />
classified as not low in fat.<br />
Percentage of elementary schools offering a la carte lowfat <strong>and</strong> nonlowfat<br />
cookies, crackers, <strong>and</strong> pastries<br />
Lowfat<br />
Non lowfat<br />
36%<br />
49%<br />
0 10 20 30 40 50 60<br />
<strong>Nutrition</strong> education offered a few<br />
hours in most elementary schools<br />
Percentage of elementary school teachers presenting lessons about<br />
nutrition<br />
<strong>Nutrition</strong> education is one way to<br />
promote good dietary habits among<br />
youth. In 1996-97, most kindergarten<br />
through fifth-grade teachers presented<br />
lessons about nutrition. Although<br />
time <strong>and</strong> intensity of the instruction<br />
mattered, the average total amount of<br />
time that teachers devoted to nutrition<br />
education was 13 hours per school<br />
year.<br />
88%<br />
12%<br />
Not presenting<br />
Presenting<br />
U.S. General Accounting Office, Report to Congressional Requesters. (2003, May). School Lunch Program: Ef<strong>for</strong>ts Needed to Improve<br />
<strong>Nutrition</strong> <strong>and</strong> Encourage Healthy Eating. GAO-03-506.<br />
2003 Vol. 15 No. 1 95
Recent Changes in U.S. Family Finances<br />
There has been a striking pattern of growth in family income <strong>and</strong> net worth between 1998 <strong>and</strong> 2001 according to a Federal<br />
Reserve Board study, which was based on data from the Survey of Consumer Finances. Generally, inflation-adjusted incomes<br />
of families rose; although growth was fastest among families whose income was higher than the median. The median value of<br />
family net worth grew faster than that of income, but as with income, the growth rates of net worth were fastest <strong>for</strong> the group<br />
above the median. The level of debt carried by families rose over the period, but the expansion in equities <strong>and</strong> the increased<br />
values of principal residences <strong>and</strong> other assets were sufficient to reduce debt as a proportion of family assets. For groups with<br />
relatively low levels of income <strong>and</strong> wealth, a concurrent rise in the frequency of late debt payments indicated that their ability<br />
to service their debts had deteriorated.<br />
Income growth faster at top<br />
<strong>and</strong> bottom<br />
Between 1998 <strong>and</strong> 2001, income grew<br />
at different rates in different parts of the<br />
income distribution between 1998 <strong>and</strong><br />
2001, with faster growth at both the top<br />
<strong>and</strong> bottom of the ranges than in the<br />
middle. During this period, the median<br />
income of all families grew from<br />
$36,400 to $39,900 (in 2001 dollars).<br />
For families in the lowest 20 percent<br />
of the income distribution, income grew<br />
from $9,000 to $10,300; <strong>for</strong> families in<br />
the top 10 percent, income grew from<br />
$142,200 to $169,600 (in 2001<br />
dollars).<br />
Real income growth (1998-2001), by percentile of income<br />
Percent increase<br />
25<br />
20<br />
19.3<br />
15 14.4<br />
14.8<br />
11.7<br />
10<br />
10.4<br />
9.6<br />
5<br />
0<br />
More families own stock<br />
Families may hold stocks in publicly<br />
traded companies directly or indirectly,<br />
such as through mutual funds or retirement<br />
accounts. In 2001, 52 percent<br />
of families held stock in some <strong>for</strong>m,<br />
3 percentage points above that in 1998.<br />
Over the 3-year period, ownership rates<br />
rose <strong>for</strong> most families, particularly<br />
those headed by someone less than<br />
age 35.<br />
Percentage of all families <strong>and</strong> those headed by someone less than<br />
age 35 who own stock<br />
100<br />
80<br />
60<br />
40<br />
20<br />
49<br />
41<br />
52<br />
49<br />
0<br />
1998 2001<br />
All families<br />
Families headed by
Consumer Expenditures in 2001<br />
Consumer units spent $39,518 on average in 2001, an increase of 3.9 percent over the previous year. Expenditures rose<br />
2.8 percent in 2000 <strong>and</strong> 4.1 percent in 1999. The increase in spending in 2001 was more than the 2.8-percent annual<br />
average rise in general price levels over the year, as measured by the Consumer Price Index. This report shows the latest<br />
results from the Bureau of Labor Statistics Consumer Expenditure Survey. The Survey collects in<strong>for</strong>mation on the buying<br />
habits of American consumers <strong>and</strong> consists of two components: A Diary or recordkeeping survey completed by participating<br />
consumer units <strong>for</strong> two consecutive 1-week periods; <strong>and</strong> an Interview survey, in which expenditures of consumer units<br />
are obtained in five interviews conducted at 3-month intervals. Results in this report are based on integrated data from<br />
both surveys.<br />
Housing is the major expense<br />
Total expenses ($39,518) of consumer units by budgetary component<br />
Housing accounted <strong>for</strong> the largest<br />
expense by consumer units in 2001,<br />
making up 33 percent of total<br />
expenditures. Transportation was the<br />
second largest at 19 percent of total<br />
expenses <strong>and</strong> food the third, 13 percent<br />
of total expenses. Other expenses (e.g.,<br />
personal care products, education,<br />
alcohol <strong>and</strong> tobacco) comprised<br />
10 percent of total expenditures.<br />
Personal insurance <strong>and</strong> pensions<br />
10%<br />
Entertainment<br />
5%<br />
Health care<br />
6%<br />
Other<br />
10%<br />
Housing<br />
33%<br />
Transportation<br />
19%<br />
Clothing<br />
4%<br />
Food<br />
13%<br />
Food away from home a<br />
significant share of total food<br />
expenses<br />
Food away from home accounted <strong>for</strong><br />
42 percent of total food expenses <strong>for</strong><br />
all consumer units in 2001 ($2,235<br />
out of $5,321). Whereas food at home<br />
expenses grew 2.2 percent over the<br />
2000-2001 period, food away from<br />
home expenses rose 4.6 percent.<br />
Consumer units spent $349 on alcohol<br />
in 2001, a 6.2-percent decline from<br />
2000.<br />
Food <strong>and</strong> alcohol expenses of consumer units<br />
Food (Total)<br />
Food at home<br />
$3,086<br />
Food away<br />
$2,235<br />
Alcohol $349<br />
$5,321<br />
98 Family Economics <strong>and</strong> <strong>Nutrition</strong> Review
Expenditures vary by age<br />
Expenses of consumer units vary by<br />
age of the head. Units headed by a<br />
35- to 44-year-old had total expenses<br />
of $46,908, compared with $23,099<br />
<strong>for</strong> units headed by a 75-year-old <strong>and</strong><br />
over. Housing accounted <strong>for</strong> 34 to 35<br />
percent of expenses <strong>for</strong> both groups.<br />
Health care, however, made up 4<br />
percent of expenses <strong>for</strong> units headed<br />
by a 35- to 44-year-old <strong>and</strong> 15 percent<br />
<strong>for</strong> those headed by a 75-year-old<br />
<strong>and</strong> over.<br />
Total expenses of consumer units by budgetary component, by age<br />
of head<br />
100<br />
80<br />
60<br />
40<br />
20<br />
$46,908<br />
$23,099<br />
Other<br />
Personal insurance <strong>and</strong> pensions<br />
Entertainment<br />
Health care<br />
Transportation<br />
Clothing<br />
Food<br />
Housing<br />
0<br />
35- to 44-year-old 75-year-old <strong>and</strong> over<br />
Expenses higher in the West<br />
Total expenses of consumer units, by region<br />
Consumer units in the West had the<br />
highest total expenditure ($43,261)<br />
<strong>and</strong> units in the South the lowest<br />
($36,285). Housing contributed to<br />
this regional expense difference,<br />
being $15,000 <strong>for</strong> consumer units<br />
in the West <strong>and</strong> $11,375 <strong>for</strong> units in<br />
the South. Consumer units in the West<br />
<strong>and</strong> South spent similar amounts on<br />
health care ($2,129 <strong>and</strong> $2,194,<br />
respectively).<br />
West<br />
$43,261<br />
Midwest<br />
$39,548<br />
South<br />
$36,285<br />
Northeast<br />
$41,169<br />
Source: U.S. Department of Labor, Bureau of Labor Statistics. (2003, April). Consumer Expenditures in 2001. Report 966.<br />
2003 Vol. 15 No. 1 99
Official <strong>US</strong>DA Food Plans: Cost of Food at Home at Four Levels,<br />
U.S. Average, September 2003 1<br />
WEEKLY COST<br />
MONTHLY COST<br />
AGE-GENDER Thrifty Low-cost Moderate- Liberal Thrifty Low-cost Moderate- Liberal<br />
GROUPS plan plan cost plan plan plan plan cost plan plan<br />
INDIVIDUALS 2<br />
CHILD:<br />
1 year $17.00 $21.20 $24.80 $30.10 $73.70 $91.90 $107.50 $130.40<br />
2 years 17.00 21.00 24.70 30.10 73.70 91.00 107.00 130.40<br />
3-5 years 18.60 23.10 28.50 34.30 80.60 100.10 123.50 148.60<br />
6-8 years 23.20 30.90 38.20 44.50 100.50 133.90 165.50 192.80<br />
9-11 years 27.30 34.90 44.50 51.70 118.30 151.20 192.80 224.00<br />
MALE:<br />
12-14 years 28.30 39.40 48.70 57.40 122.60 170.70 211.00 248.70<br />
15-19 years 29.30 40.60 50.60 58.60 127.00 175.90 219.20 253.90<br />
20-50 years 31.30 40.50 50.40 61.30 135.60 175.50 218.40 265.60<br />
51 years <strong>and</strong> over 28.40 38.60 47.40 57.00 123.10 167.30 205.40 247.00<br />
FEMALE:<br />
12-19 years 28.30 34.00 41.20 49.80 122.60 147.30 178.50 215.80<br />
20-50 years 28.30 35.30 43.10 55.40 122.60 153.00 186.80 240.00<br />
51 years <strong>and</strong> over 27.80 34.30 42.70 51.10 120.50 148.60 185.00 221.40<br />
FAMILIES:<br />
FAMILY OF 2 3 :<br />
20-50 years 65.60 83.40 102.90 128.40 284.00 361.40 445.70 556.20<br />
51 years <strong>and</strong> over 61.80 80.20 99.10 118.90 268.00 347.50 429.40 515.20<br />
FAMILY OF 4:<br />
Couple, 20-50 years<br />
<strong>and</strong> children—<br />
2 <strong>and</strong> 3-5 years 95.20 119.90 146.70 181.10 412.50 519.60 635.70 784.60<br />
6-8 <strong>and</strong> 9-11 years 110.10 141.60 176.20 212.90 477.00 613.60 763.50 922.40<br />
1 Basis is that all meals <strong>and</strong> snacks are purchased at stores <strong>and</strong> prepared at home. For specific foods <strong>and</strong> quantities of foods in the Thrifty<br />
Food Plan, see Family Economics <strong>and</strong> <strong>Nutrition</strong> Review, Vol. 13, No. 1 (2001), pp. 50-64; <strong>for</strong> specific foods <strong>and</strong> quantities of foods in<br />
the Low-Cost, Moderate-Cost, <strong>and</strong> Liberal Plans, see The Low-Cost, Moderate-Cost, <strong>and</strong> Liberal Food Plans, 2003 Administrative<br />
Report (2003). All four Food Plans are based on 1989-91 data <strong>and</strong> are updated to current dollars using the Consumer Price Index <strong>for</strong><br />
specific food items.<br />
2 The costs given are <strong>for</strong> individuals in 4-person families. For individuals in other size families, the following adjustments are suggested:<br />
1-person—add 20 percent; 2-person—add 10 percent; 3-person—add 5 percent; 5- or 6-person—subtract 5 percent; 7- (or more)<br />
person—subtract 10 percent.<br />
3 Ten percent added <strong>for</strong> family size adjustment.<br />
100 Family Economics <strong>and</strong> <strong>Nutrition</strong> Review
Consumer Prices<br />
Consumer<br />
Consumer<br />
Prices<br />
Prices<br />
Average percent change <strong>for</strong> major budgetary components<br />
Annual average percent change from<br />
Percent change<br />
December of previous year to December: 12 months ending<br />
Group 1990 1995 2000 with September 2003<br />
All Items 6.1 2.5 3.4 2.3<br />
Food 5.3 2.1 2.8 2.4<br />
Food at home 5.8 2.0 3.0 2.8<br />
Food away from home 4.5 2.2 2.4 2.0<br />
Housing 4.5 3.0 4.3 2.4<br />
Apparel 5.1 0.1 −1.9 −2.1<br />
Transportation 10.4 1.5 4.3 3.5<br />
Medical care 9.6 3.9 4.2 4.0<br />
Recreation NA 2.8 1.4 1.4<br />
Education <strong>and</strong> communication NA 4.0 1.2 1.3<br />
Other goods <strong>and</strong> services 7.6 4.3 4.5 1.0<br />
Price per pound <strong>for</strong> selected food items<br />
Price per pound unless otherwise noted<br />
(as of December in each year)<br />
September<br />
Food 1990 1995 2000 2003<br />
Flour, white, all purpose $ .24 $ .24 $ .28 $ .32<br />
Rice, white, long grain, uncooked .49 .55 NA .46<br />
Spaghetti <strong>and</strong> macaroni .85 .88 .88 .87<br />
Bread, white .70 .84 .99 .99<br />
Beef, ground, uncooked 1.63 1.40 1.63 2.02<br />
Pork chops, center cut, bone-in 3.32 3.29 3.46 3.09<br />
Chicken, fresh, whole .86 .94 1.08 1.02<br />
Tuna, light, chunk 2.11 2.00 1.92 1.79<br />
Eggs, grade A, large, per dozen 1.00 1.16 .96 1.26<br />
Butter, salted, grade AA, stick 1.92 1.73 2.80 2.86<br />
Apples, red delicious .77 .83 .82 1.02<br />
Bananas .43 .45 .49 .49<br />
Oranges, navel .56 .64 .62 NA<br />
Potatoes, white .32 .38 .35 .44<br />
Lettuce, iceberg .58 .61 .85 .90<br />
Tomatoes, field grown .86 1.51 1.57 1.44<br />
Broccoli NA .76 1.52 1.30<br />
Orange juice, frozen concentrate per 16 oz. 2.02 1.57 1.88 1.90<br />
Sugar, white, 33-80 oz. pkg. .40 .39 .40 .41<br />
Margarine, stick .87 .79 NA 1.00<br />
Peanut butter, creamy 2.09 1.78 1.96 1.89<br />
Coffee, 100% ground roast 2.94 3.75 3.21 2.92<br />
NA = Data not available.<br />
Selected items from CPI Detailed Reports, Bureau of Labor Statistics, various issues. Price changes are <strong>for</strong> all urban consumers. Food prices are<br />
U.S. city average.<br />
2003 Vol. 15 No. 1<br />
101
U.S. Poverty Thresholds <strong>and</strong> Related Statistics<br />
Poverty Thresholds in 2000, 2002, by by size of of family <strong>and</strong> number of of related children under under age 18years<br />
Related children under age 18<br />
Eight<br />
Size of family unit None One Two Three Four Five Six Seven or more<br />
One person<br />
Under age 65 $9,359<br />
Age 65 <strong>and</strong> over 8,628<br />
Two people<br />
Householder under age 65 12,047 $12,400<br />
Householder age 65 <strong>and</strong> over 10,874 12,353<br />
Three people 14,072 14,480 $14,494<br />
Four people 18,556 18,859 18,244 $18,307<br />
Five people 22,377 22,703 22,007 21,469 $21,141<br />
Six people 25,738 25,840 25,307 24,797 24,038 $23,588<br />
Seven people 29,615 29,799 29,162 28,718 27,890 26,924 $25,865<br />
Eight people 33,121 33,414 32,812 32,285 31,538 30,589 29,601 $29,350<br />
Nine people or more 39,843 40,036 39,504 39,057 38,323 37,313 36,399 36,173 $34,780<br />
Source: U.S Census Bureau, February 2003.<br />
Poverty rate by region, 2001<br />
West<br />
12.1%<br />
Midwest<br />
9.4%<br />
22.9%<br />
Northeast<br />
10.7%<br />
27.1%<br />
10.7%<br />
South<br />
13.5%<br />
Source: U.S Census Bureau.<br />
102 Family Economics <strong>and</strong> <strong>Nutrition</strong> Review
2003 Vol. 15 No. 1 103
United States Department of<br />
Agriculture<br />
CENTER FOR NUTRITION<br />
POLICY AND PROMOTION<br />
Check the CNPP Web site (www.cnpp.usda.gov)<br />
<strong>for</strong> the following in<strong>for</strong>mation <strong>and</strong> publications:<br />
• Dietary Guidelines <strong>for</strong> Americans<br />
• Food Guide Pyramid<br />
• Food Guide Pyramid <strong>for</strong> Young Children<br />
• <strong>US</strong>DA Food Plans<br />
• Healthy Eating Index<br />
• Interactive Healthy Eating Index<br />
• Nutrient Content of the U.S. Food Supply<br />
• Interactive Food Supply<br />
• Expenditures on Children by Families<br />
• <strong>Nutrition</strong> Insights<br />
• Web-Based Training<br />
• Family Economics <strong>and</strong> <strong>Nutrition</strong> Review<br />
104 Family Economics <strong>and</strong> <strong>Nutrition</strong> Review
Guidelines <strong>for</strong> Submissions to<br />
Family Economics <strong>and</strong> <strong>Nutrition</strong> Review<br />
Family Economics <strong>and</strong> <strong>Nutrition</strong> Review (FENR) is a semi-annual journal published by the <strong>Center</strong> <strong>for</strong> <strong>Nutrition</strong> <strong>Policy</strong><br />
<strong>and</strong> <strong>Promotion</strong>, United States Department of Agriculture. Research articles <strong>and</strong> briefs are peer-reviewed. FENR will<br />
consider manuscripts concerning economic <strong>and</strong> nutritional issues related to the health <strong>and</strong> well-being of U.S. families.<br />
We are especially interested in studies about U.S. population groups at risk—from either an economic or a nutritional<br />
perspective. Research may be based on primary or secondary data as long as it is national or regional in scope or of<br />
national policy interest. Subject matter should be based on research findings of interest to a wide family economics<br />
<strong>and</strong> nutrition audience, including Federal, State, <strong>and</strong> local government officials, nutrition <strong>and</strong> economic educators,<br />
<strong>and</strong> social scientists.<br />
Your submission should contain the following:<br />
♦ an affiliation page that lists the author’s(s’) full name, academic degree(s), employer, <strong>and</strong> title. This list of names<br />
must consist only of those who had an instrumental role in developing the manuscript being submitted.<br />
♦ a short abstract (150 words) that summarizes the major findings. Abstracts are required <strong>for</strong> research articles,<br />
not <strong>for</strong> research briefs.<br />
♦ text of 12 to 20 double-spaced pages <strong>for</strong> research articles or 5 to 10 double-spaced pages <strong>for</strong> research briefs.<br />
Tables are single spaced. Articles over 20 pages in length will be considered by the FENR editorial staff only in<br />
exceptional circumstances. Page limits include references but exclude author’s(s’) affiliation page, abstract page,<br />
tables, <strong>and</strong> graphs.<br />
♦ no more than a total of five tables, graphs, <strong>and</strong> boxes <strong>for</strong> research articles <strong>and</strong> two <strong>for</strong> research briefs to<br />
illustrate major findings. Tables larger than 1 full page will not be considered. Tables <strong>and</strong> graphs labeled<br />
“1a, 1b, 1c,” <strong>for</strong> example, will count as three submissions.<br />
♦ acknowledgment of the source of funding <strong>for</strong> the research.<br />
Style:<br />
The writing style must be more journalistic than that used in purely academic journals. We encourage authors to<br />
report descriptive statistics rather than multivariate analyses. We also encourage authors to use the active voice, to<br />
avoid jargon, to keep acronyms to a minimum, <strong>and</strong> to explain any technical terms. To be considered <strong>for</strong> publication,<br />
all manuscripts must follow the guidelines of the Publication Manual of the American Psychological Association,<br />
5 th edition.<br />
Format:<br />
FENR articles follow this general <strong>for</strong>mat: (1) abstract (<strong>for</strong> research articles only), (2) background, (3) methods, (4) results,<br />
(5) conclusions, (6) acknowledgments, <strong>and</strong> (7) references.<br />
Tables, boxes, graphs, <strong>and</strong> other graphics should include titles in bold <strong>and</strong> sources at the bottom (if the data are from<br />
another source). Tables should be arranged to fit vertically (portrait style) on the page <strong>and</strong> should be done in a word<br />
processing program (Word, WordPerfect) by using tabs rather than a table function.<br />
Refer to the Publication Manual of the American Psychological Association, 5 th edition, <strong>for</strong> in<strong>for</strong>mation concerning the<br />
citation of references.<br />
The font size of the text must be no smaller than 11 points; <strong>for</strong> tables, 10 points. Margins should be no smaller than<br />
1 inch.<br />
Review:<br />
Research articles <strong>and</strong> briefs are peer-reviewed by a minimum of 2 professionals, with significant knowledge of the field,<br />
<strong>and</strong> are reviewed <strong>and</strong> edited by the FENR editorial staff. To review the criteria used by our peer reviewers, please follow<br />
the links related to the journal at our Website.<br />
Send your electronic copy to the managing editor:<br />
jane.fleming@cnpp.usda.gov<br />
For specific questions or further in<strong>for</strong>mation,<br />
contact the editor or managing editor:<br />
Phone: (703) 305-2732 or (703) 605-4435<br />
Fax: (703) 305-3300<br />
email: julia.dinkins@cnpp.usda.gov<br />
jane.fleming@cnpp.usda.gov