Elderly Nutrition - Center for Nutrition Policy and Promotion - US ...
Elderly Nutrition - Center for Nutrition Policy and Promotion - US ...
Elderly Nutrition - Center for Nutrition Policy and Promotion - US ...

You also want an ePaper? Increase the reach of your titles
YUMPU automatically turns print PDFs into web optimized ePapers that Google loves.
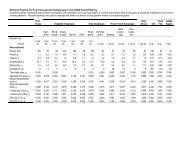
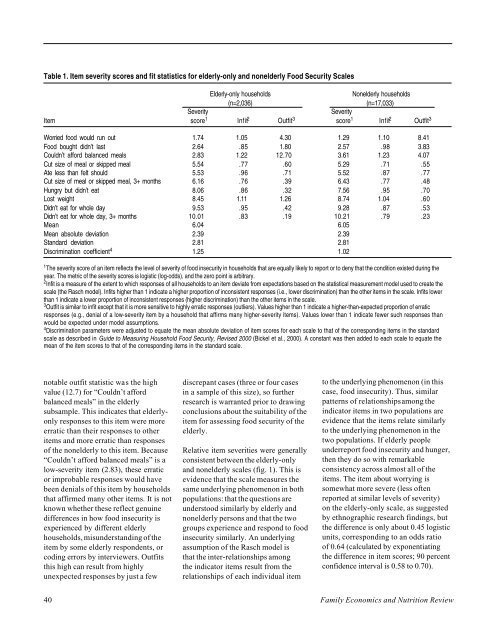
Table 1. Item severity scores <strong>and</strong> fit statistics <strong>for</strong> elderly-only <strong>and</strong> nonelderly Food Security Scales<br />
<strong>Elderly</strong>-only households Nonelderly households<br />
(n=2,036) (n=17,033)<br />
Severity Severity<br />
Item score 1 Infit 2 Outfit 3 score 1 Infit 2 Outfit 3<br />
Worried food would run out 1.74 1.05 4.30 1.29 1.10 8.41<br />
Food bought didn’t last 2.64 .85 1.80 2.57 .98 3.83<br />
Couldn’t af<strong>for</strong>d balanced meals 2.83 1.22 12.70 3.61 1.23 4.07<br />
Cut size of meal or skipped meal 5.54 .77 .60 5.29 .71 .55<br />
Ate less than felt should 5.53 .96 .71 5.52 .87 .77<br />
Cut size of meal or skipped meal, 3+ months 6.16 .76 .39 6.43 .77 .48<br />
Hungry but didn’t eat 8.06 .86 .32 7.56 .95 .70<br />
Lost weight 8.45 1.11 1.26 8.74 1.04 .60<br />
Didn’t eat <strong>for</strong> whole day 9.53 .95 .42 9.28 .87 .53<br />
Didn’t eat <strong>for</strong> whole day, 3+ months 10.01 .83 .19 10.21 .79 .23<br />
Mean 6.04 6.05<br />
Mean absolute deviation 2.39 2.39<br />
St<strong>and</strong>ard deviation 2.81 2.81<br />
Discrimination coefficient 4 1.25 1.02<br />
1 The severity score of an item reflects the level of severity of food insecurity in households that are equally likely to report or to deny that the condition existed during the<br />
year. The metric of the severity scores is logistic (log-odds), <strong>and</strong> the zero point is arbitrary.<br />
2 Infit is a measure of the extent to which responses of all households to an item deviate from expectations based on the statistical measurement model used to create the<br />
scale (the Rasch model). Infits higher than 1 indicate a higher proportion of inconsistent responses (i.e., lower discrimination) than the other items in the scale. Infits lower<br />
than 1 indicate a lower proportion of inconsistent responses (higher discrimination) than the other items in the scale.<br />
3 Outfit is similar to infit except that it is more sensitive to highly erratic responses (outliers). Values higher than 1 indicate a higher-than-expected proportion of erratic<br />
responses (e.g., denial of a low-severity item by a household that affirms many higher-severity items). Values lower than 1 indicate fewer such responses than<br />
would be expected under model assumptions.<br />
4 Discrimination parameters were adjusted to equate the mean absolute deviation of item scores <strong>for</strong> each scale to that of the corresponding items in the st<strong>and</strong>ard<br />
scale as described in Guide to Measuring Household Food Security, Revised 2000 (Bickel et al., 2000). A constant was then added to each scale to equate the<br />
mean of the item scores to that of the corresponding items in the st<strong>and</strong>ard scale.<br />
notable outfit statistic was the high<br />
value (12.7) <strong>for</strong> “Couldn’t af<strong>for</strong>d<br />
balanced meals” in the elderly<br />
subsample. This indicates that elderlyonly<br />
responses to this item were more<br />
erratic than their responses to other<br />
items <strong>and</strong> more erratic than responses<br />
of the nonelderly to this item. Because<br />
“Couldn’t af<strong>for</strong>d balanced meals” is a<br />
low-severity item (2.83), these erratic<br />
or improbable responses would have<br />
been denials of this item by households<br />
that affirmed many other items. It is not<br />
known whether these reflect genuine<br />
differences in how food insecurity is<br />
experienced by different elderly<br />
households, misunderst<strong>and</strong>ing of the<br />
item by some elderly respondents, or<br />
coding errors by interviewers. Outfits<br />
this high can result from highly<br />
unexpected responses by just a few<br />
discrepant cases (three or four cases<br />
in a sample of this size), so further<br />
research is warranted prior to drawing<br />
conclusions about the suitability of the<br />
item <strong>for</strong> assessing food security of the<br />
elderly.<br />
Relative item severities were generally<br />
consistent between the elderly-only<br />
<strong>and</strong> nonelderly scales (fig. 1). This is<br />
evidence that the scale measures the<br />
same underlying phenomenon in both<br />
populations: that the questions are<br />
understood similarly by elderly <strong>and</strong><br />
nonelderly persons <strong>and</strong> that the two<br />
groups experience <strong>and</strong> respond to food<br />
insecurity similarly. An underlying<br />
assumption of the Rasch model is<br />
that the inter-relationships among<br />
the indicator items result from the<br />
relationships of each individual item<br />
to the underlying phenomenon (in this<br />
case, food insecurity). Thus, similar<br />
patterns of relationships among the<br />
indicator items in two populations are<br />
evidence that the items relate similarly<br />
to the underlying phenomenon in the<br />
two populations. If elderly people<br />
underreport food insecurity <strong>and</strong> hunger,<br />
then they do so with remarkable<br />
consistency across almost all of the<br />
items. The item about worrying is<br />
somewhat more severe (less often<br />
reported at similar levels of severity)<br />
on the elderly-only scale, as suggested<br />
by ethnographic research findings, but<br />
the difference is only about 0.45 logistic<br />
units, corresponding to an odds ratio<br />
of 0.64 (calculated by exponentiating<br />
the difference in item scores; 90 percent<br />
confidence interval is 0.58 to 0.70).<br />
40 Family Economics <strong>and</strong> <strong>Nutrition</strong> Review